HyperDX


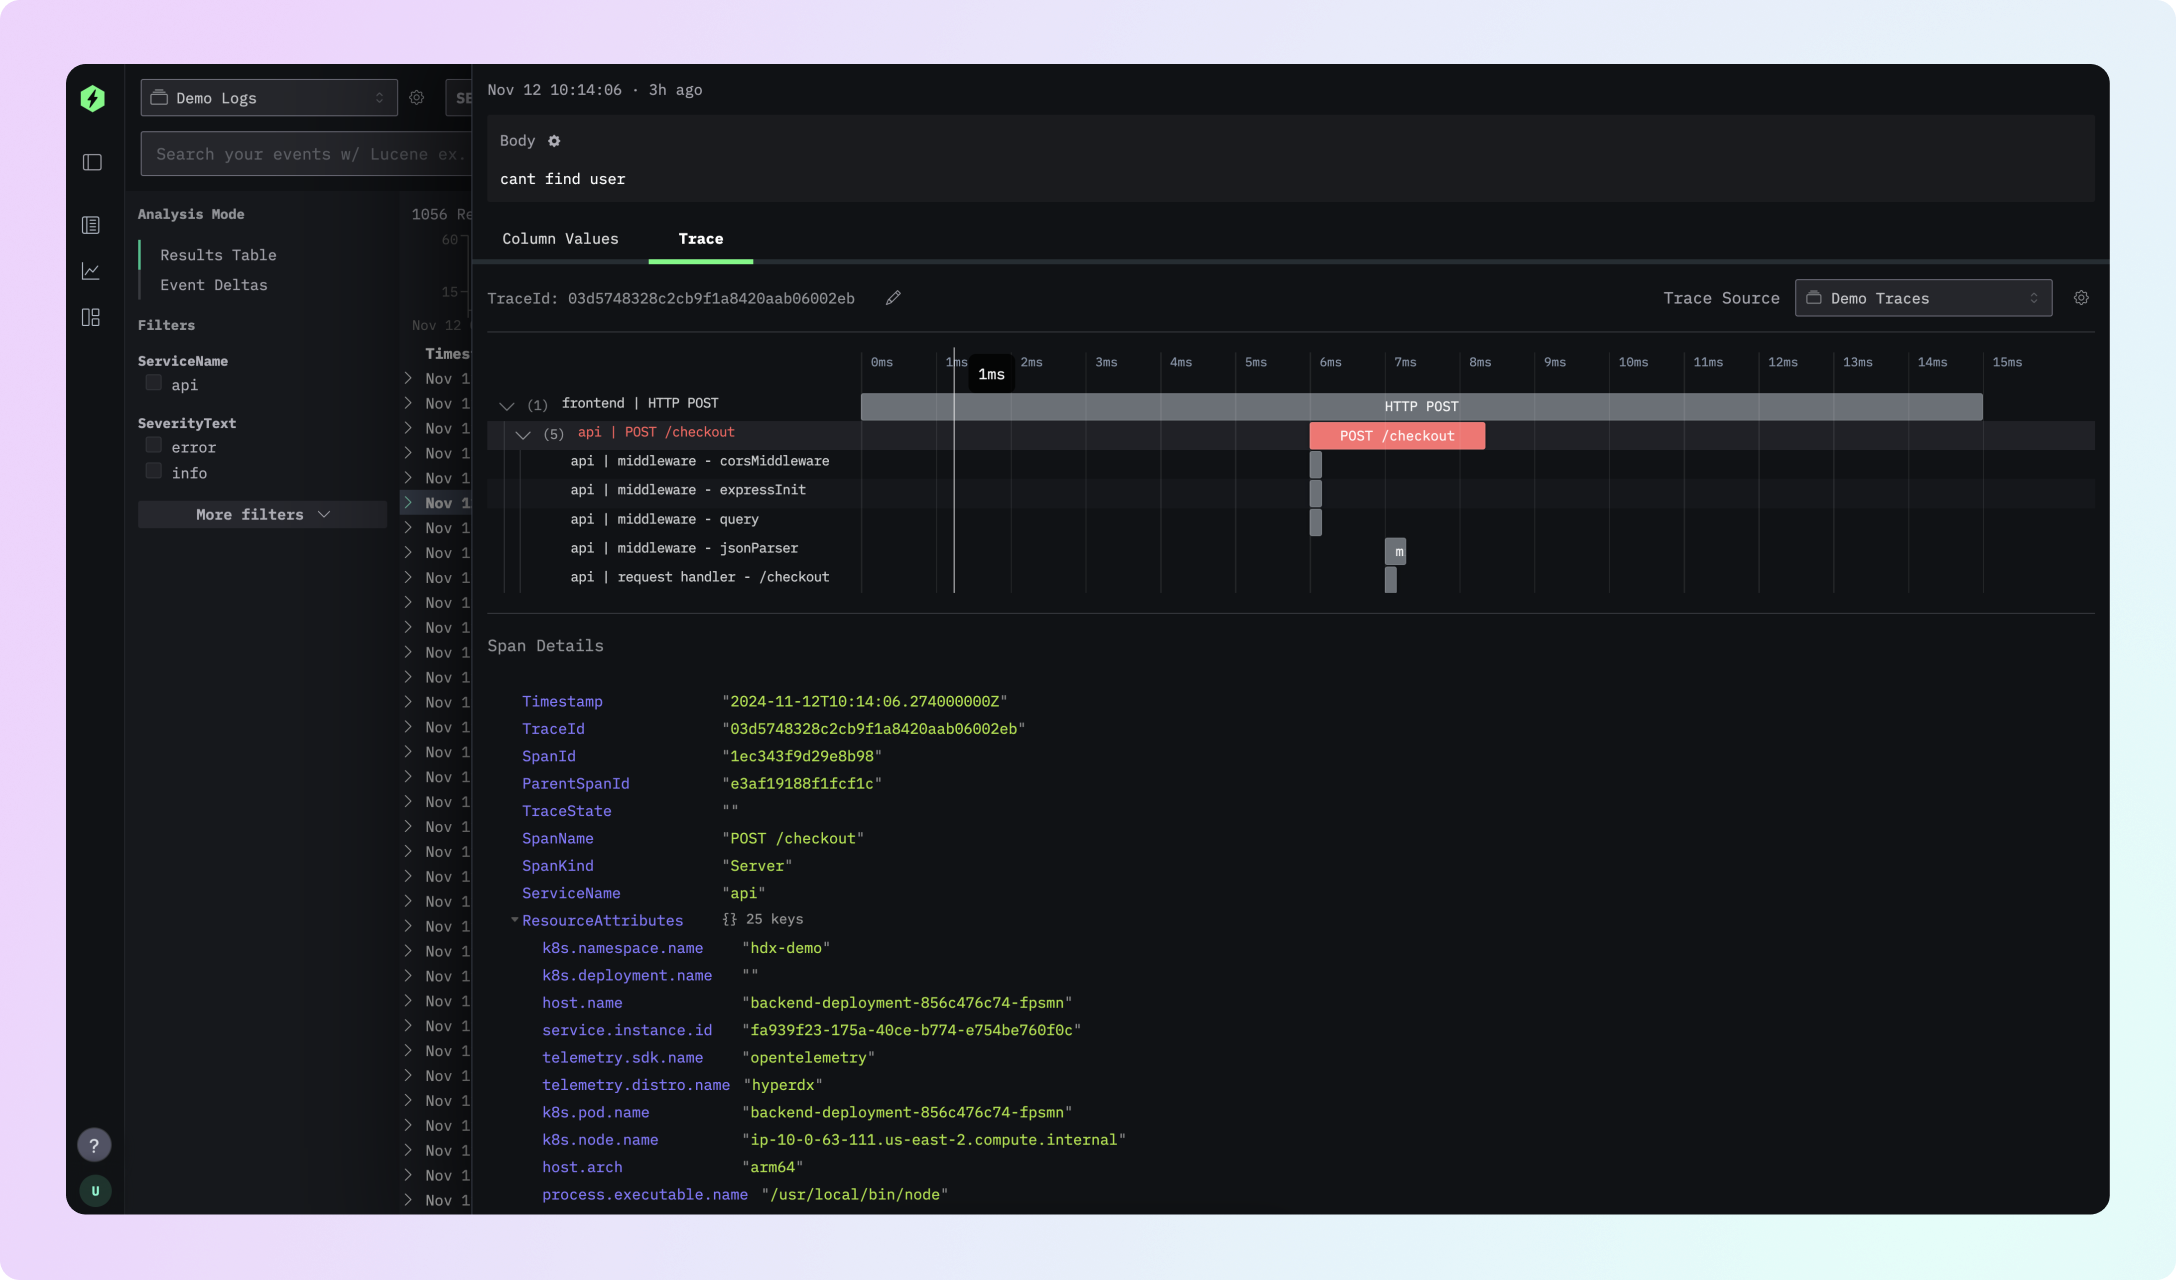
HyperDX, a core component of ClickStack, helps engineers quickly figure out why production is broken by making it easy to search & visualize logs and traces on top of any ClickHouse cluster (imagine Kibana, for ClickHouse).
Documentation • Chat on Discord • Live Demo • Bug Reports • Contributing • Website
- 🕵️ Correlate/search logs, metrics, session replays and traces all in one place
- 📝 Schema agnostic, works on top of your existing ClickHouse schema
- 🔥 Blazing fast searches & visualizations optimized for ClickHouse
- 🔍 Intuitive full-text search and property search syntax (ex.
level:err), SQL optional! - 📊 Analyze trends in anomalies with event deltas
- 🔔 Set up alerts in just a few clicks
- 📈 Dashboard high cardinality events without a complex query language
{Native JSON string querying- ⚡ Live tail logs and traces to always get the freshest events
- 🔭 OpenTelemetry supported out of the box
- ⏱️ Monitor health and performance from HTTP requests to DB queries (APM)
Spinning Up HyperDX
HyperDX can be deployed as part of ClickStack, which includes ClickHouse, HyperDX, OpenTelemetry Collector and MongoDB.
docker run -p 8080:8080 -p 4317:4317 -p 4318:4318 docker.hyperdx.io/hyperdx/hyperdx-all-in-one
Afterwards, you can visit http://localhost:8080 to access the HyperDX UI.
If you already have an existing ClickHouse instance, want to use a single container locally, or are looking for production deployment instructions, you can view the different deployment options in our deployment docs.
If your server is behind a firewall, you'll need to open/forward port 8080, 8000 and 4318 on your firewall for the UI, API and OTel collector respectively.
We recommend at least 4GB of RAM and 2 cores for testing.
Hosted ClickHouse Cloud
You can also deploy HyperDX with ClickHouse Cloud, you can sign up for free and get started in just minutes.
Instrumenting Your App
To get logs, metrics, traces, session replay, etc into HyperDX, you'll need to instrument your app to collect and send telemetry data over to your HyperDX instance.
We provide a set of SDKs and integration options to make it easier to get started with HyperDX, such as Browser, Node.js, and Python
You can find the full list in our docs.
OpenTelemetry
Additionally, HyperDX is compatible with OpenTelemetry, a vendor-neutral standard for instrumenting your application backed by CNCF. Supported languages/platforms include:
- Kubernetes
- Javascript
- Python
- Java
- Go
- Ruby
- PHP
- .NET
- Elixir
- Rust
(Full list here)
Once HyperDX is running, you can point your OpenTelemetry SDK to the
OpenTelemetry collector spun up at http://localhost:4318.
HyperDX CLI
Prefer the terminal? @hyperdx/cli provides an interactive
TUI and CLI (hdx) for working with your HyperDX data without leaving the
shell:
npm install -g @hyperdx/cli
hdx auth login
hdx tui
- 🖥️ Interactive TUI — search, live tail, and trace waterfalls with vim-style keybindings
- 📊 Render dashboard tiles and ad-hoc charts as ANSI output in the terminal
- 🤖 Agent-friendly: raw SQL queries, NDJSON output, and Drain log pattern mining for scripts and AI agents
See the CLI README for the full command reference.
Contributing
We welcome all contributions! There's many ways to contribute to the project, including but not limited to:
- Opening a PR (Contribution Guide)
- Submitting feature requests or bugs
- Improving our product or contribution documentation
- Voting on open issues or contributing use cases to a feature request
Pull requests. Issues, bug reports and discussion stay open to everyone. For code we now use Vouch: a maintainer has to vouch for you before your first pull request gets reviewed. AI tools make it cheap to open a plausible-looking PR with no understanding behind it, and reviewing those crowds out the contributions we want to spend time on. Getting vouched takes one issue — say hello and tell us what you want to work on. See Getting vouched.
Motivation
Our mission is to help engineers ship reliable software. To enable that, we believe every engineer needs to be able to easily leverage production telemetry to quickly solve burning production issues.
However, in our experience, the existing tools we've used tend to fall short in a few ways:
- They're expensive, and the pricing has failed to scale with TBs of telemetry becoming the norm, leading to teams aggressively cutting the amount of data they can collect.
- They're hard to use, requiring full-time SREs to set up, and domain experts to use confidently.
- They requiring hopping from tool to tool (logs, session replay, APM, exceptions, etc.) to stitch together the clues yourself.
We hope you give HyperDX in ClickStack a try and let us know how we're doing!
Contact
HyperDX Usage Data
HyperDX collects anonymized usage data for open source deployments. This data
supports our mission for observability to be available to any team and helps
support our open source product run in a variety of different environments.
While we hope you will continue to support our mission in this way, you may opt
out of usage data collection by setting the USAGE_STATS_ENABLED environment
variable to false. Thank you for supporting the development of HyperDX!