WGCLOUD is an open-source, Java-based distributed monitoring system for Linux and mixed-OS server fleets, aimed at operations teams that want host, service, container, network and middleware monitoring from one server-plus-agent deployment instead of assembling several tools.
What it is
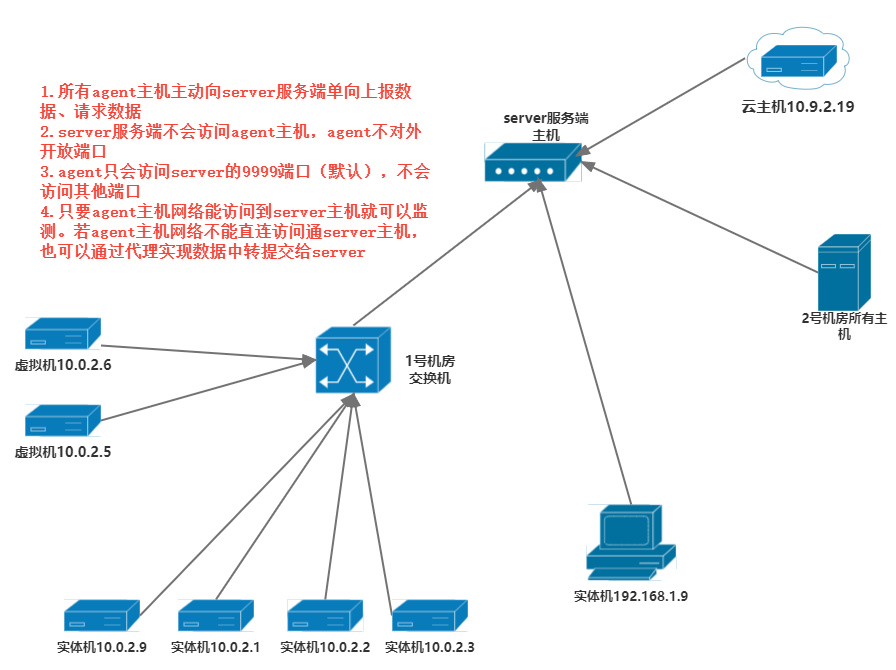
WGCLOUD is a distributed operations monitoring platform built on a SpringBoot microservice architecture with a Bootstrap web front end. It works as two cooperating parts: a server that receives data, processes it and renders charts, and an agent that runs on each monitored host and reports metrics on a default interval of two minutes, which can be adjusted. The current open-source release in this repository is v2.3.7, licensed under Apache-2.0, and development happens on the master branch.
The concrete problem it solves is tool and script sprawl in day-to-day server operations. Instead of writing collection templates and scripts and then wiring separate systems together for host metrics, service checks, container checks, network devices and alerting, WGCLOUD presents these as built-in features of one platform and ships as an out-of-the-box deployment. It lives in the same infrastructure-monitoring space as the Nagios, Prometheus and Grafana topics attached to this repository, and it also carries its own separate, closed-source commercial edition distributed from the vendor's website.
Key capabilities
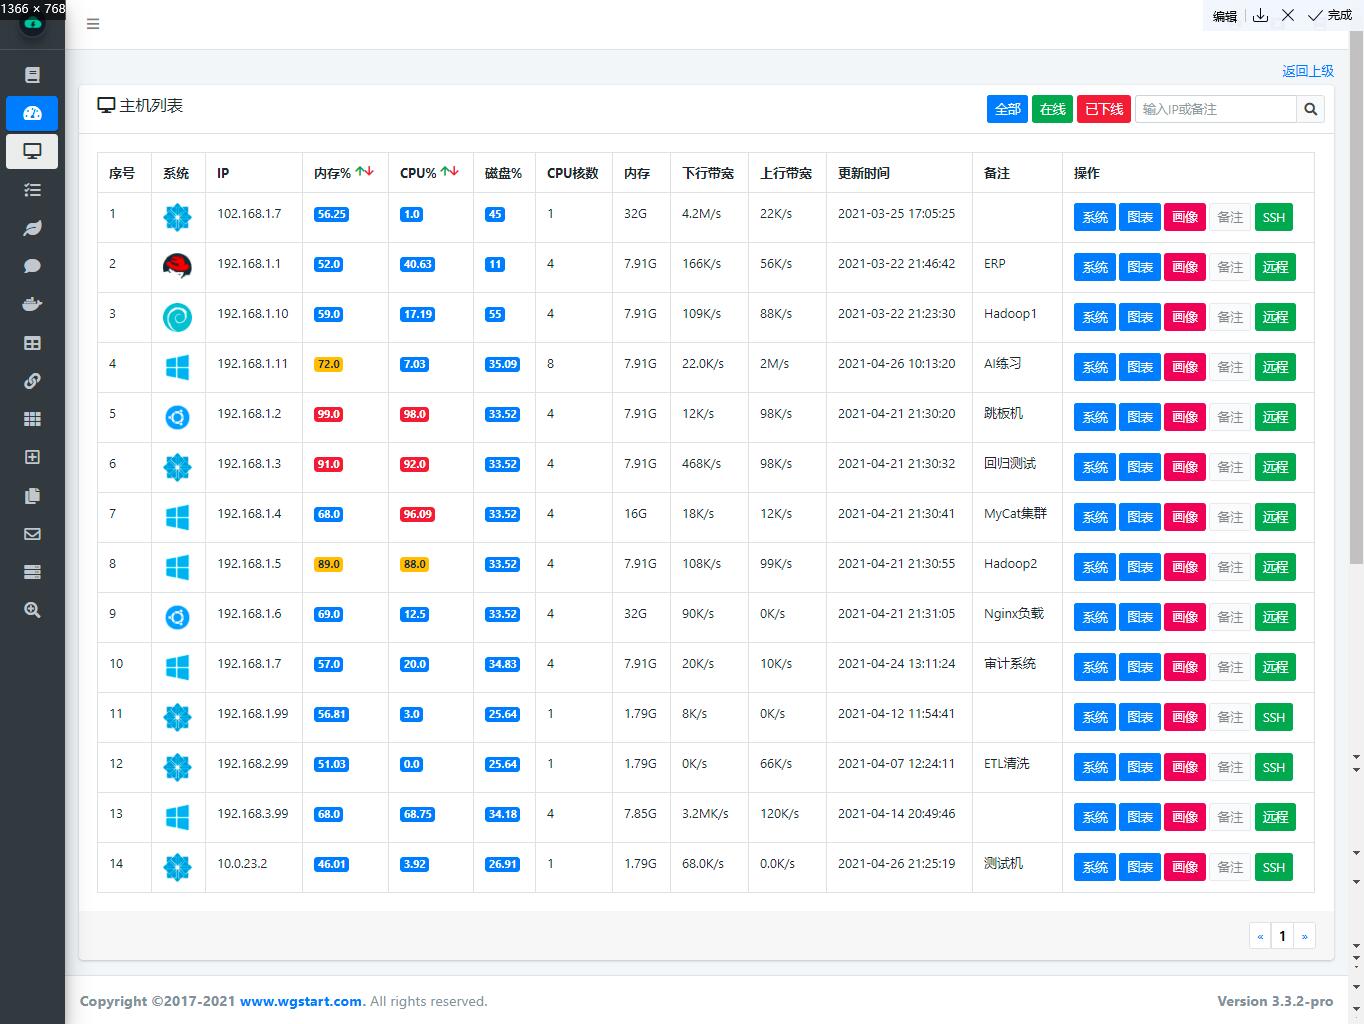
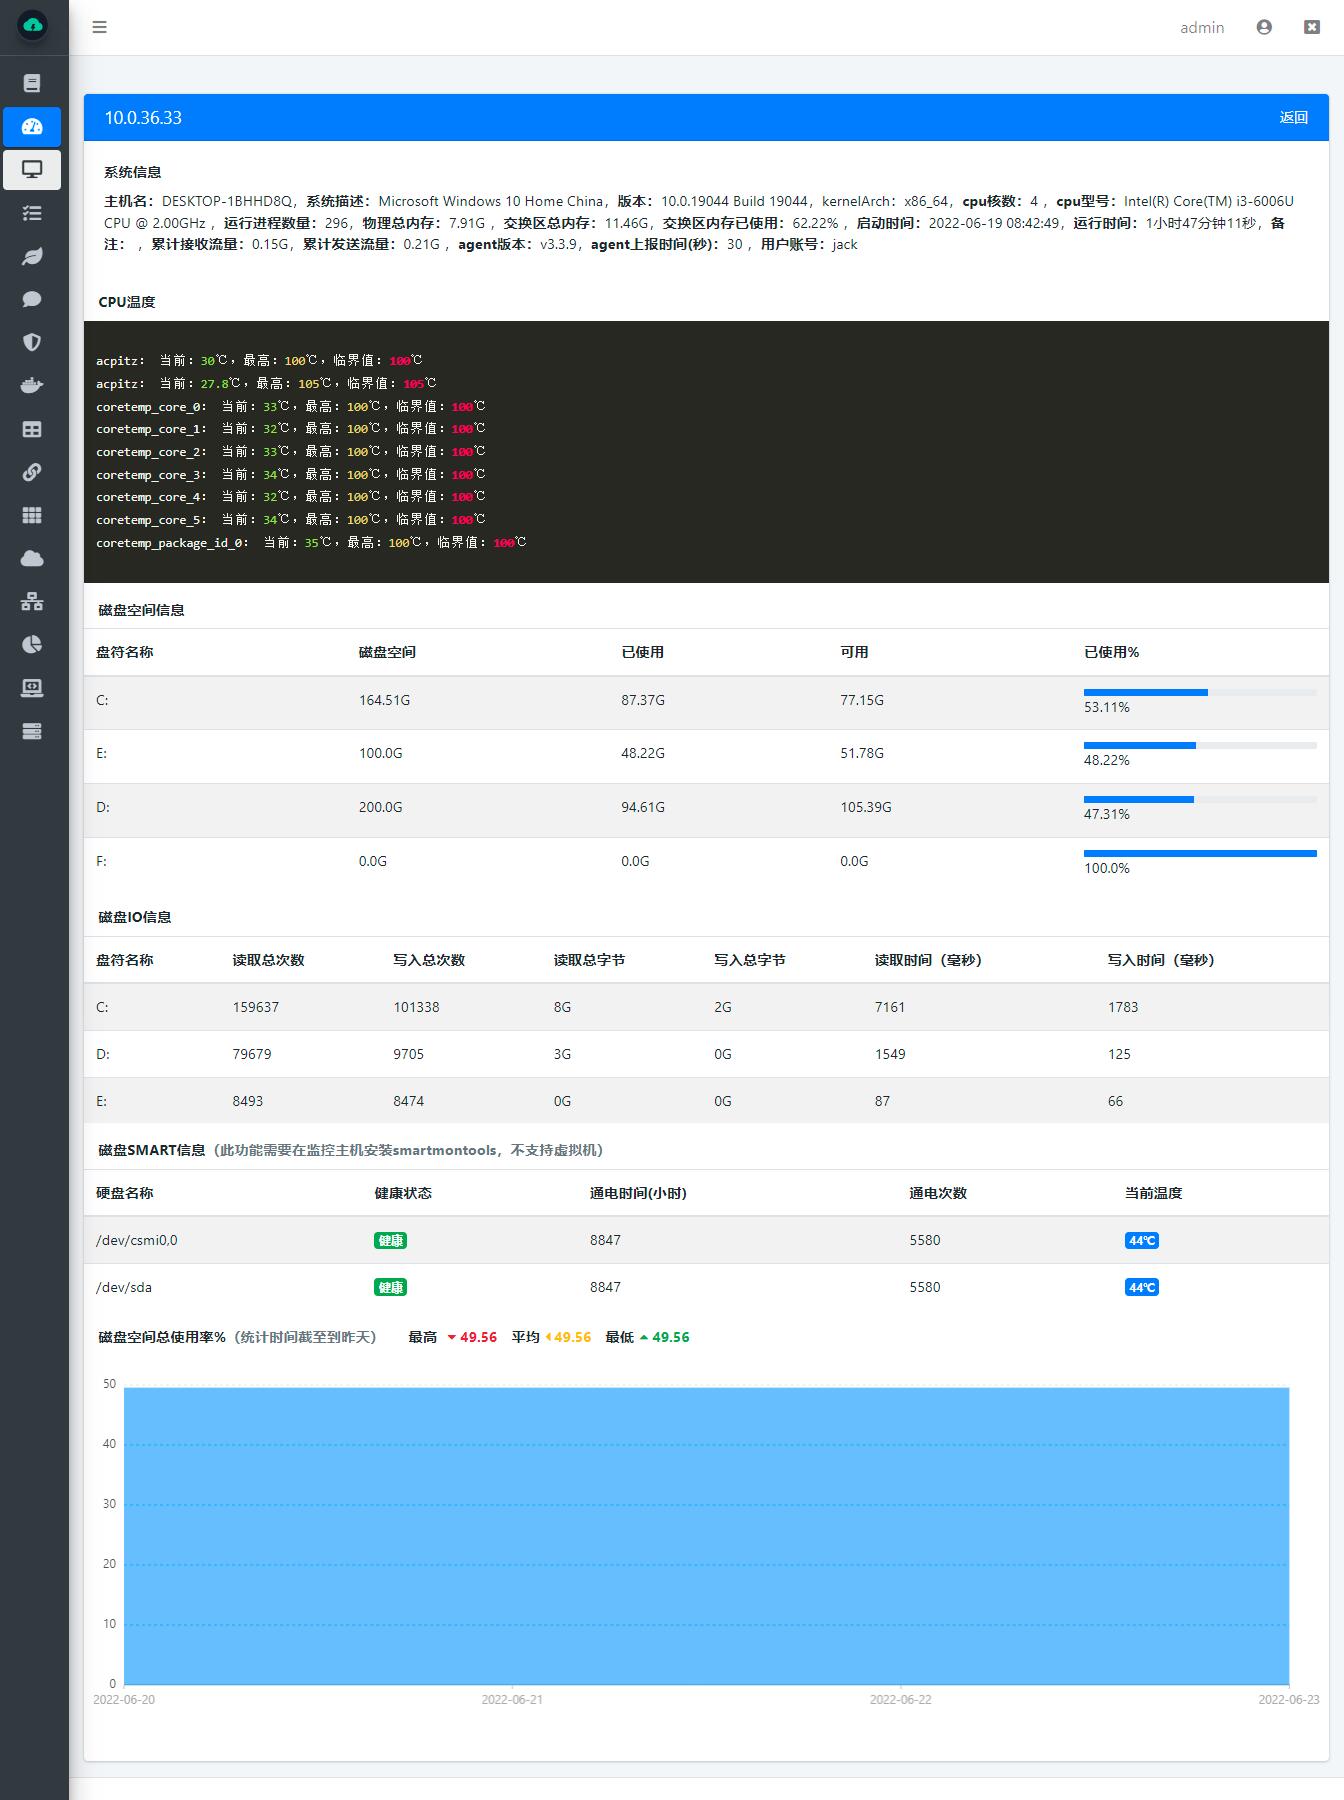
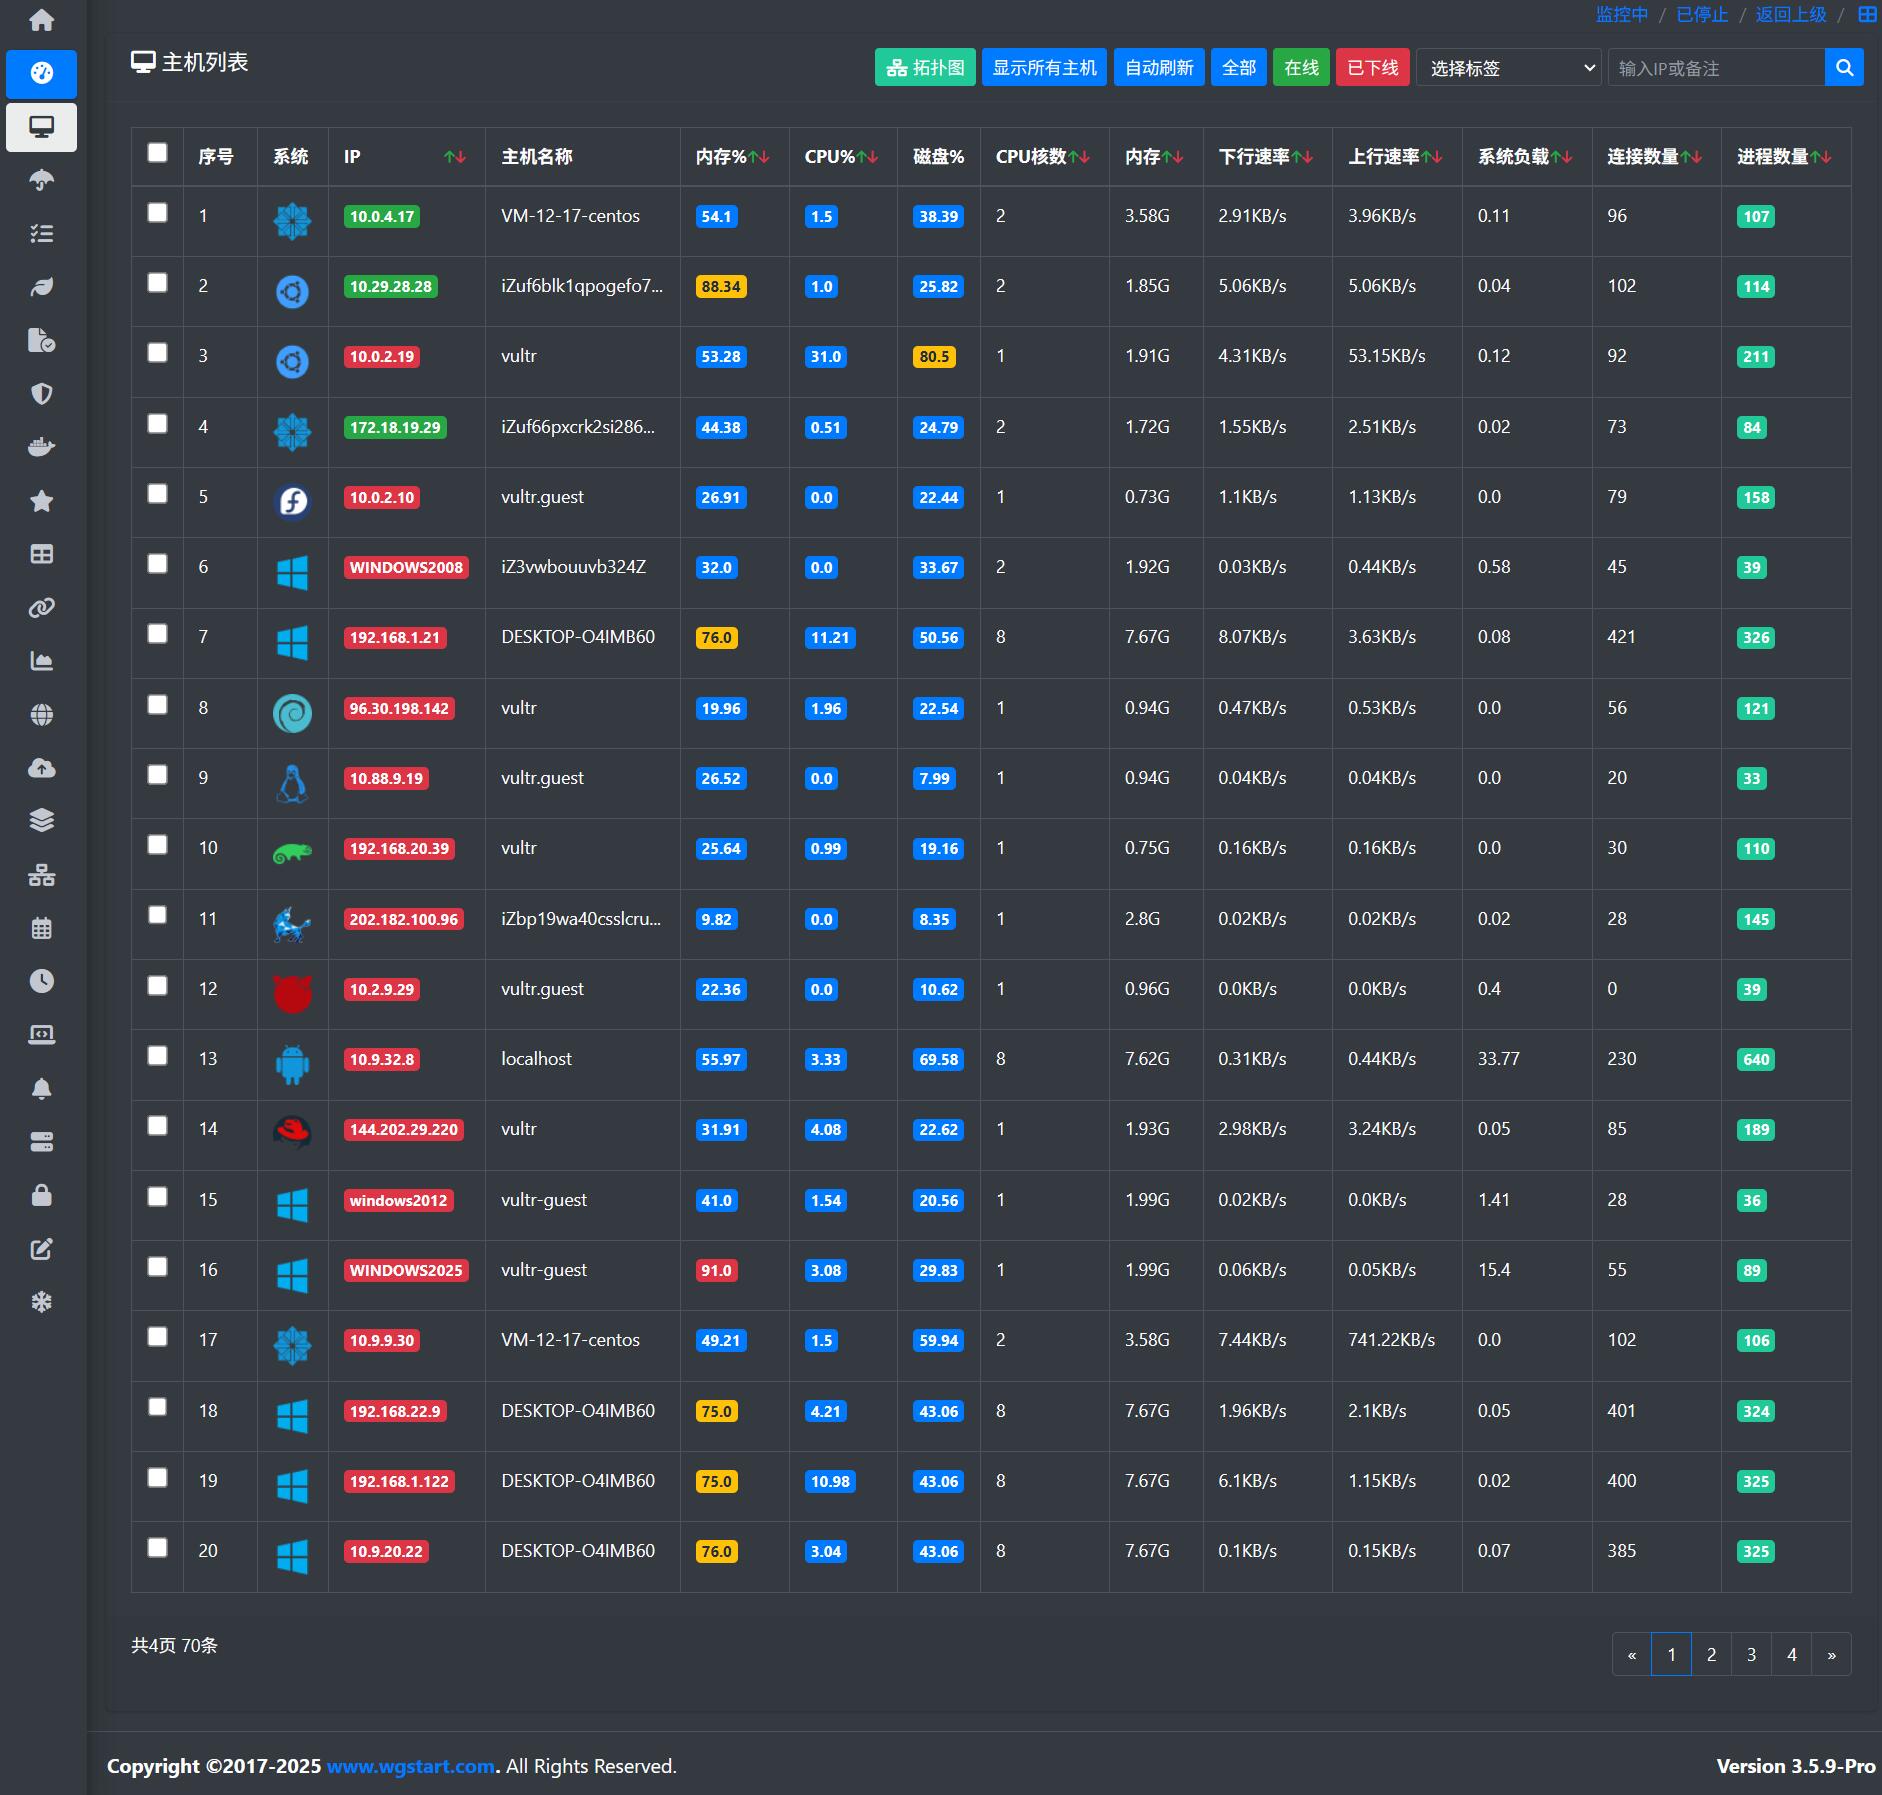
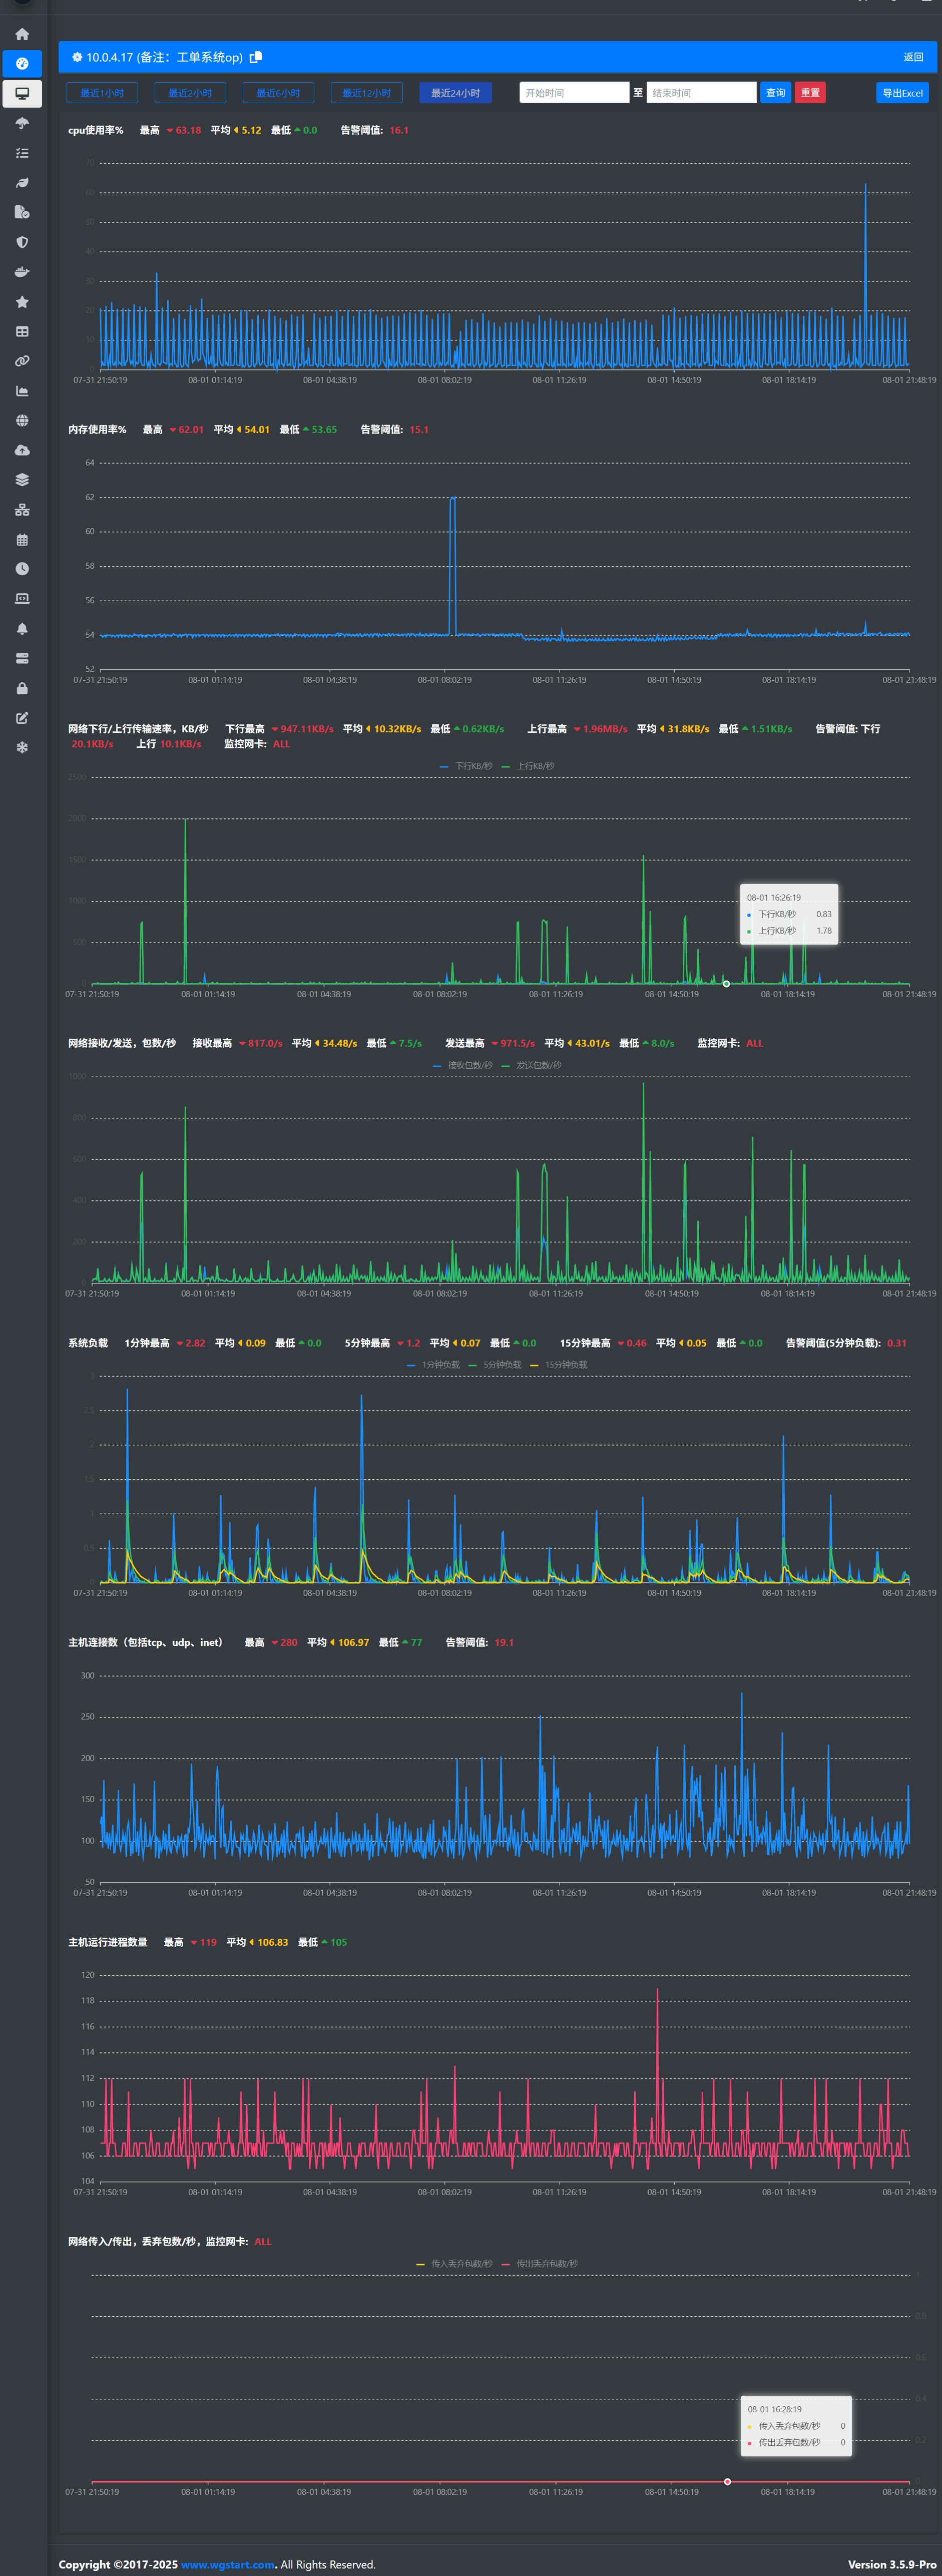
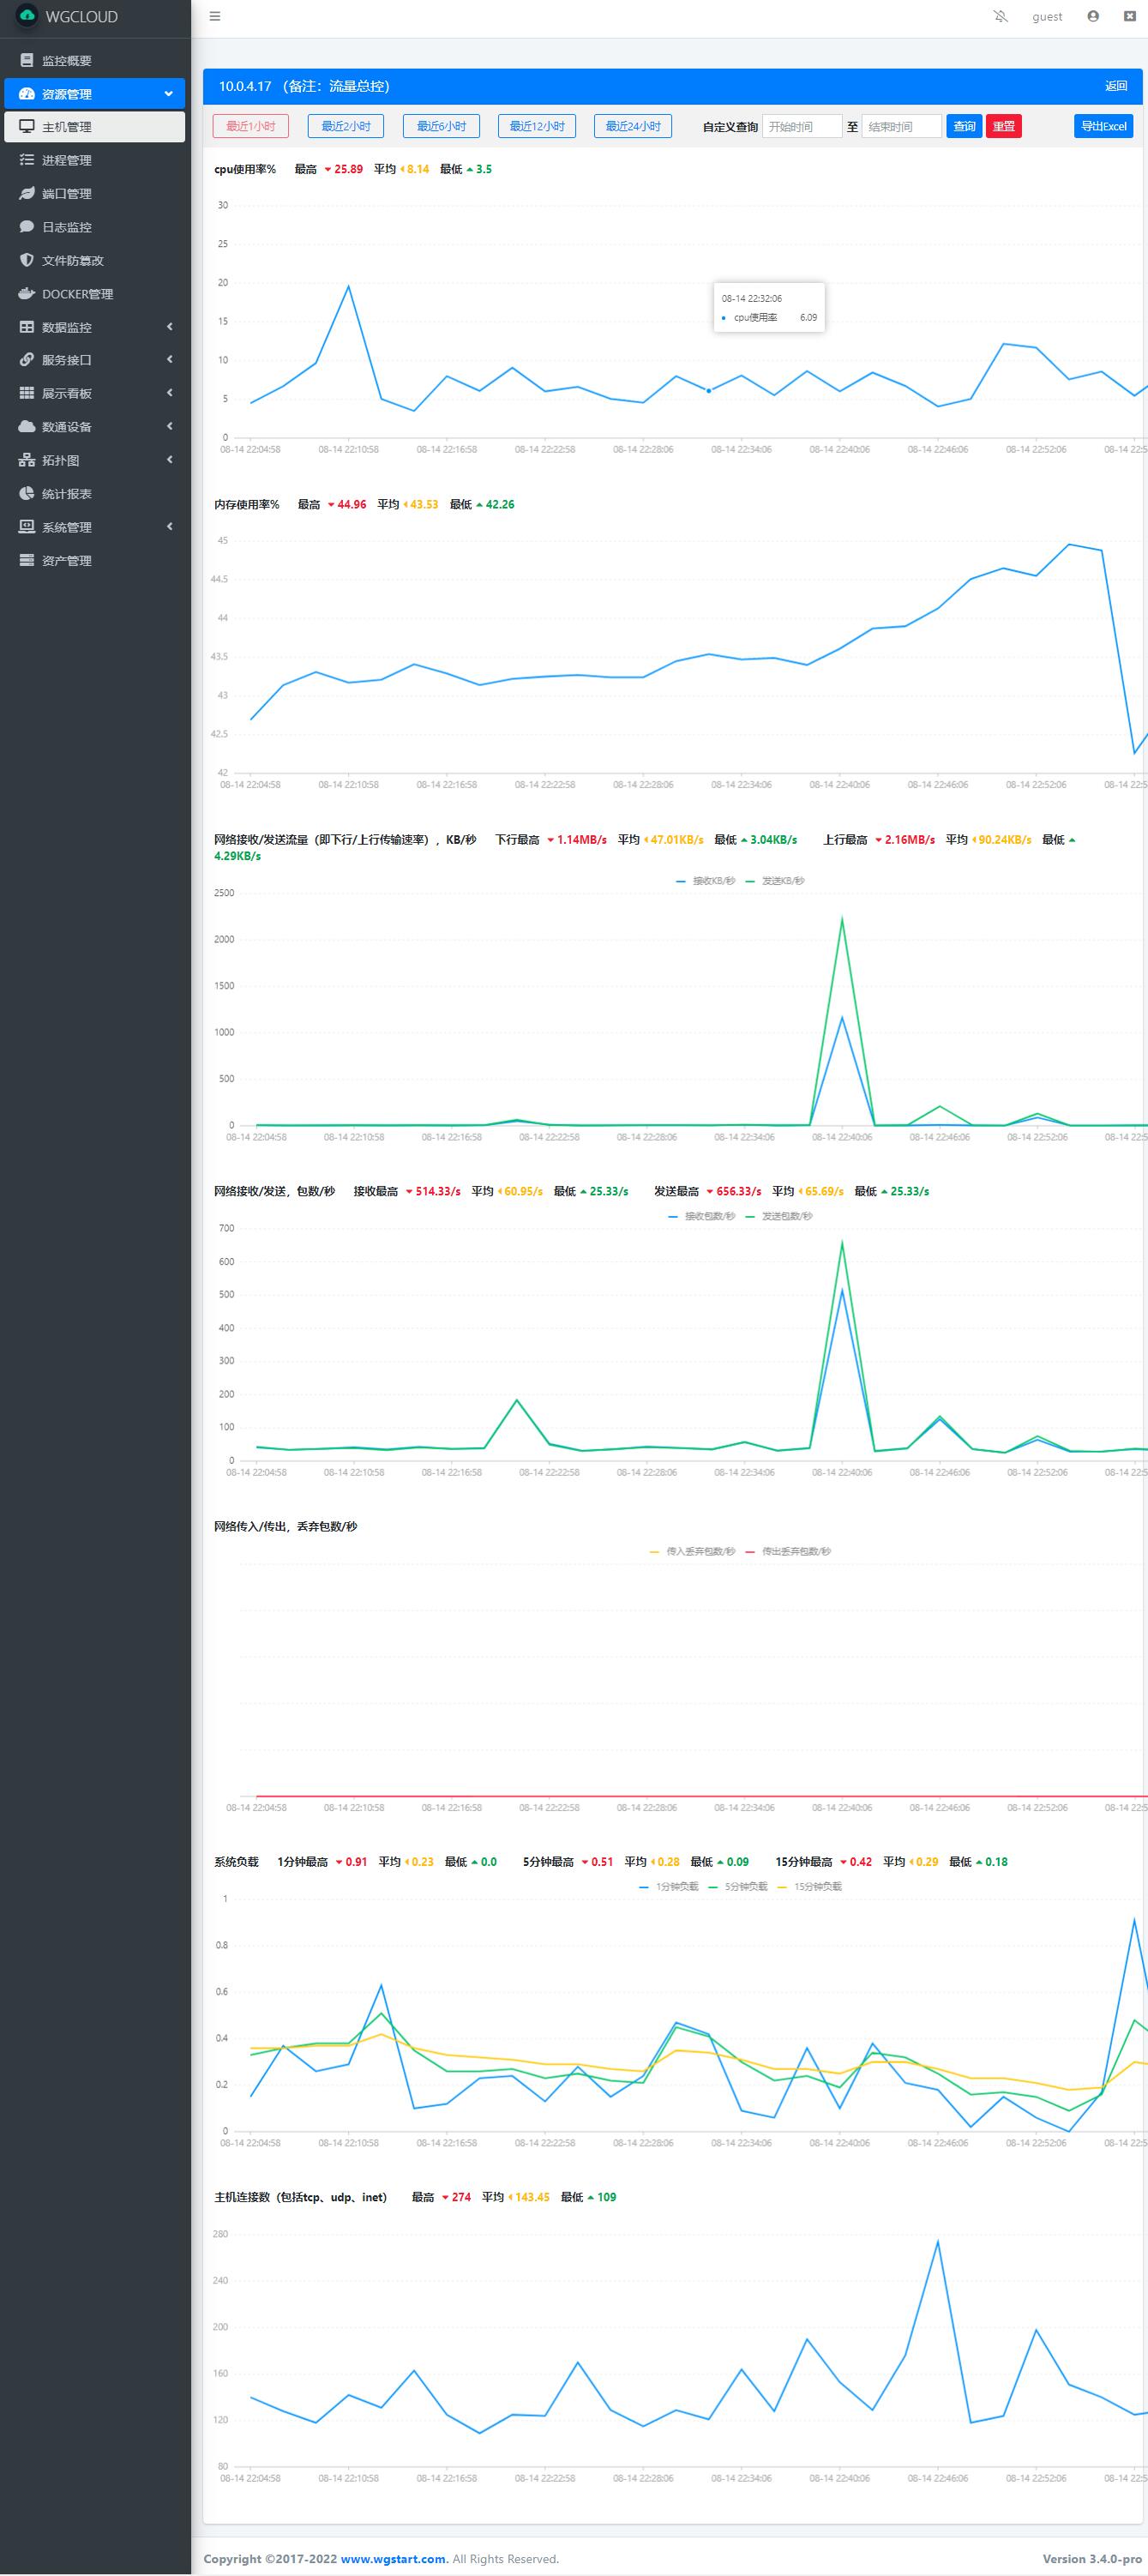
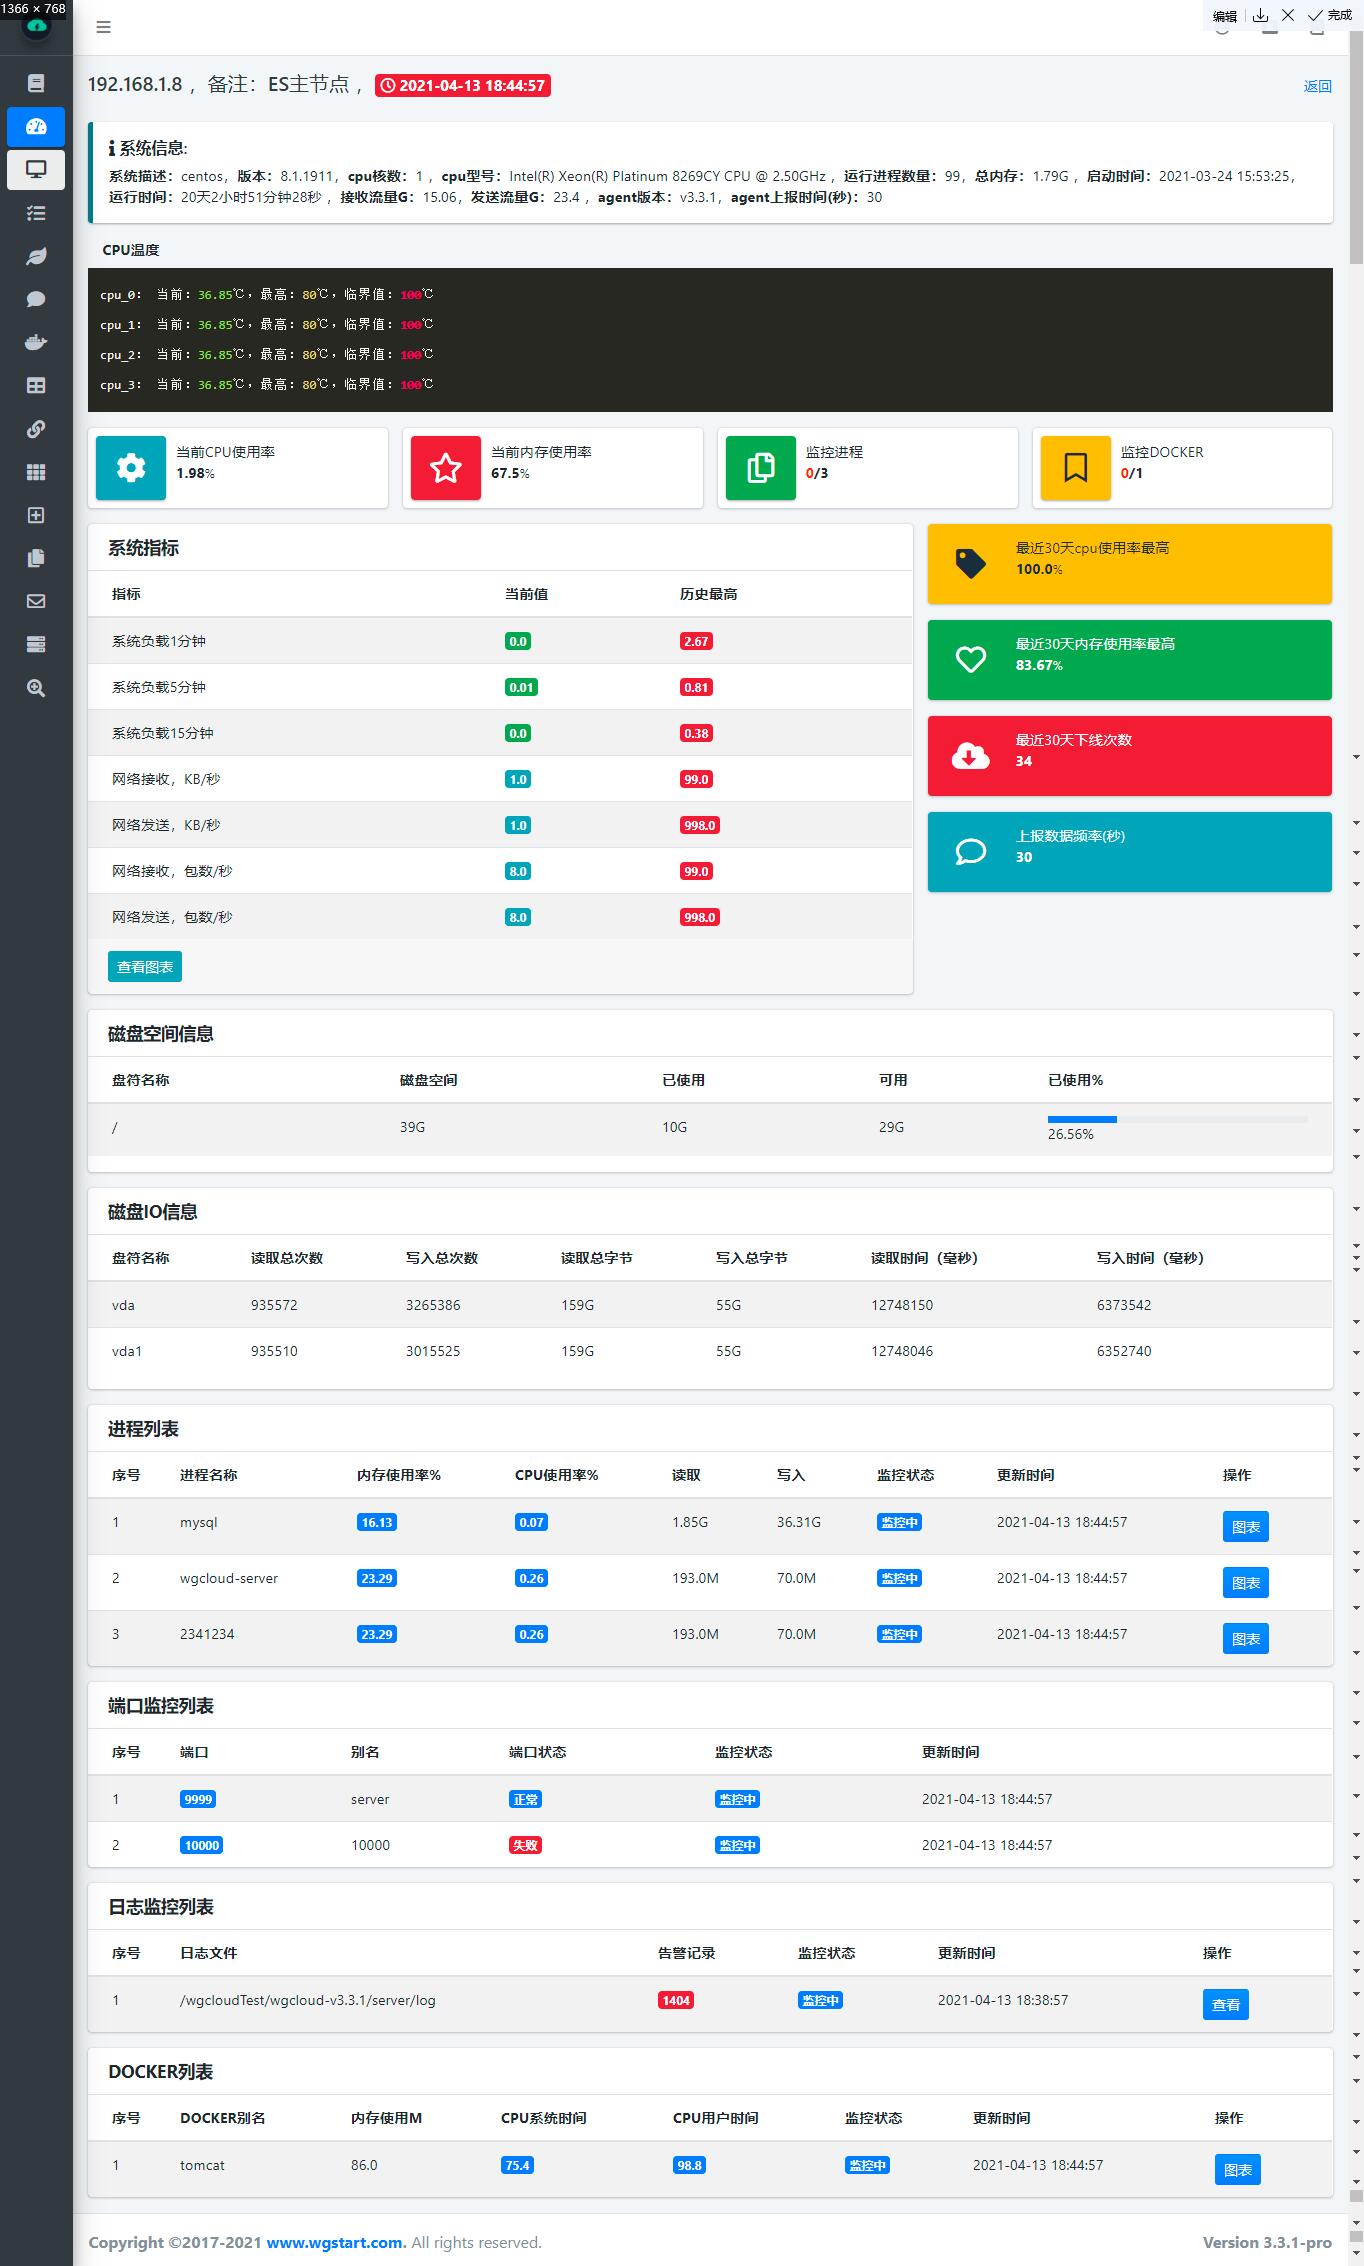
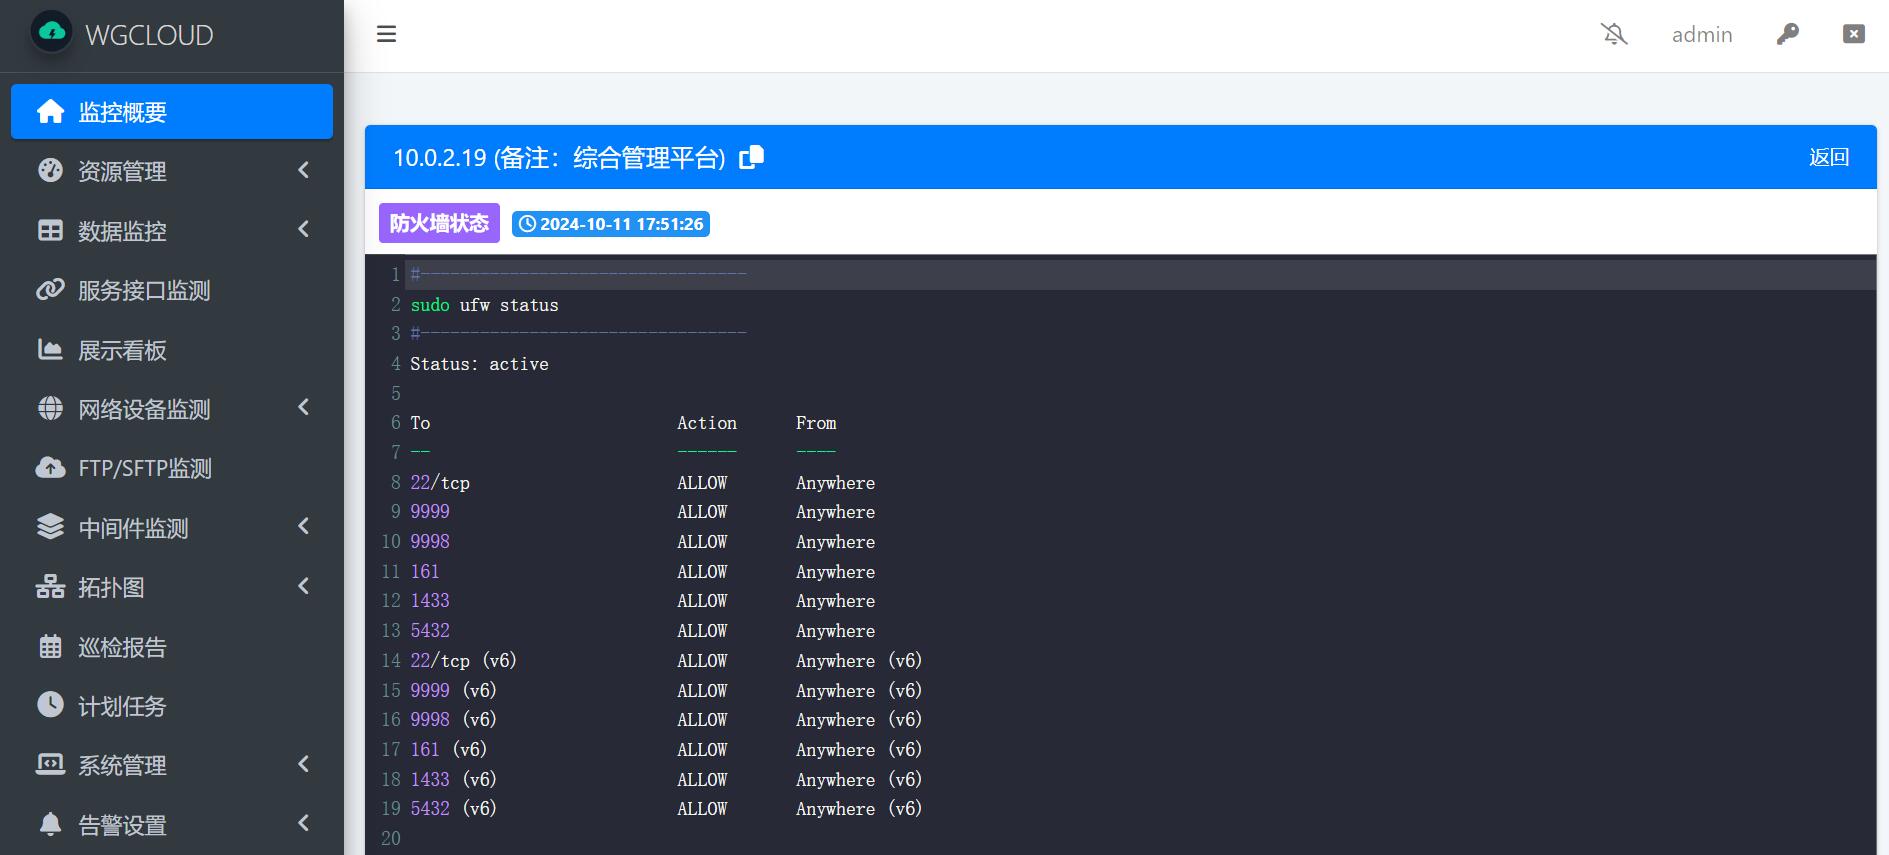
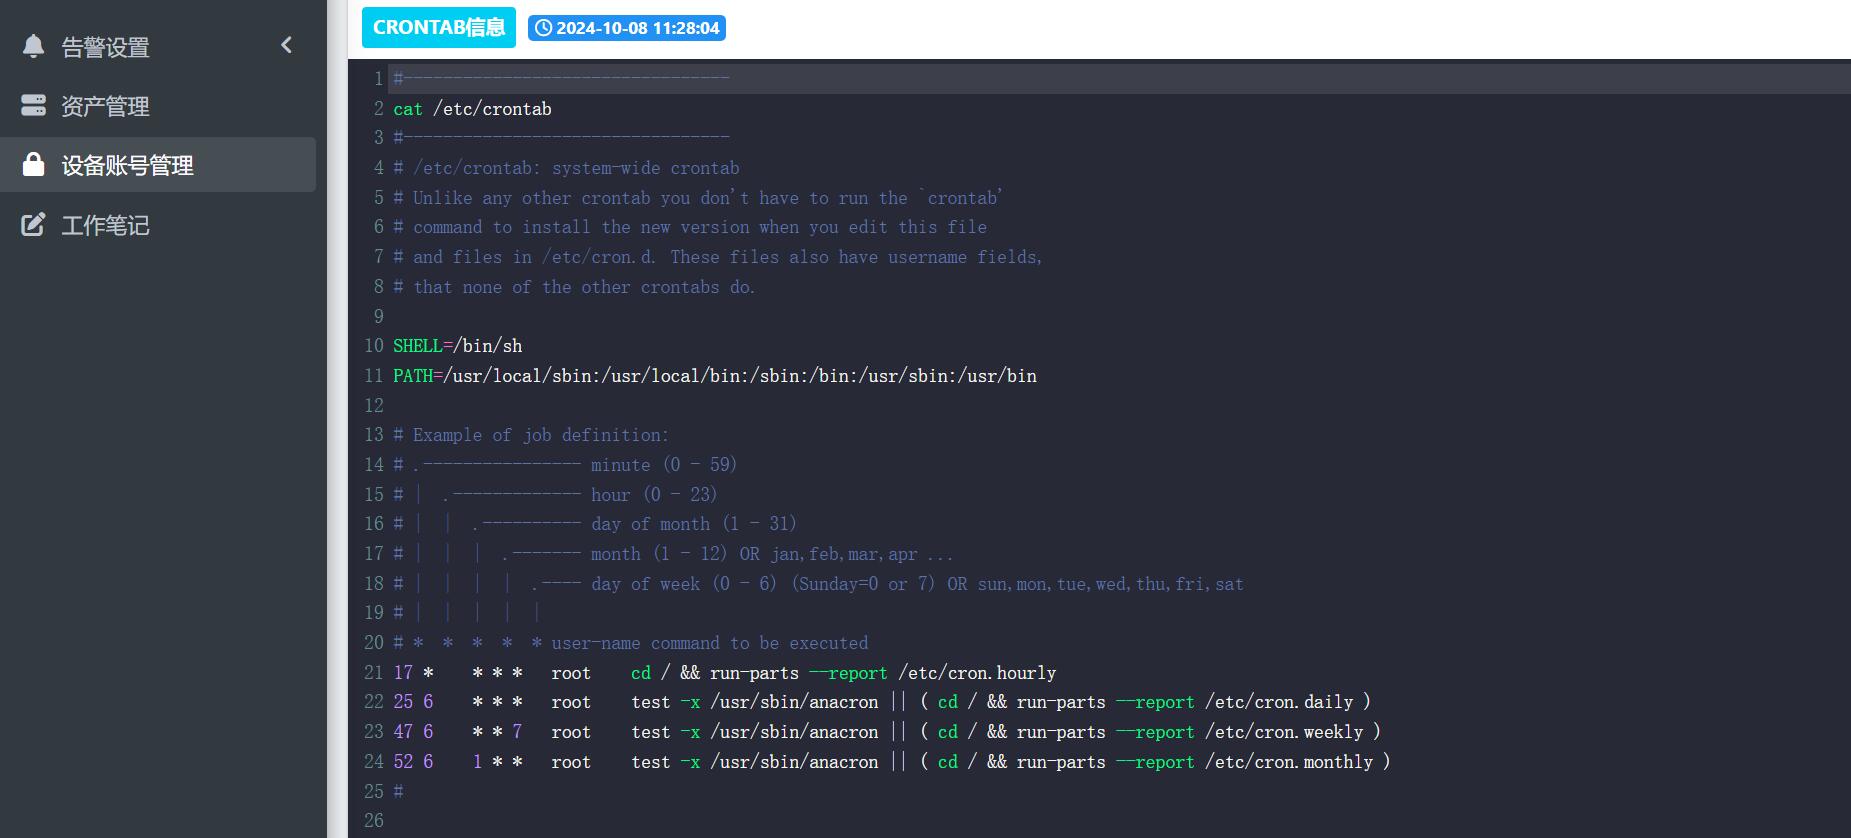
- Host metric collection uses the OSHI library, which replaced the earlier sigar approach in v2.3.7, and covers CPU usage and CPU temperature, memory usage, disk capacity, disk IO read/write rates, disk IOPS, hard disk SMART health, system load, MAC address, connection counts, NIC traffic, hardware, BIOS, mainboard and PCI information, GPU data, firewall status, crontab, recent user logins, Windows service lists, running processes and listening ports, plus IPMI.
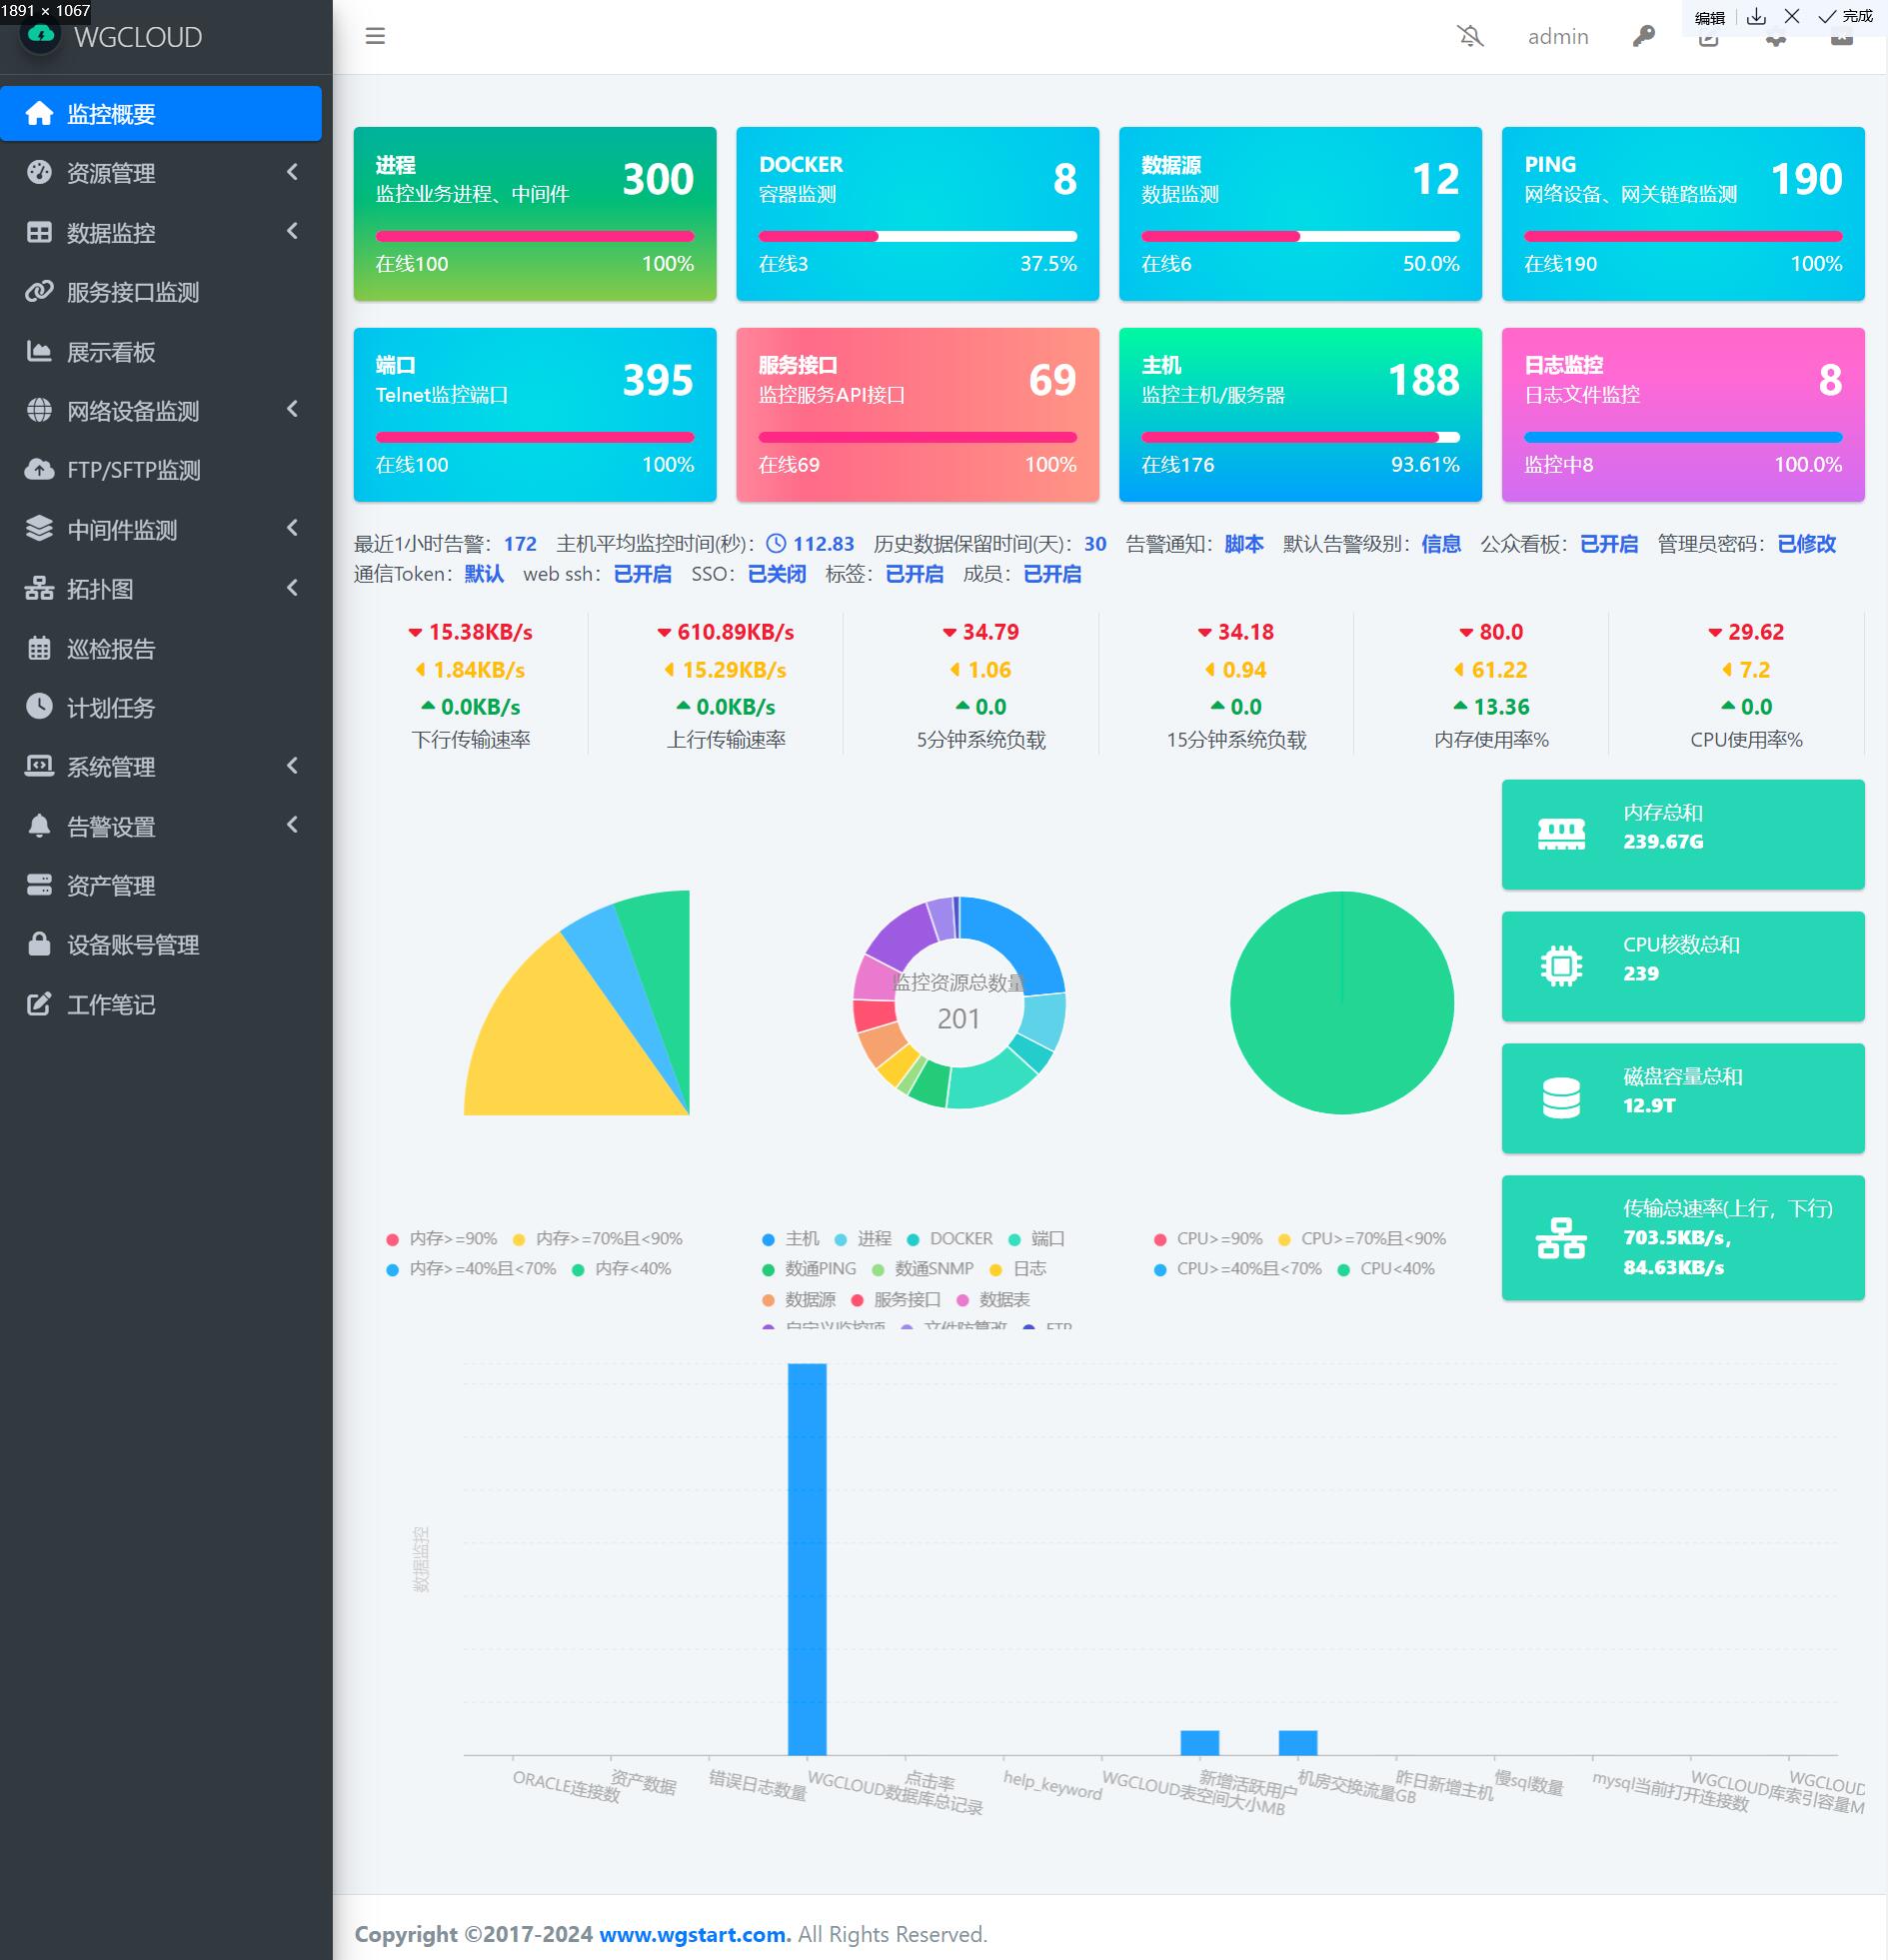
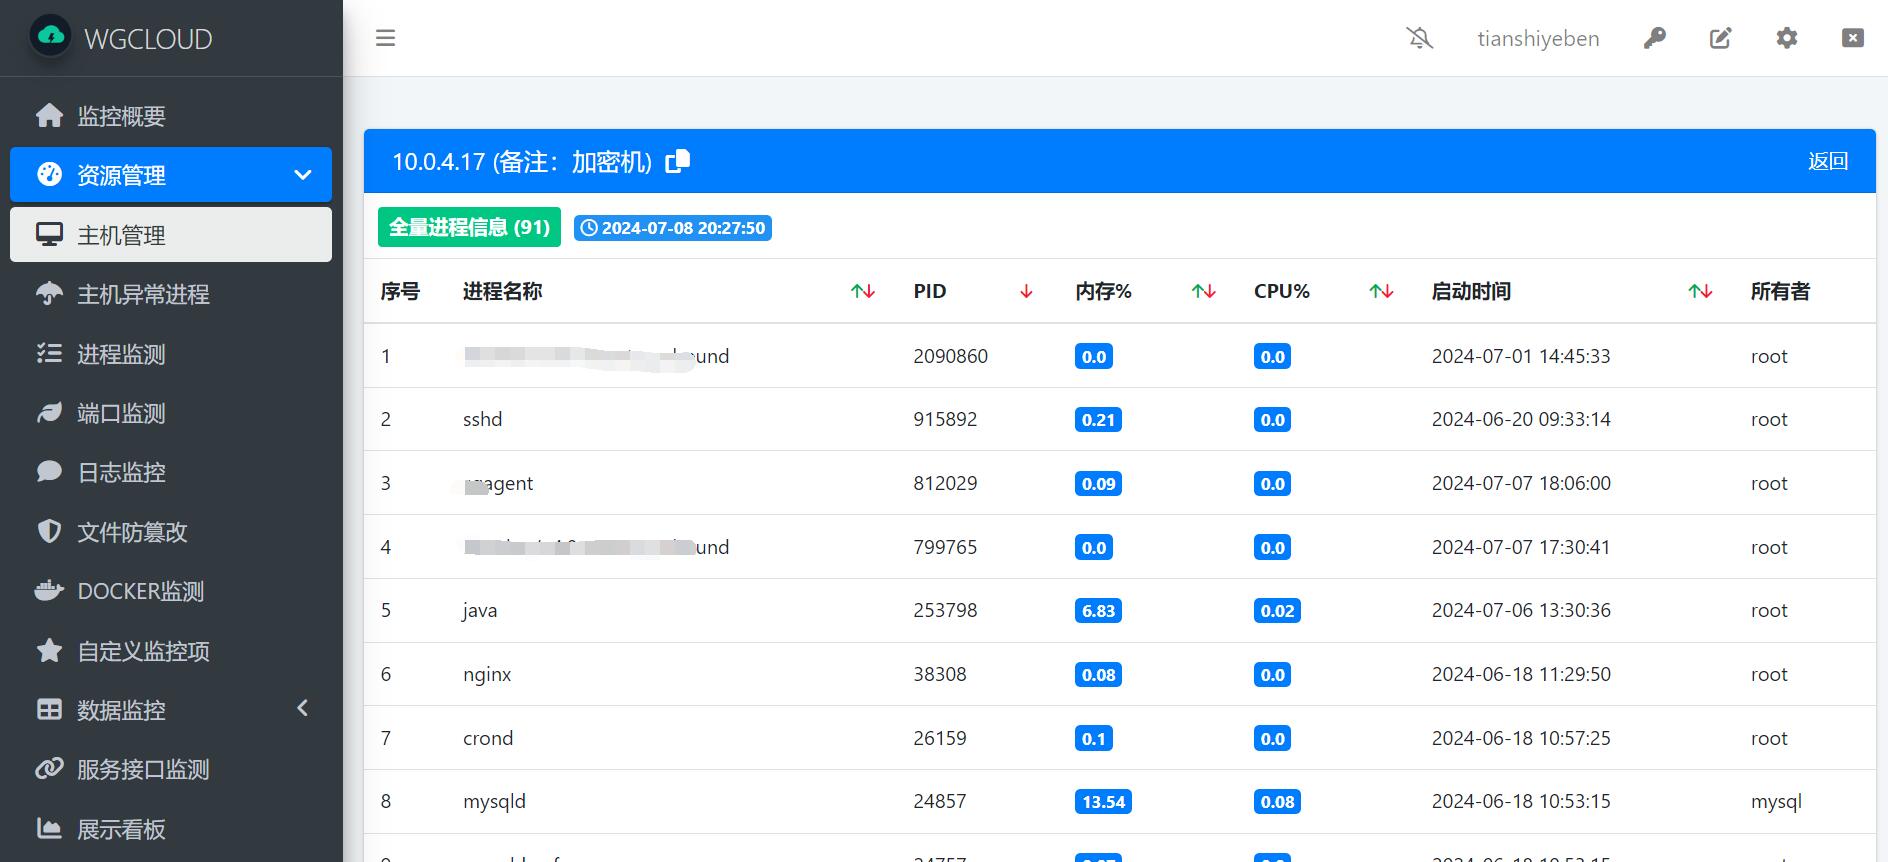
- Resource monitoring extends past the host to processes, file anti-tampering, ports, logs, Docker containers, databases and individual data tables.
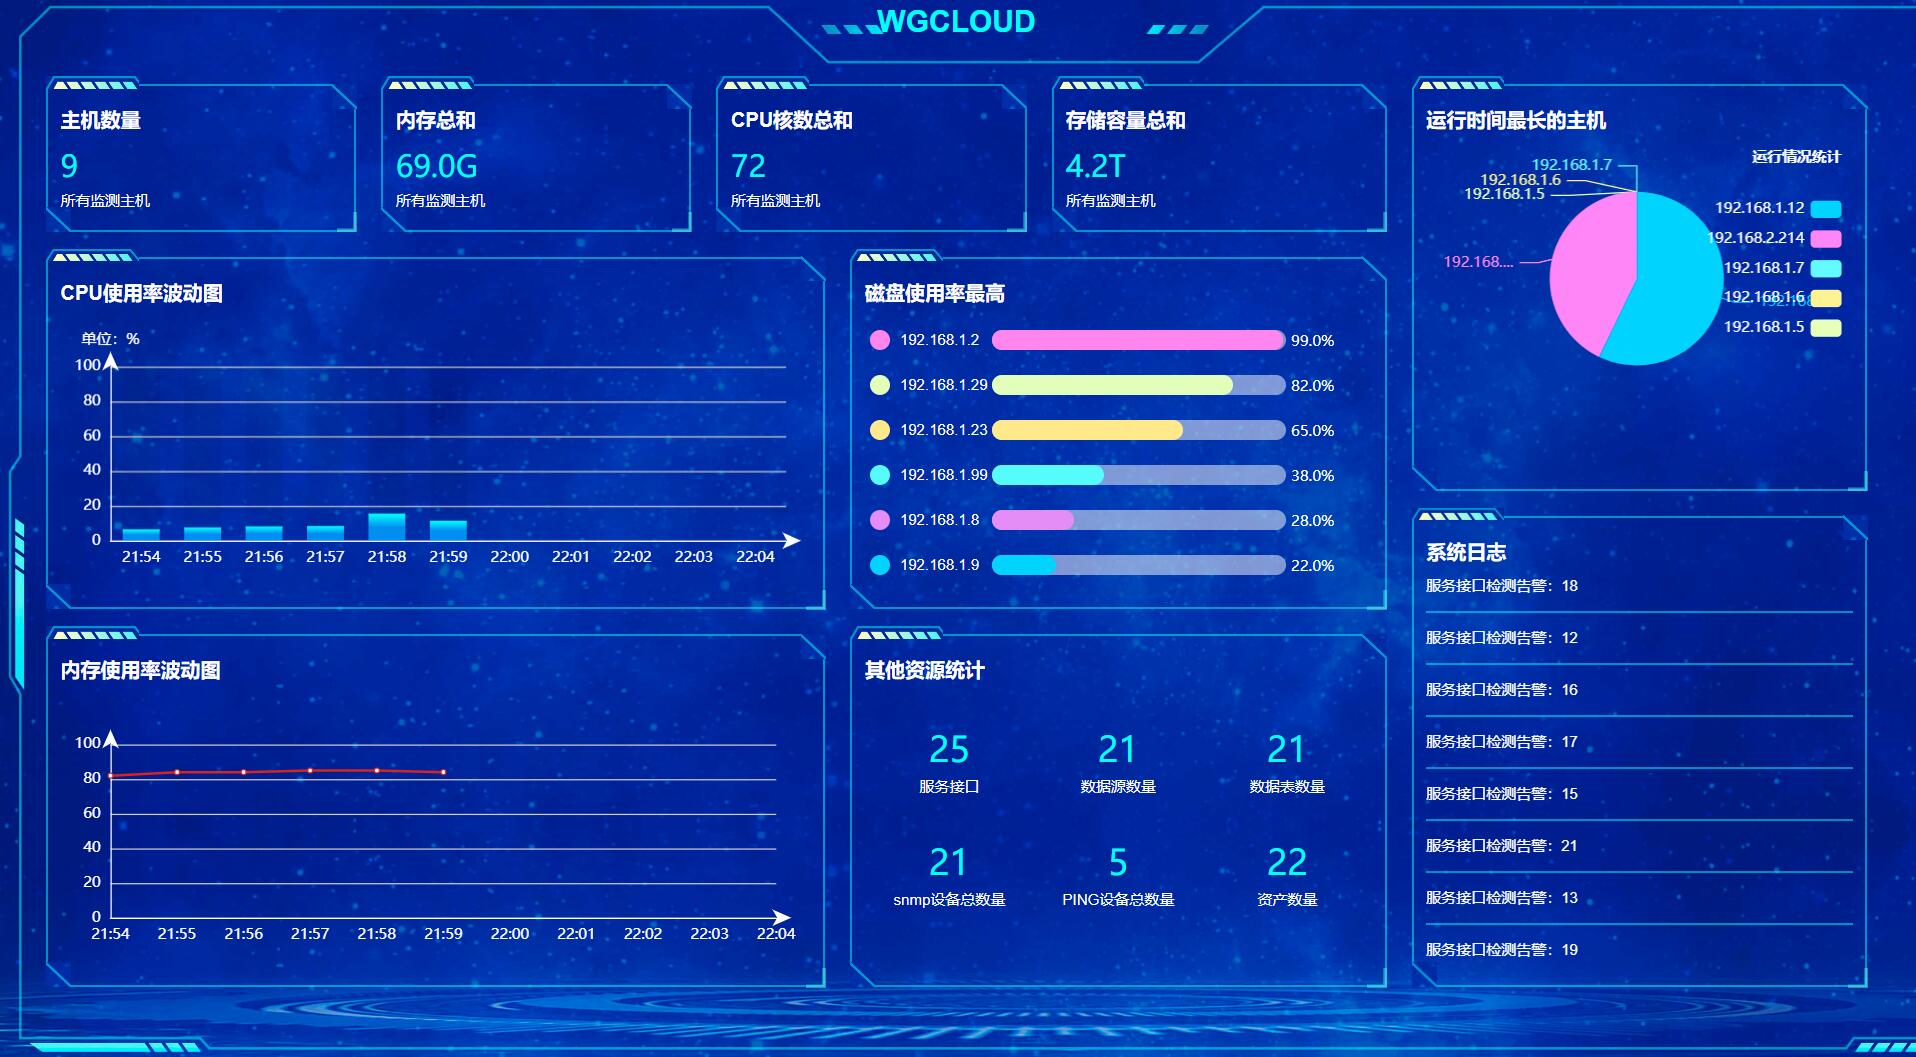
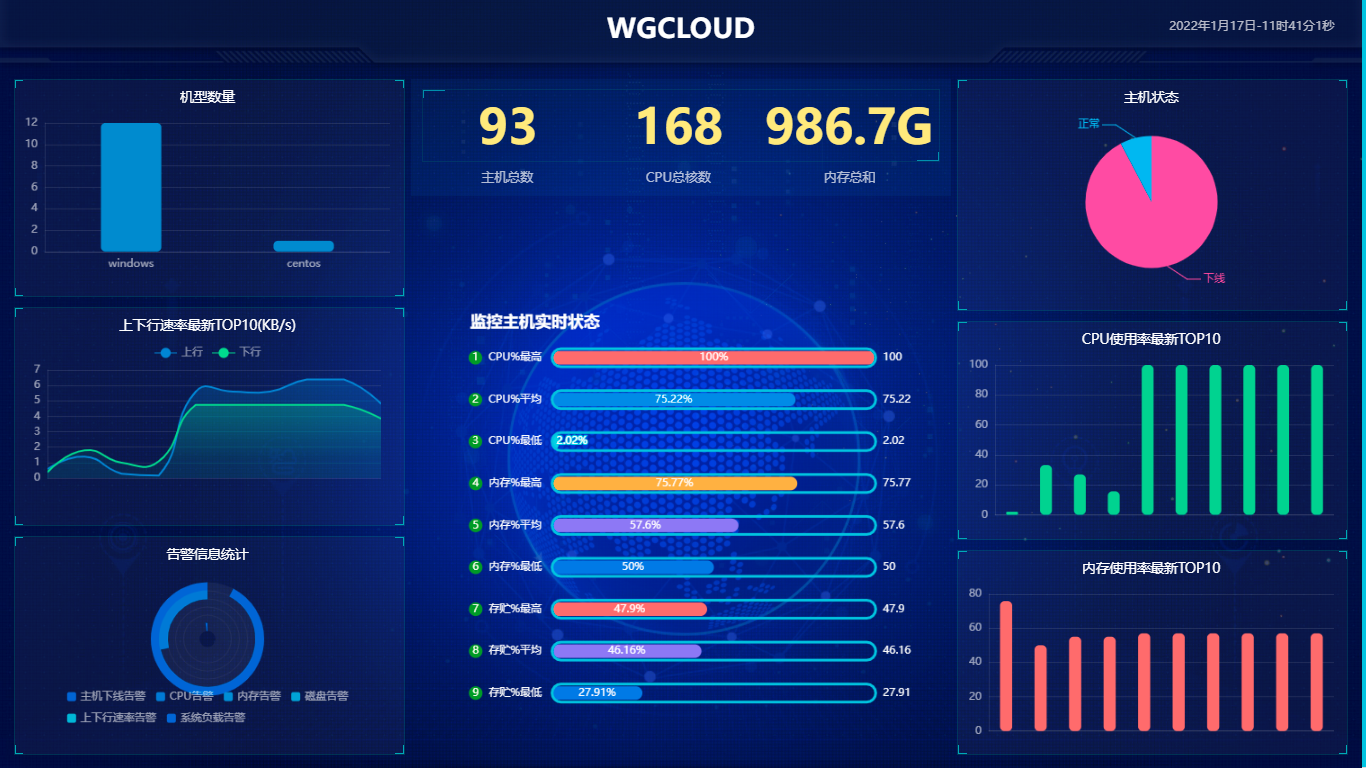
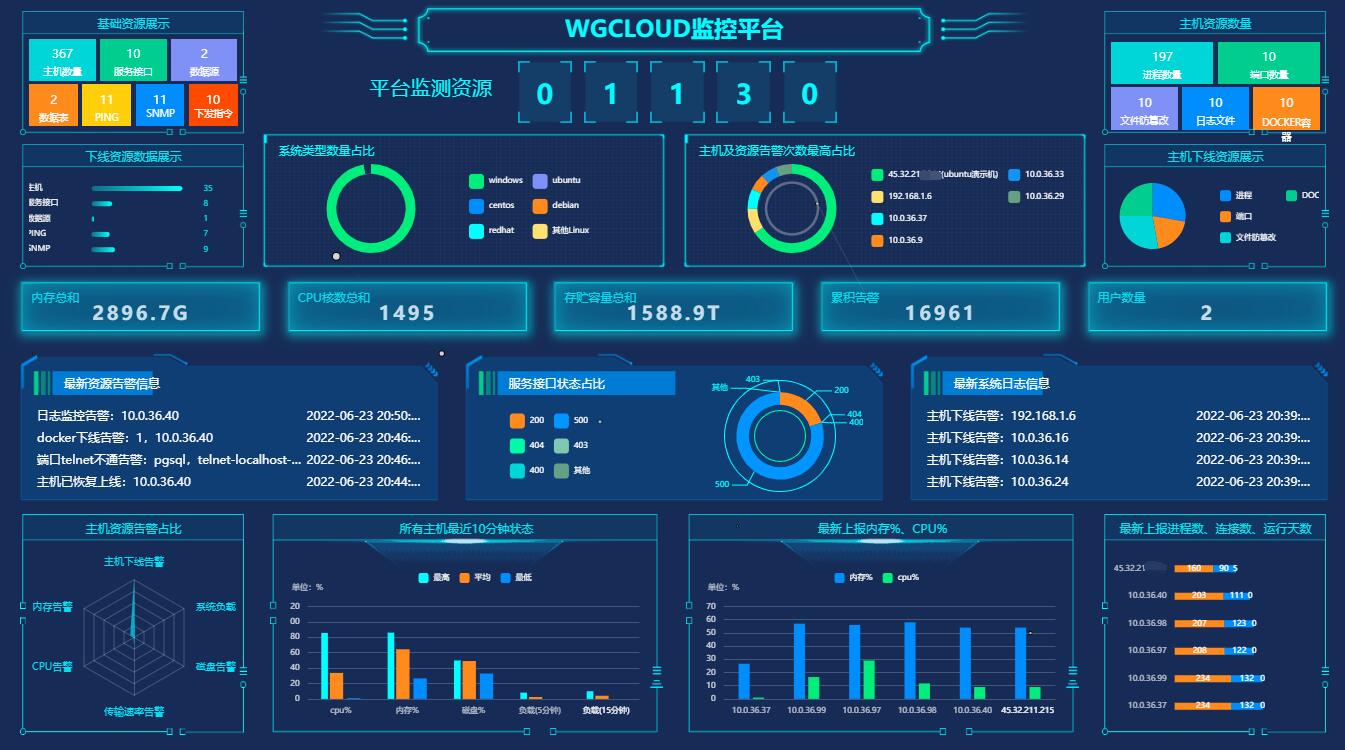
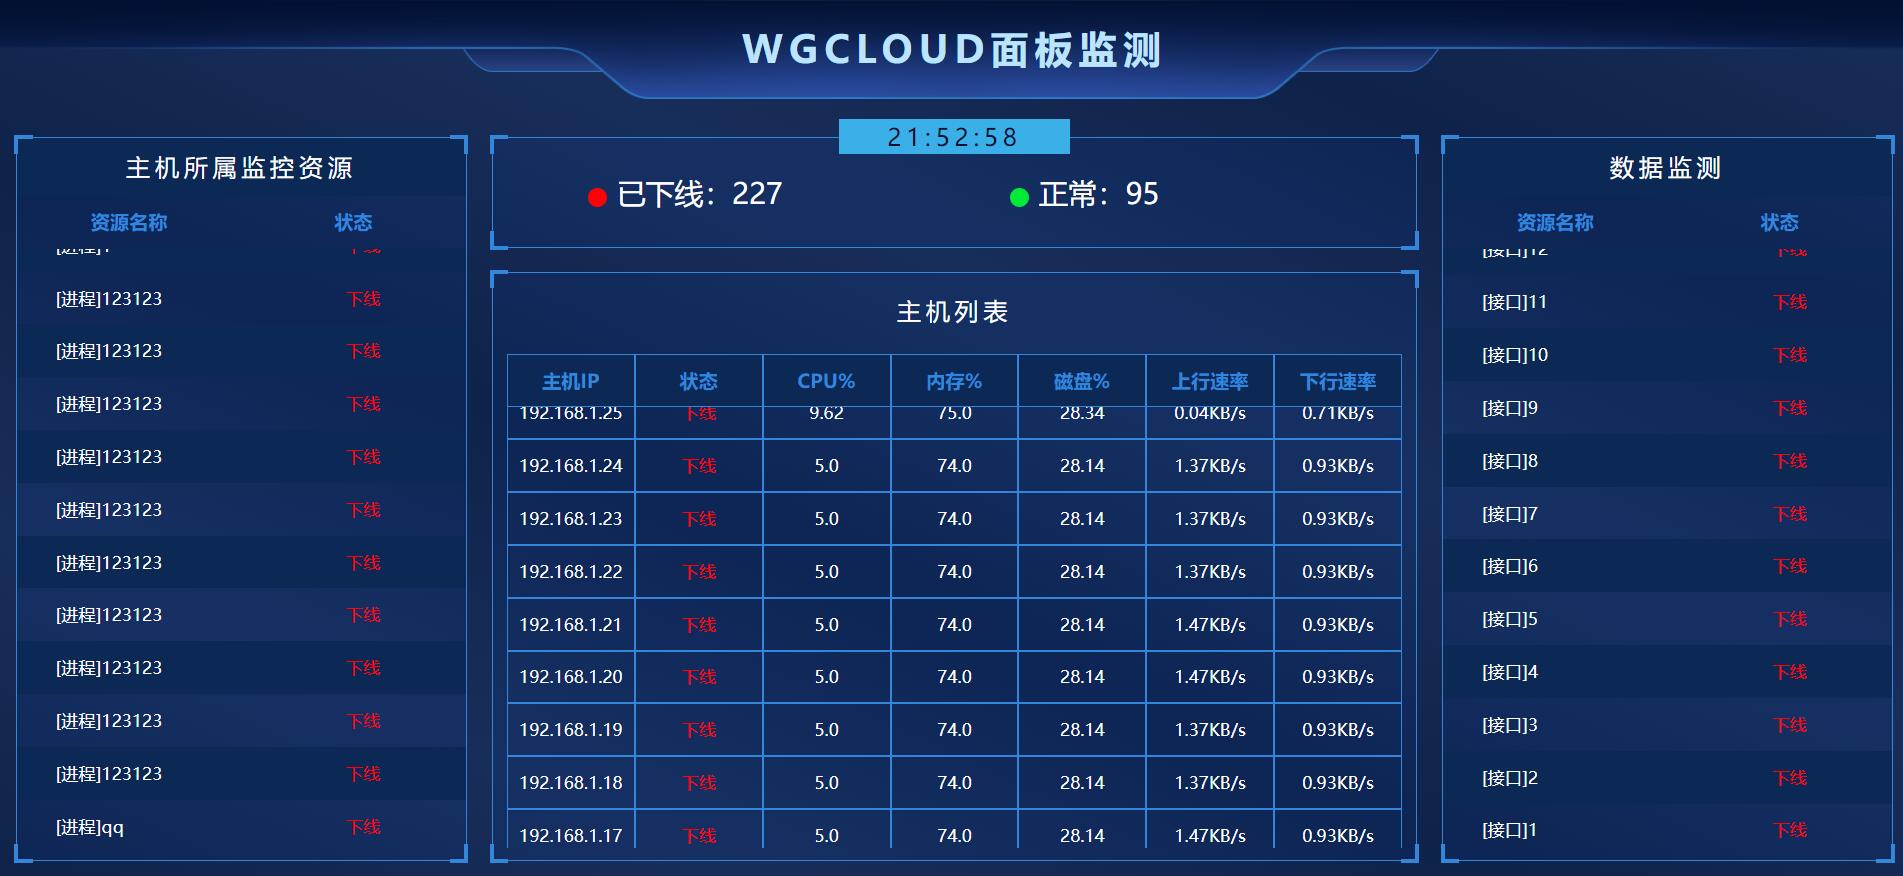
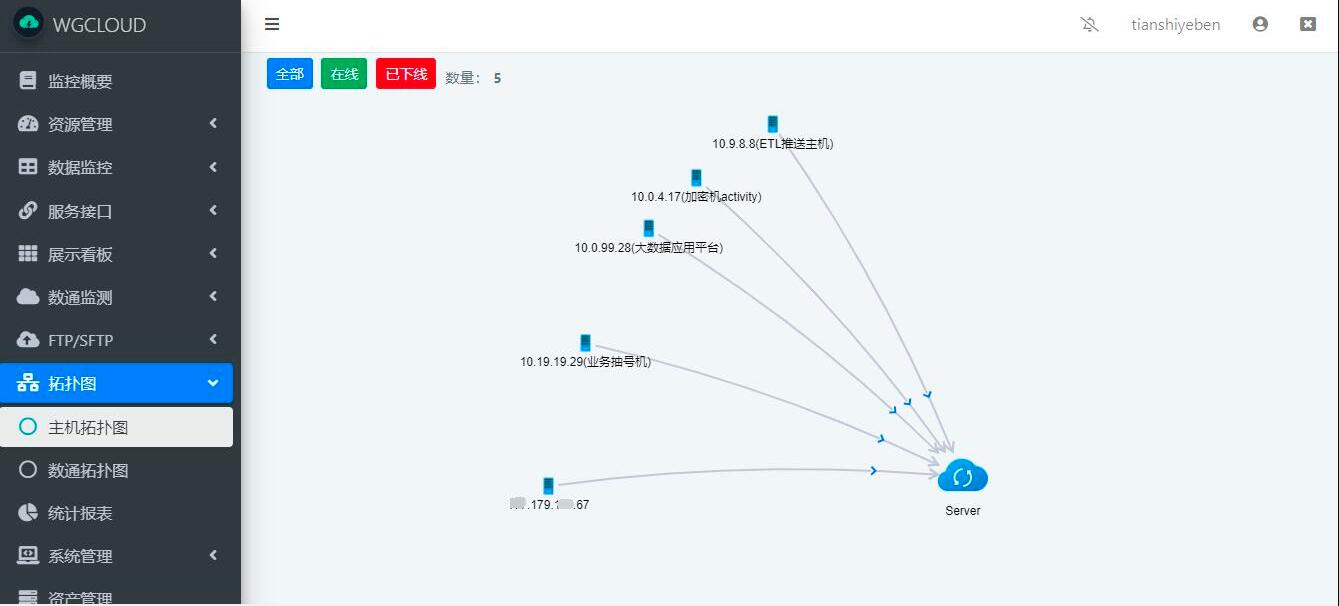
- Service monitoring covers application APIs and network devices such as switches, routers and printers, with automatic device discovery, automatically generated network topology maps and big-screen dashboards.
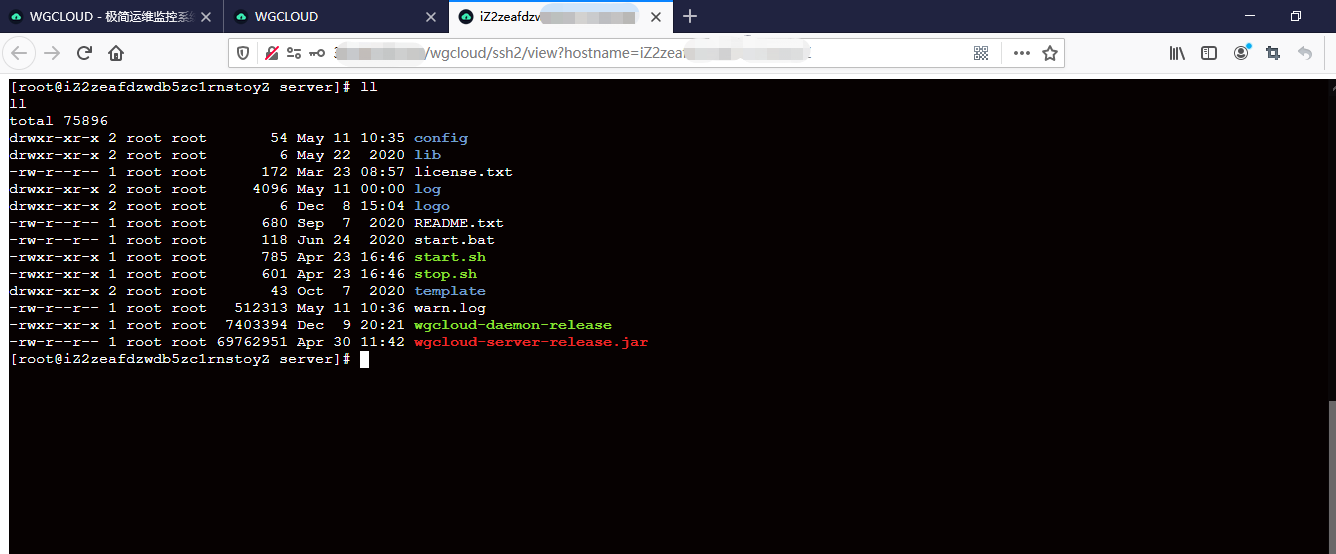
- Operational tooling includes web SSH acting as a bastion host, batch command dispatch, inspection reports, scheduled tasks, asset management, password management and work notes.
- Alerting pushes notifications through email, DingTalk, WeChat and SMS, and the platform provides AI-assisted analysis.
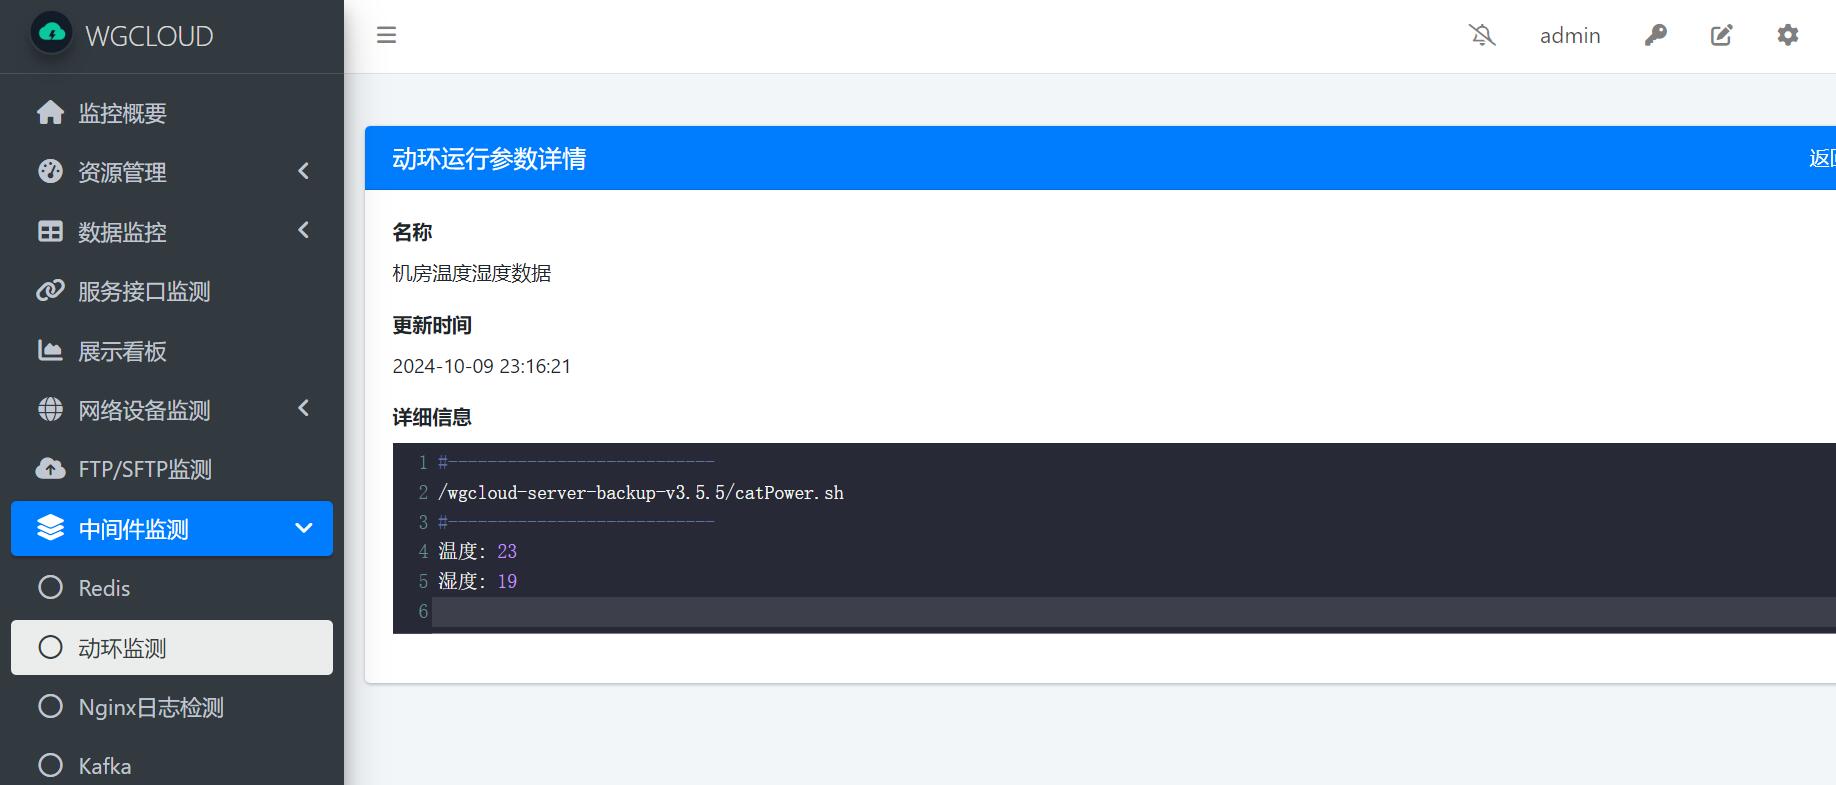
- Middleware and platform coverage includes K8S, Redis, Nginx and Kafka.
- Agents run on Debian, RedHat, CentOS, Ubuntu, Fedora, SUSE, Kylin, UOS and Loongson/mips Linux, Windows Server 2008 R2 through 2025 and Windows 7 through 11, Solaris, FreeBSD, OpenBSD, macOS on amd64 and arm64, ARM, Android, riscv64, s390x, Raspberry Pi and AIX.
Who uses it and how
- Operations teams running heterogeneous fleets, because a single server can accept agent reports from Linux, Windows, Unix and macOS hosts at once.
- Larger environments that need concurrent monitoring: the agent/server split is described as supporting several thousand hosts online at the same time.
- Teams that need process, port, log, Docker and database-table checks alongside plain host metrics, since those are configured in the same platform rather than a second tool.
- Network administrators monitoring SNMP devices such as switches, routers and printers, with topology maps generated automatically from discovered devices.
- Teams that want web SSH, batch command execution and alert delivery to email, DingTalk, WeChat or SMS inside the same interface they use for dashboards.
Getting started
Build and run from source: open the wgcloud-server and wgcloud-agent Maven projects in IDEA or Eclipse with JDK 1.8 or JDK 11, create a MySQL database named wgcloud and import sql/wgcloud.sql, then start the packaged wgcloud-server-release.jar with the scripts in the bin directory. An online demonstration is available at the vendor documentation site.
How it compares
The facts provide no list of paid products this project replaces, so comparison rests on the similar tools named in its topics: Nagios, Prometheus and Grafana, which occupy the same infrastructure-monitoring role but appear here as adjacent tooling rather than as stated replacements. The notable split is internal rather than external: the repository holds only the open-source edition under Apache-2.0, while the vendor's commercial edition is free to use but closed-source, and the README itself recommends the commercial build for production because it has more features, better performance and security, and more active updates.
When to use it — and when not to
A self-hoster must operate more than the application: a JDK 1.8 or 11 runtime, a supported database (MySQL 5.5 or later, MariaDB, PostgreSQL or Oracle), and a server plus an agent on every monitored host. Teams that need a fully open-source production stack, or that want the richer feature set and vendor support described for the commercial build, should not start with this repository. The other honest caveat is that the README is light on deployment detail and points to the vendor site for the actual documentation and downloads, so plan on reading external docs rather than working from the repository alone.