Wachd
Self-hosted alert intelligence platform with root cause analysis.
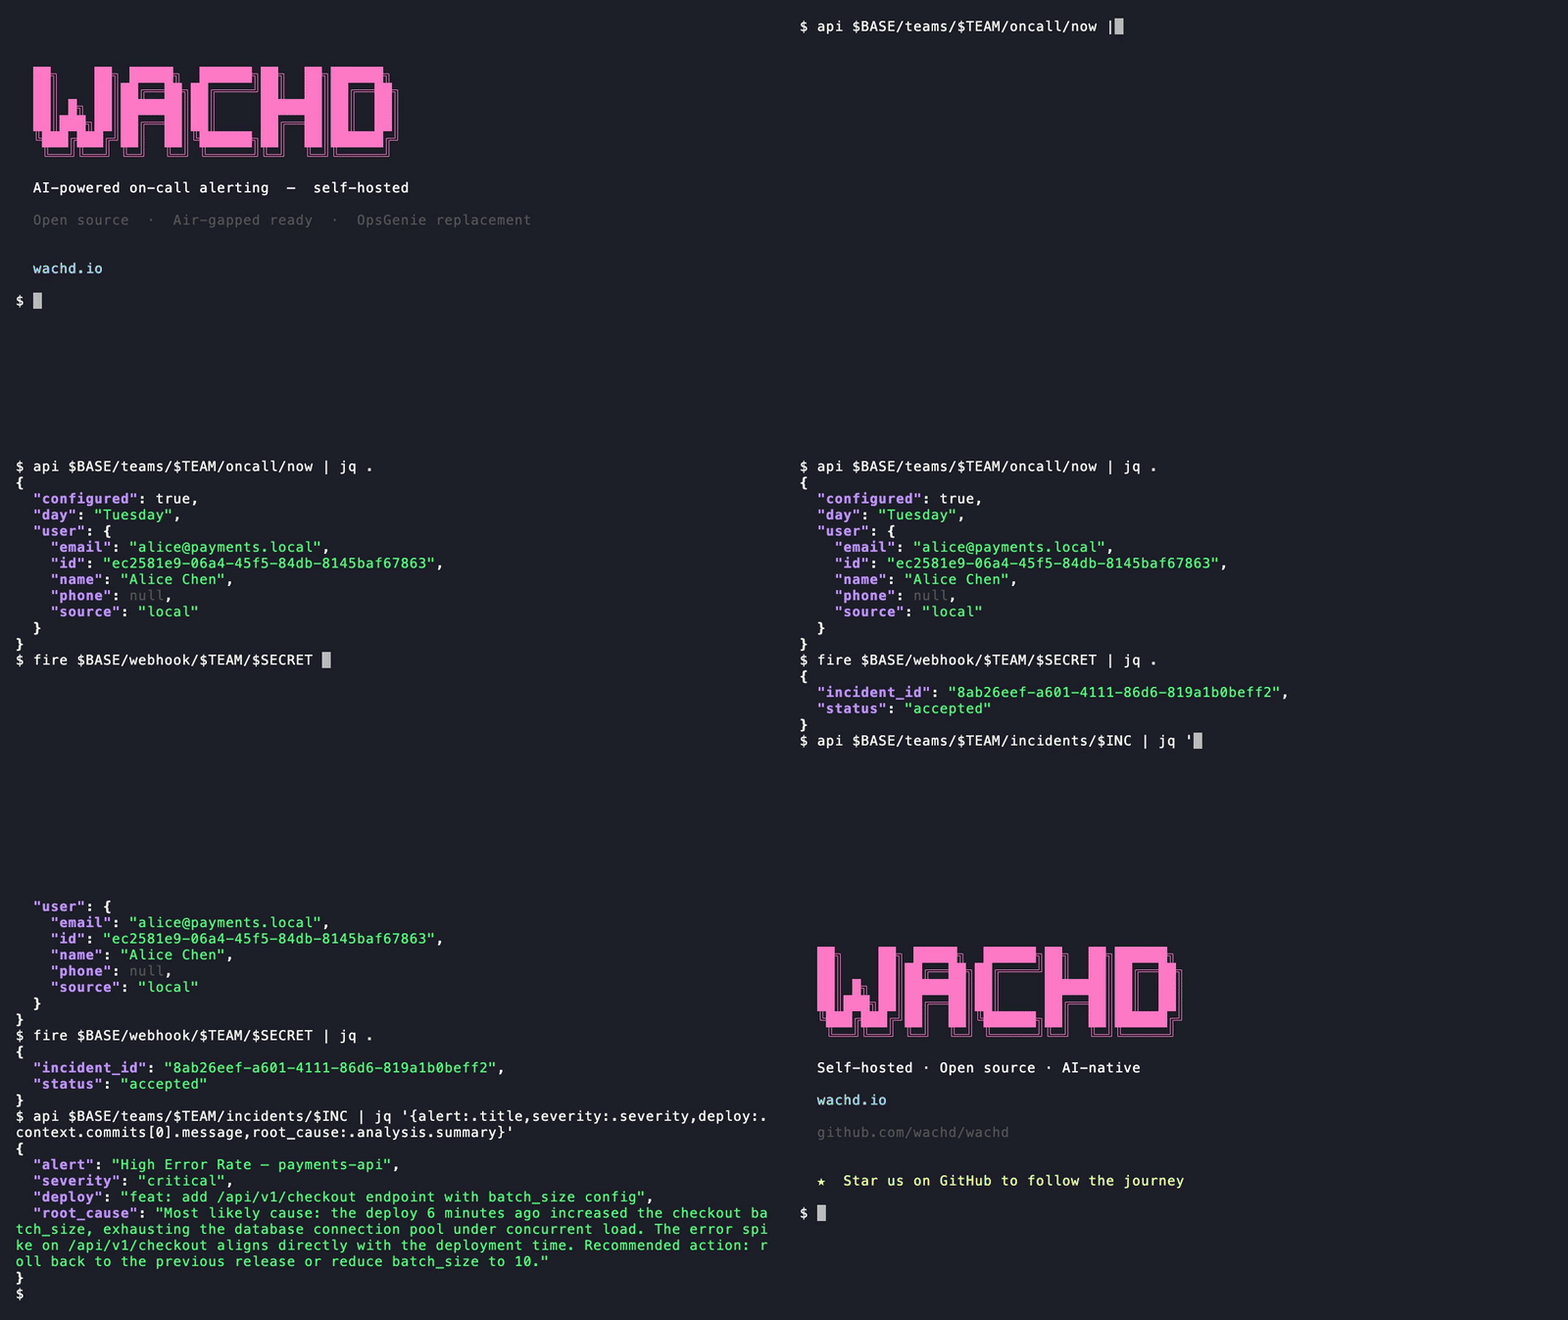
Wachd receives alerts from your monitoring tools (Grafana, Datadog, Prometheus) and automatically collects context, sanitizes PII, correlates events, and routes a plain-English diagnosis to the on-call engineer.




If Wachd is useful to you, a ⭐ on GitHub helps other engineers find it.
Try the live demo → — no install, no cluster, sandbox from just an email.
Founders Program — 10 lifetime SMB licenses We're giving 10 engineering teams a lifetime Wachd SMB license at no cost. Deploy it, use it seriously, tell us what's broken. Claim a slot on Discord or email [email protected].
How It Works
When an alert fires, Wachd:
- Receives the webhook from Grafana, Datadog, Splunk, or any compatible source
- Fetches context — recent commits, error logs, metric history around the alert time
- Strips all PII from the collected context before any analysis
- Runs root cause correlation to build a causal timeline
- Looks up who is on-call for that team
- Sends a notification with the probable cause and suggested action
No agents run in your application clusters. Wachd receives alerts inbound via HTTPS and calls your monitoring APIs outbound. Your data stays in your infrastructure.
Architecture
Your Monitoring (Grafana / Datadog / Prometheus)
    │
    └──► POST /api/v1/webhook/{teamId}/{secret}
              │
              ▼
         Redis Queue
              │
              ▼
         Worker Process
           ├── Collect context (GitHub, Loki, Prometheus)
           ├── Sanitize PII
           ├── Correlate events → causal timeline
           ├── Run root cause analysis (Ollama)
           └── Notify on-call engineer (Slack + Email)
See docs/ for architecture diagrams.
Authentication
Wachd includes an enterprise authentication system with local users, SSO (OIDC), and API tokens. On the first startup a superadmin account is created automatically and the credentials are printed to the server log.
See docs/authentication.md for the complete guide, including:
- Bootstrap admin setup
- Local user management
- Password policy configuration
- Local groups and team access
- SSO provider configuration (Microsoft Entra, Okta, Google Workspace)
- Group mappings (AD group to Wachd team)
- Kubernetes secrets setup
See docs/api-tokens.md for programmatic API access using Bearer tokens.
Prerequisites
- Go 1.24+
- Docker and Docker Compose
- Make
Quick Start
1. Start infrastructure
make docker-up
Starts PostgreSQL and Redis in Docker.
2. Install dependencies
make deps
3. Configure environment
Copy the example environment file and fill in your values:
cp .env.example .env
Key settings in .env:
DATABASE_URL=postgres://wachd:wachd@localhost:5432/wachd
REDIS_URL=redis://localhost:6379

# Trusted ingress/proxy CIDRs for webhook client IP extraction.
# Empty means X-Forwarded-For is ignored and rate limiting uses RemoteAddr.
TRUSTED_PROXY_CIDRS=

# Analysis backend (Ollama for local, air-gapped deployments)
AI_BACKEND=ollama
OLLAMA_ENDPOINT=http://localhost:11434
OLLAMA_MODEL=llama3.2

# Optional — notifications
SLACK_WEBHOOK_URL=https://hooks.slack.com/services/...
SMTP_HOST=smtp.example.com
SMTP_PORT=587
[email protected]
SMTP_PASS=your-smtp-password
4. Start the server, worker, and web dashboard
make dev
Opens:
- API server on
http://localhost:8080 - Web dashboard on
http://localhost:3000
5. Send a test alert
make test-webhook
Deploy with Docker Compose
The fastest way to self-host Wachd on a single server or VPS. No Kubernetes required.
git clone https://github.com/wachd/wachd
cd wachd
make compose-up
If you have a local
.envfrom development:DATABASE_URLandREDIS_URLuselocalhosthostnames, which won't resolve inside Docker. Either remove the.envfile (the compose defaults use Docker service names) or update those two values topostgres:5432andredis:6379.
First run — get your admin credentials:
On the very first startup, Wachd creates a superadmin account and prints the credentials once to the server log. Retrieve them with:
docker compose logs wachd-server | grep -A 6 "BOOTSTRAP ADMIN"
You will see:
║  Username: wachd_admin                        ║
║  Password: <generated-password>               ║
Log in at http://localhost:3000 and change the password immediately when prompted.
Before going to production: generate a unique encryption key and set it in
.env:cp .env.example .env echo "WACHD_ENCRYPTION_KEY=$(openssl rand -hex 32)" >> .envThe default key in
docker-compose.ymlis public — anyone using it can decrypt credentials stored in your database. Fine for local evaluation, not for production.
By default Wachd uses Ollama for AI analysis (no external API calls). Pull a model after the stack starts:
docker exec wachd-ollama ollama pull llama3.2
To use OpenAI instead, copy .env.example to .env and set:
AI_BACKEND=openai
OPENAI_API_KEY=sk-...
Then make compose-up again.
To stop:
make compose-down
Why not
docker compose downdirectly? The app services (wachd-server,wachd-worker,wachd-web) use theappprofile. Runningdocker compose downwithout--profile appskips them, leaving the network in use. Always usemake compose-down— ordocker compose --profile app downif you prefer the raw command.
Project Structure
wachd/
├── cmd/
│   ├── server/          # Webhook receiver and REST API
│   └── worker/          # Background job processor
├── internal/
│   ├── store/           # PostgreSQL models and queries
│   ├── queue/           # Redis job queue
│   ├── collector/       # Context collection (GitHub, Loki, Prometheus)
│   ├── sanitiser/       # PII removal — 21 regex patterns
│   ├── correlator/      # Event correlation and causal timeline
│   ├── oncall/          # On-call schedule and rotation engine
│   ├── notify/          # Slack and email notifications
│   └── ai/              # Pluggable analysis backend (Ollama)
├── web/                 # Next.js 15 dashboard (TypeScript, Tailwind)
├── helm/wachd/          # Helm chart for Kubernetes deployment
├── scripts/             # Development and review utilities
└── docs/                # Architecture diagrams
Makefile Commands
make help          # Show all available commands
make dev           # Run server + worker + web dashboard
make server        # Run API server only
make worker        # Run background worker only
make web           # Run web dashboard only
make test          # Run all tests
make build         # Build server and worker binaries
make test-webhook  # Send a test alert to the local server
make logs          # Follow Docker Compose logs
make clean         # Remove build artifacts
API Reference
Receive an alert
POST /api/v1/webhook/{teamId}/{secret}
Accepts JSON payloads from Grafana, Datadog, Prometheus Alertmanager, or any custom source.
Incidents
GET  /api/v1/teams/{teamId}/incidents
GET  /api/v1/teams/{teamId}/incidents/{incidentId}
POST /api/v1/teams/{teamId}/incidents/{incidentId}/ack
POST /api/v1/teams/{teamId}/incidents/{incidentId}/resolve
POST /api/v1/teams/{teamId}/incidents/{incidentId}/snooze
On-call
GET /api/v1/teams/{teamId}/oncall/now
GET /api/v1/teams/{teamId}/schedule
PUT /api/v1/teams/{teamId}/schedule
Utility
GET /api/v1/health    # Liveness probe
GET /api/v1/metrics   # Prometheus metrics endpoint
Kubernetes Deployment
Wachd ships with a production-grade Helm chart.
Prerequisites
- PostgreSQL 15+ (AWS RDS, Azure DB for PostgreSQL, GCP Cloud SQL, or self-hosted)
- Redis 7+ (AWS ElastiCache, Azure Cache for Redis, or self-hosted)
- Kubernetes 1.26+
- Helm 3.10+
- cert-manager v1.13+ installed in the cluster
Optional prerequisites (required only if