
magic-trace


Overview
magic-trace collects and displays high-resolution traces of what a process is doing. People have used it to:
- figure out why an application running in production handles some requests slowly while simultaneously handling a sea of uninteresting requests,
- look at what their code is actually doing instead of what they think it's doing,
- get a history of what their application was doing before it crashed, instead of a mere stacktrace at that final instant,
- ...and much more!
magic-trace:
- has 2%-10% overhead,
- doesn't require application changes to use,
- traces every function call with ~40ns resolution, and
- renders a timeline of call stacks going back (a configurable) ~10ms.
You use it like perf: point it to a process and off it goes. The key difference from perf is that instead of sampling call stacks throughout time, magic-trace uses Intel Processor Trace to snapshot a ring buffer of all control flow leading up to a chosen point in time[^1]. Then, you can explore an interactive timeline of what happened.
You can point magic-trace at a function such that when your application calls it, magic-trace takes a snapshot. Alternatively, attach it to a running process and detach it with Ctrl+C, to see a trace of an arbitrary point in your program.
[^1]: perf can do this too, but that's not how most people use it. In fact, if you peek under the hood you'll see that magic-trace uses perf to drive Intel PT.
Testimonials
"Magic-trace is one of the simplest command-line debugging tools I have ever used."
- Francis Ricci, Jane Street
"Magic-trace is not just for performance. The tool gives insight directly into what happens in your program, when, and why. Consider using it for all your introspective goals!"
- Andrew Hunter, Jane Street
I use perf a ton, and I think that both perf and magic-trace give perspectives that the other doesn't. The benefit I got from magic-trace was entirely based on the fact that it works in slices at any zoom level, so I was able to see all the function calls that a 70ns function was performing, which was invisible in perf.
- Doug Patti, Jane Street
Install
Make sure the system you want to trace is supported. The constraints that most commonly trip people up are: VMs are mostly not supported, Intel only (Skylake[^3] or later), Linux only.
Grab a release binary from the latest release page.
- If downloading the prebuilt binary (not package),
chmod +x magic-trace[^4] - If downloading the package, run
sudo dpkg -i magic-trace*.deb
Then, test it by running
magic-trace -help, which should bring up some help text.- If downloading the prebuilt binary (not package),
[^3]: Strictly speaking, anything newer than Broadwell, but this is not a platform we regularly test on, and timing resolution is worse (~1us). [^4]: https://github.com/actions/upload-artifact/issues/38
Getting started
Here's a sample C program to try out. It's a slightly modified version of the example in
man 3 dlopen. Download that, build it withgcc demo.c -ldl -o demo, then leave it running./demo. We're going to use that program to learn howdlopenworks.Run
magic-trace attach -pid $(pidof demo). When you see the message that it's successfully attached, wait a couple seconds and Ctrl+Cmagic-trace. It will output a file calledtrace.fxt.gzin your working directory.
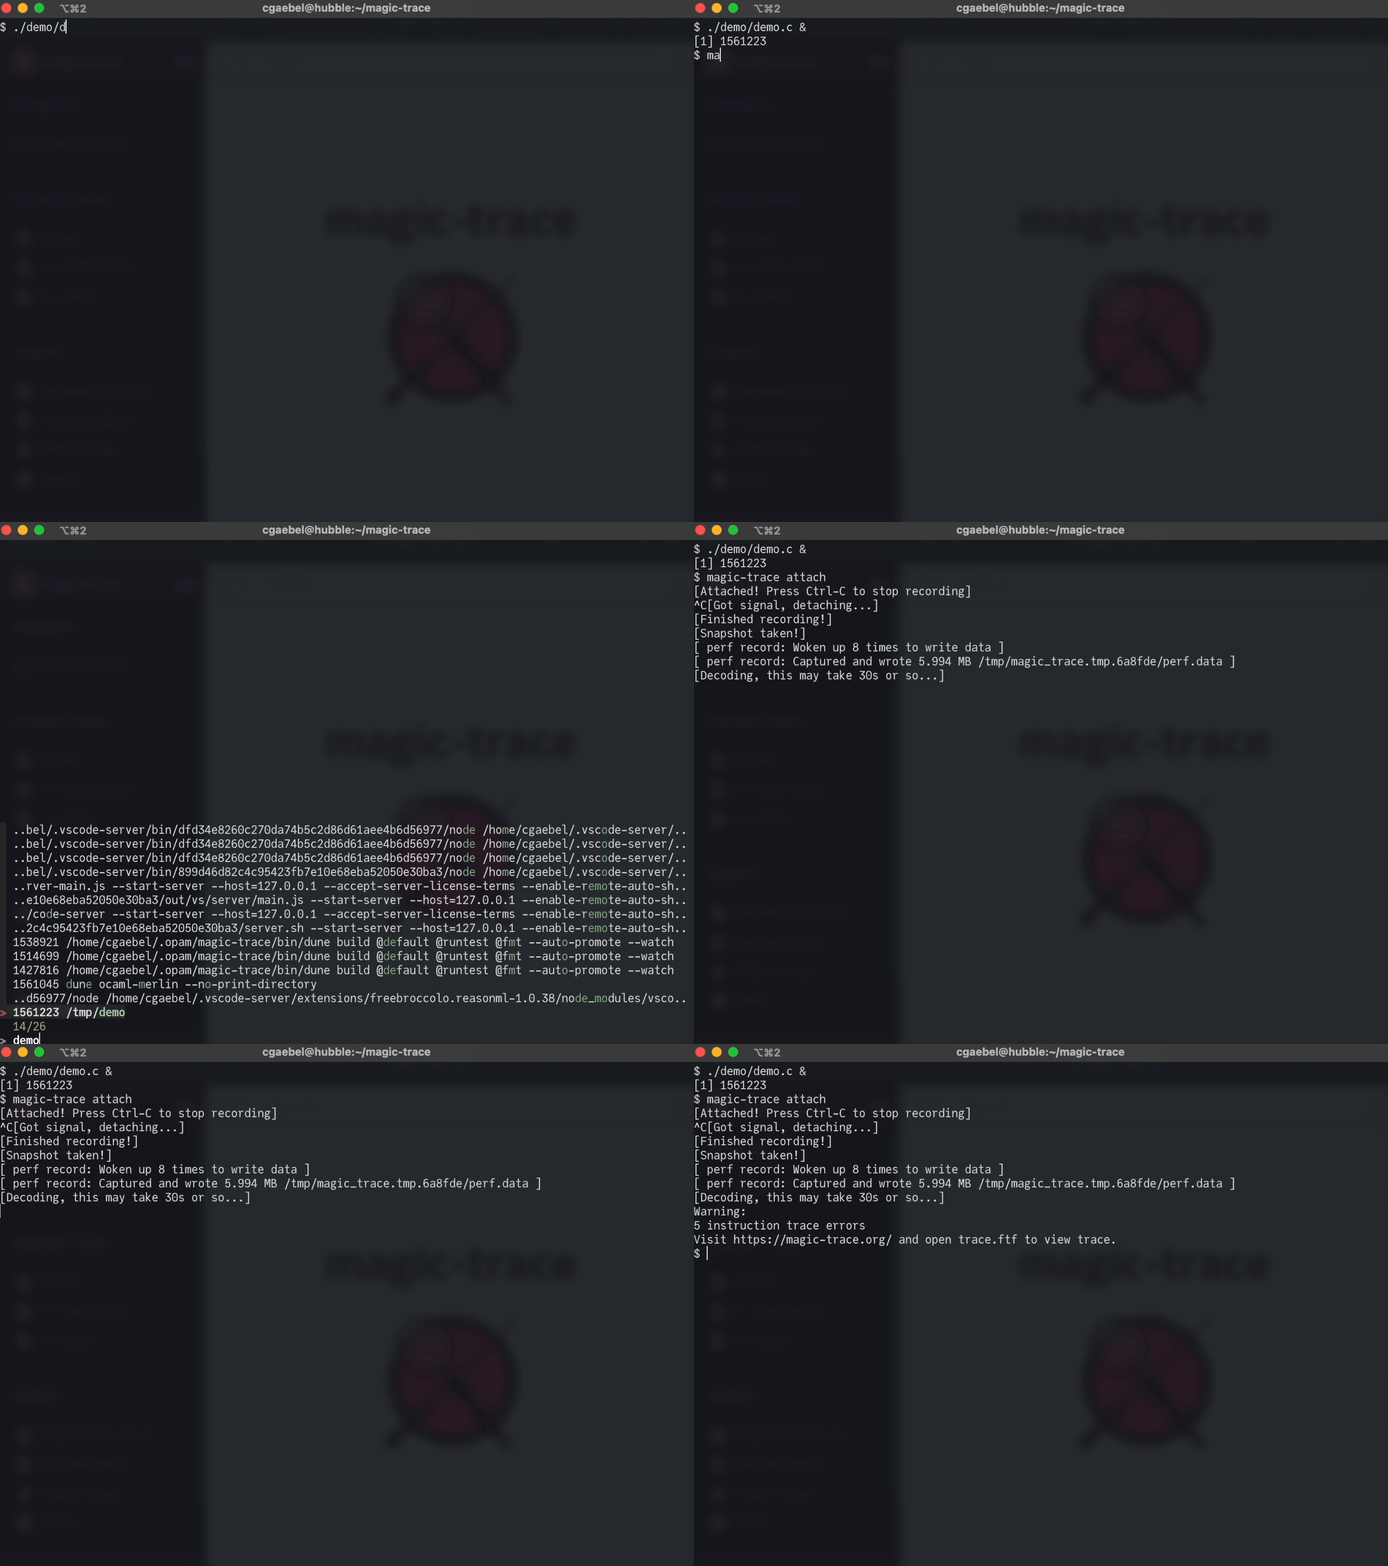
- Open magic-trace.org, click "Open trace file" in the top-left-hand and give it the trace file generated in the previous step.
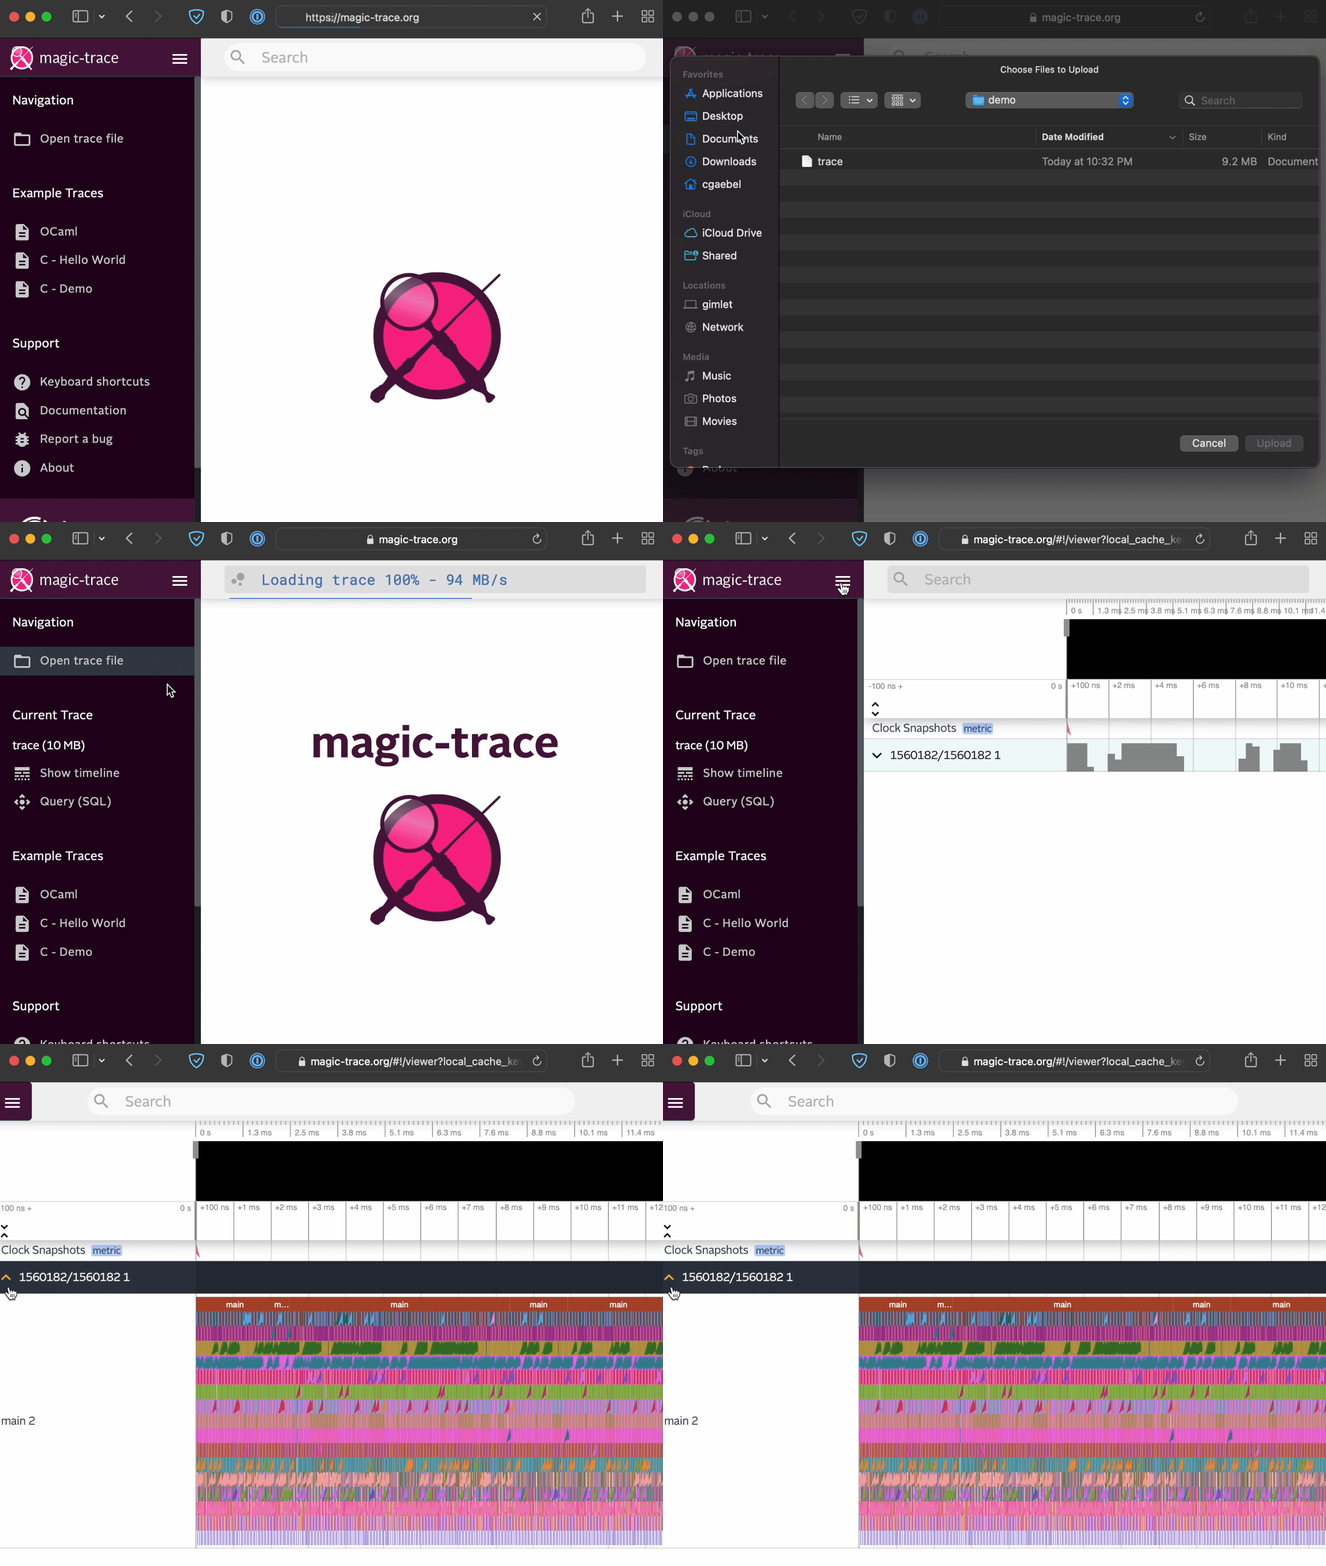
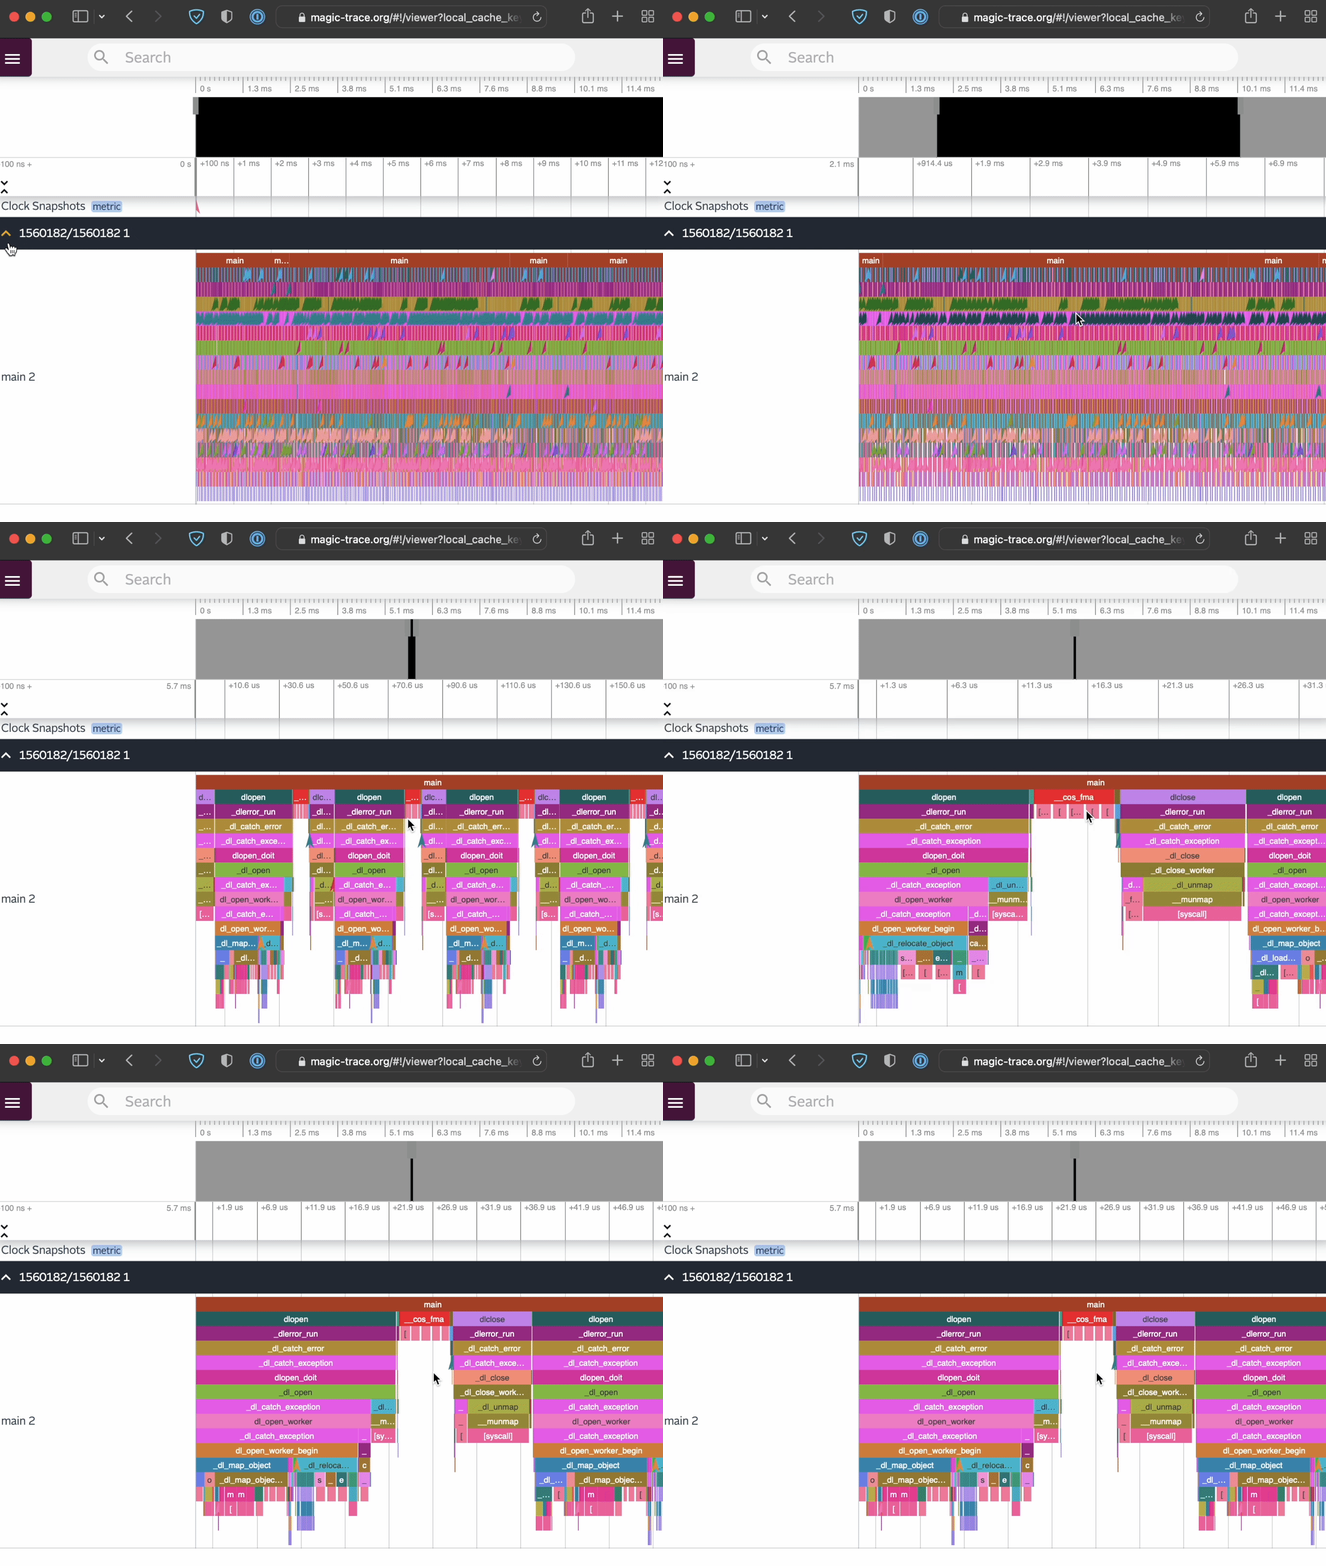
- That should have expanded into a trace. Zoom in until you can see an individual loop through
dlopen/dlsym/cos/printf/dlclose.- W zooms into wherever your mouse cursor is pointed (you'll need to zoom in a bunch to see anything useful),
- S zooms out,
- A moves left,
- D moves right, and
- scroll wheel moves your viewport up and down the stack. You'll only need to scroll to see particularly deep stack traces, it's probably not useful for this example.
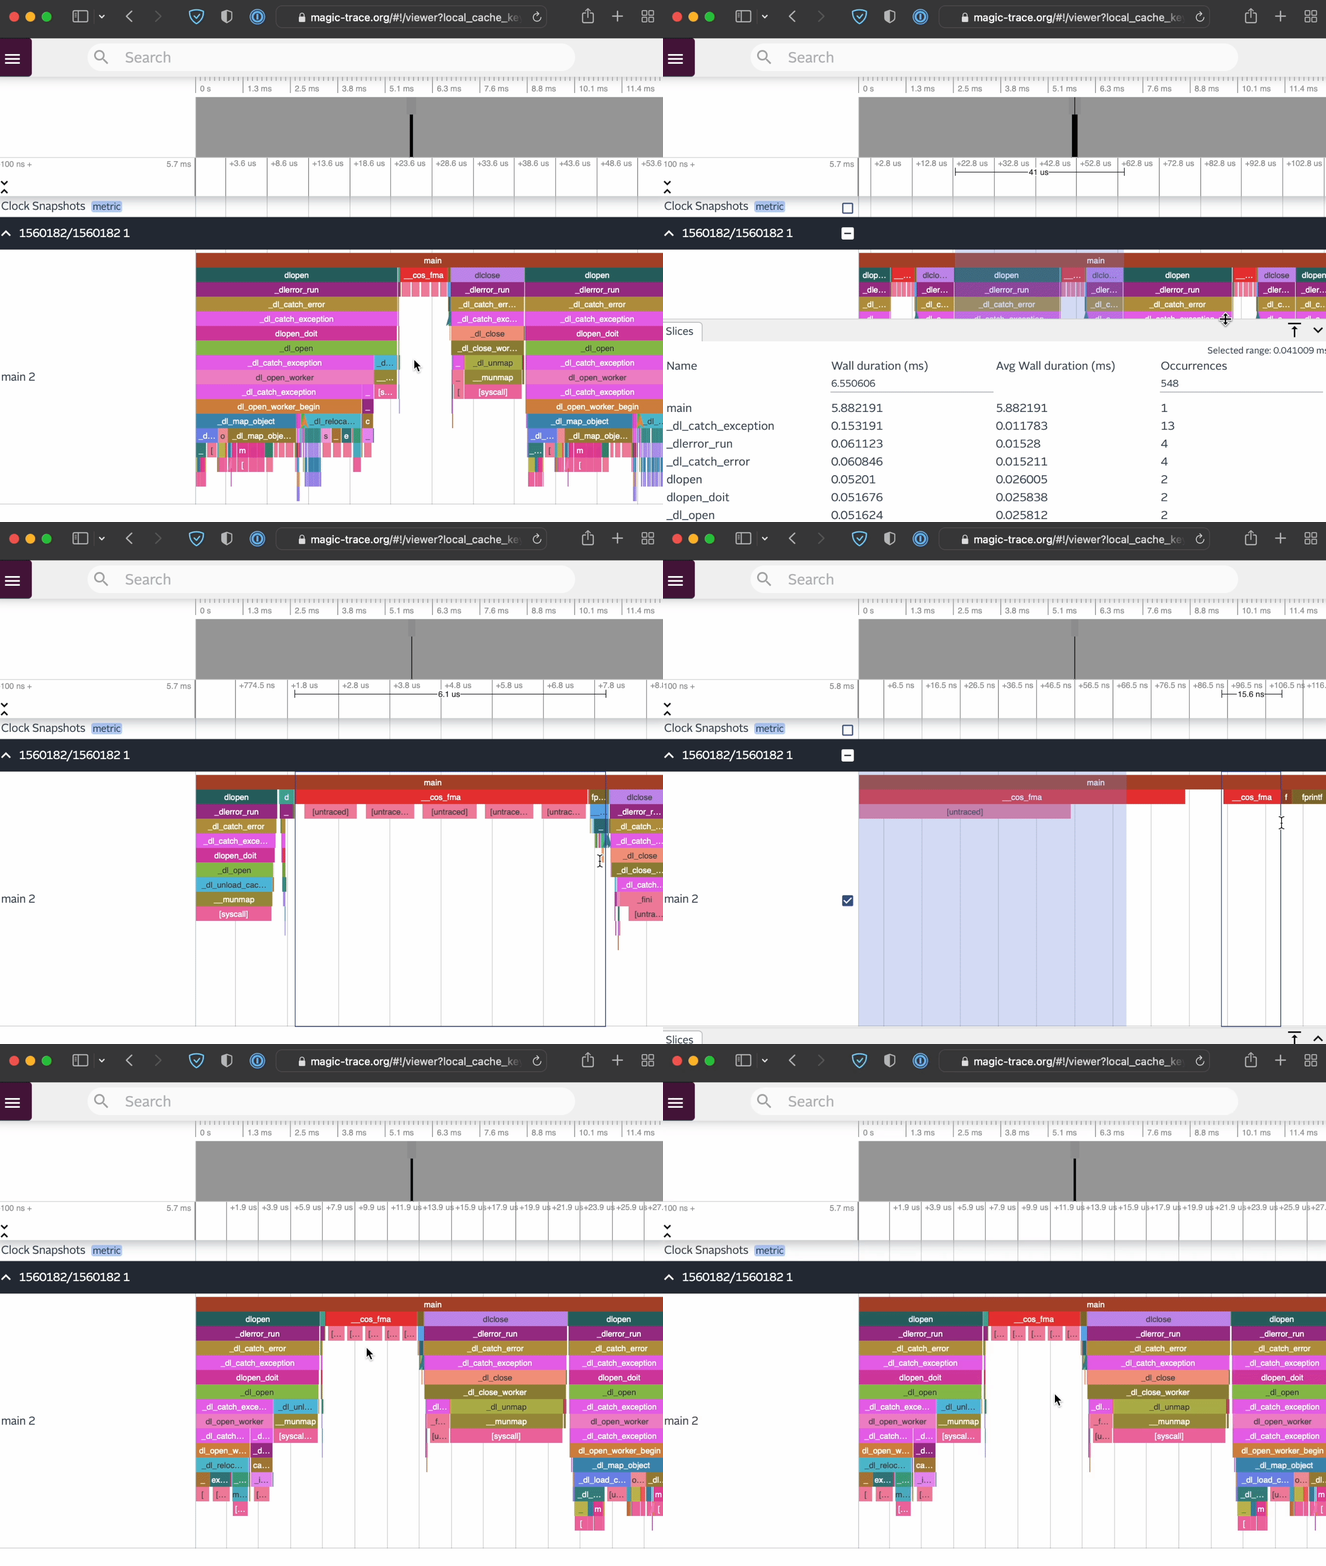
- Click and drag on the white space around the call stacks to measure. Plant flags by clicking in the timeline along the top. Using the measurement tool, measure how long it takes to run
cos. On my screen it takes ~5.7us.
Congratulations, you just magically traced your first program!
In contrast to traditional perf workflows, magic-trace excels at hypothesis generation. For example, you might notice that taking 6us to run cos is a really long time! If you zoom in even more, you'll see that there's actually five pink "[untraced]" cells in there. If you re-run magic-trace with root and pass it -trace-include-kernel, you'll see stacktraces for those. They're page fault handlers! The demo program actually calls cos twice. If you zoom in even more near the end of the 6us cos call, you'll see that the second call takes far less time and does not page fault.
How to use it
magic-trace continuously records control flow into a ring buffer. Upon some sort of trigger, it takes a snapshot of that buffer and reconstructs call stacks.
There are two ways to take a snapshot:
We just did this one: Ctrl+C magic-trace. If magic-trace terminates without already having taken a snapshot, it takes a snapshot of the end of the program.
You can also trigger snapshots when the application calls a function. To do so, pass magic-trace
the -trigger flag.
-trigger '?'brings up a fuzzy-finding selector that lets you choose from all symbols in your executable,-trigger SYMBOLselects a specific, fully mangled, symbol you know ahead of time, and-trigger .selects the default symbolmagic_trace_stop_indicator.
Stop indicators are powerful. Here are some ideas for where you might want to place one:
- If you're using an asynchronous runtime, any time a scheduler cycle takes too long.
- In a server, when a request takes a surprisingly long time.
- After the garbage collector runs, to see what it's doing and what it interrupted.
- After a compiler pass has completed.
You may leave the stop indicator in production code. It doesn't need to do anything in particular, magic-trace just needs the name. It is just an empty, but not inlined, function. It will cost ~10us to call, but only when magic-trace actually uses it to take a snapshot.
Documentation
More documentation is available on the magic-trace wiki.
Discussion
Join us on Discord to chat synchronously, or the GitHub discussion group to do so asynchronously.
Contributing
If you'd like to contribute:
- read the build instructions,
- set up your editor,
- take a quick tour through the codebase, then
- hit up the issue tracker for a good starter project.
Privacy policy
magic-trace does not send your code or derivatives of your code (including traces) anywhere.
[magic-tr