




lazyjournal is a free, open source monitoring & observability project written in Go and released under MIT. It has 1,406 GitHub stars, 34 forks and 9 open issues, and was last pushed 2 months ago. On this registry it ranks #203 of 271 tracked projects in Monitoring & Observability, with 5 head-to-head comparisons available.

What is lazyjournal?

lazyjournal is a terminal user interface, written in Go, for reading and filtering logs from journald, auditd, the file system, Docker and Podman containers, Compose stacks and Kubernetes pods, and it is aimed at system administrators, SREs and developers who need to inspect logs from many different sources without leaving the terminal.

What it is

lazyjournal is a Go application built on the awesome-gocui library, a fork of gocui, and it is published as an open-source project under the MIT licence. It presents an interactive terminal interface with lists of log sources on one side and streaming log output on the other, and it was inspired by and written in the same spirit as LazyDocker and LazyGit. The project appears in the Awesome-Go, Awesome-TUIs and Awesome-Docker lists.

The concrete problem it solves is command sprawl. Reading logs on a modern host typically means switching between journalctl for systemd journals, docker logs or file-based container logs, kubectl logs for pods, and plain tail or grep against files under /var/log. lazyjournal replaces that scattered set of per-source commands with one interface that lists every available log source, applies a common set of filters, and streams new events from the selected source in the manner of tail.

Key capabilities

  • Reads system and user journals through journalctl, lists all systemd services including disabled unit files, and exposes the list of system boots for kernel log output.
  • Lists audit rules from auditd so entries can be filtered by keys and viewed in interpret format.
  • Reads file system logs such as Apache, Nginx, syslog and messages from /var/log, plus log files in user home directories and descriptor log files held by processes.
  • Covers Docker and Swarm logs from the file system or a stream, merges all containers in Docker Compose stacks sorted by time across every entry, and reads Podman logs without a background socket.
  • Reads Kubernetes pod logs once the cluster connection is configured in kubeconfig, and reads k3s pod and container logs from the file system on any node, including workers.
  • Offers four filtering modes: Default for case-sensitive exact search, Fuzzy for inexact case-insensitive matching across space-separated phrases, Regex for regular expressions, and Date for since and until filtering on journald, Docker and Podman sources.
  • Supports several highlighting modes, including a built-in default highlighter that needs no dependencies and a tailspin mode, and reads rotated archives in gz, xz and bz2 formats, Packet Capture in pcap format, and Apple System Logs in asl format.

Who uses it and how

  • Single-host administrators use it to move between system and user journals, the systemd service list, boot history and auditd rules from one screen instead of separate commands.
  • Kubernetes and k3s operators use it for pod logs with context and namespace switching, and for reading pod and container logs directly from node file systems on workers.
  • Teams running container workloads use it to view Docker Compose stack logs merged and sorted by time, and Podman logs in environments where no background socket is available.
  • Operators with many machines use it to search and analyse logs from remote hosts in one interface, using rsyslog configuration or the ssh protocol.
  • Because the interface can be launched in a web browser when it runs inside a Docker container, it also suits headless or restricted environments.

Getting started

The README describes a simple installation: download one executable file, with no dependencies and no settings required, and run it. A Docker container option is also available and can serve the interface in a web browser, and a playground scenario is hosted on Killercoda.

How it compares

Among the tools the project names, LazyDocker and LazyGit are its direct stylistic ancestors, while its Fuzzy and Regex filtering modes are explicitly modelled on fzf and grep, and the tailspin mode delegates colouring to that separate tool. Uniquely among those, lazyjournal spans journald, files, containers and Kubernetes in one interface, and unlike the others it is a viewer that reads sources in place.

When to use it — and when not to

A user must already have access to the underlying log sources: journald and /var/log on the host, container runtime logs, a configured kubeconfig for Kubernetes, and rsyslog or ssh access for remote hosts. Anyone who needs log retention, indexing, alerting or long-term storage rather than interactive inspection should not choose it, because it reads existing sources in place. Users on systems without those sources, or without the privileges to read them, will find little to display.

project readme (upstream, from github) — read inline


Go Report
Mentioned in Awesome Go Go Reference Ask DeepWiki

Terminal user interface for viewing logs from journald, auditd, file system, Docker and Podman containers, Compose stacks and Kubernetes pods with support for log highlighting and several filtering modes. Written in Go with the awesome-gocui (fork gocui) library.

This tool is inspired by and made with love for LazyDocker and LazyGit. It is also included in Awesome-Go, Awesome-TUIs and Awesome-Docker, check out other useful projects on the repository pages.

[!NOTE] You can try it out on the Killercoda playground.
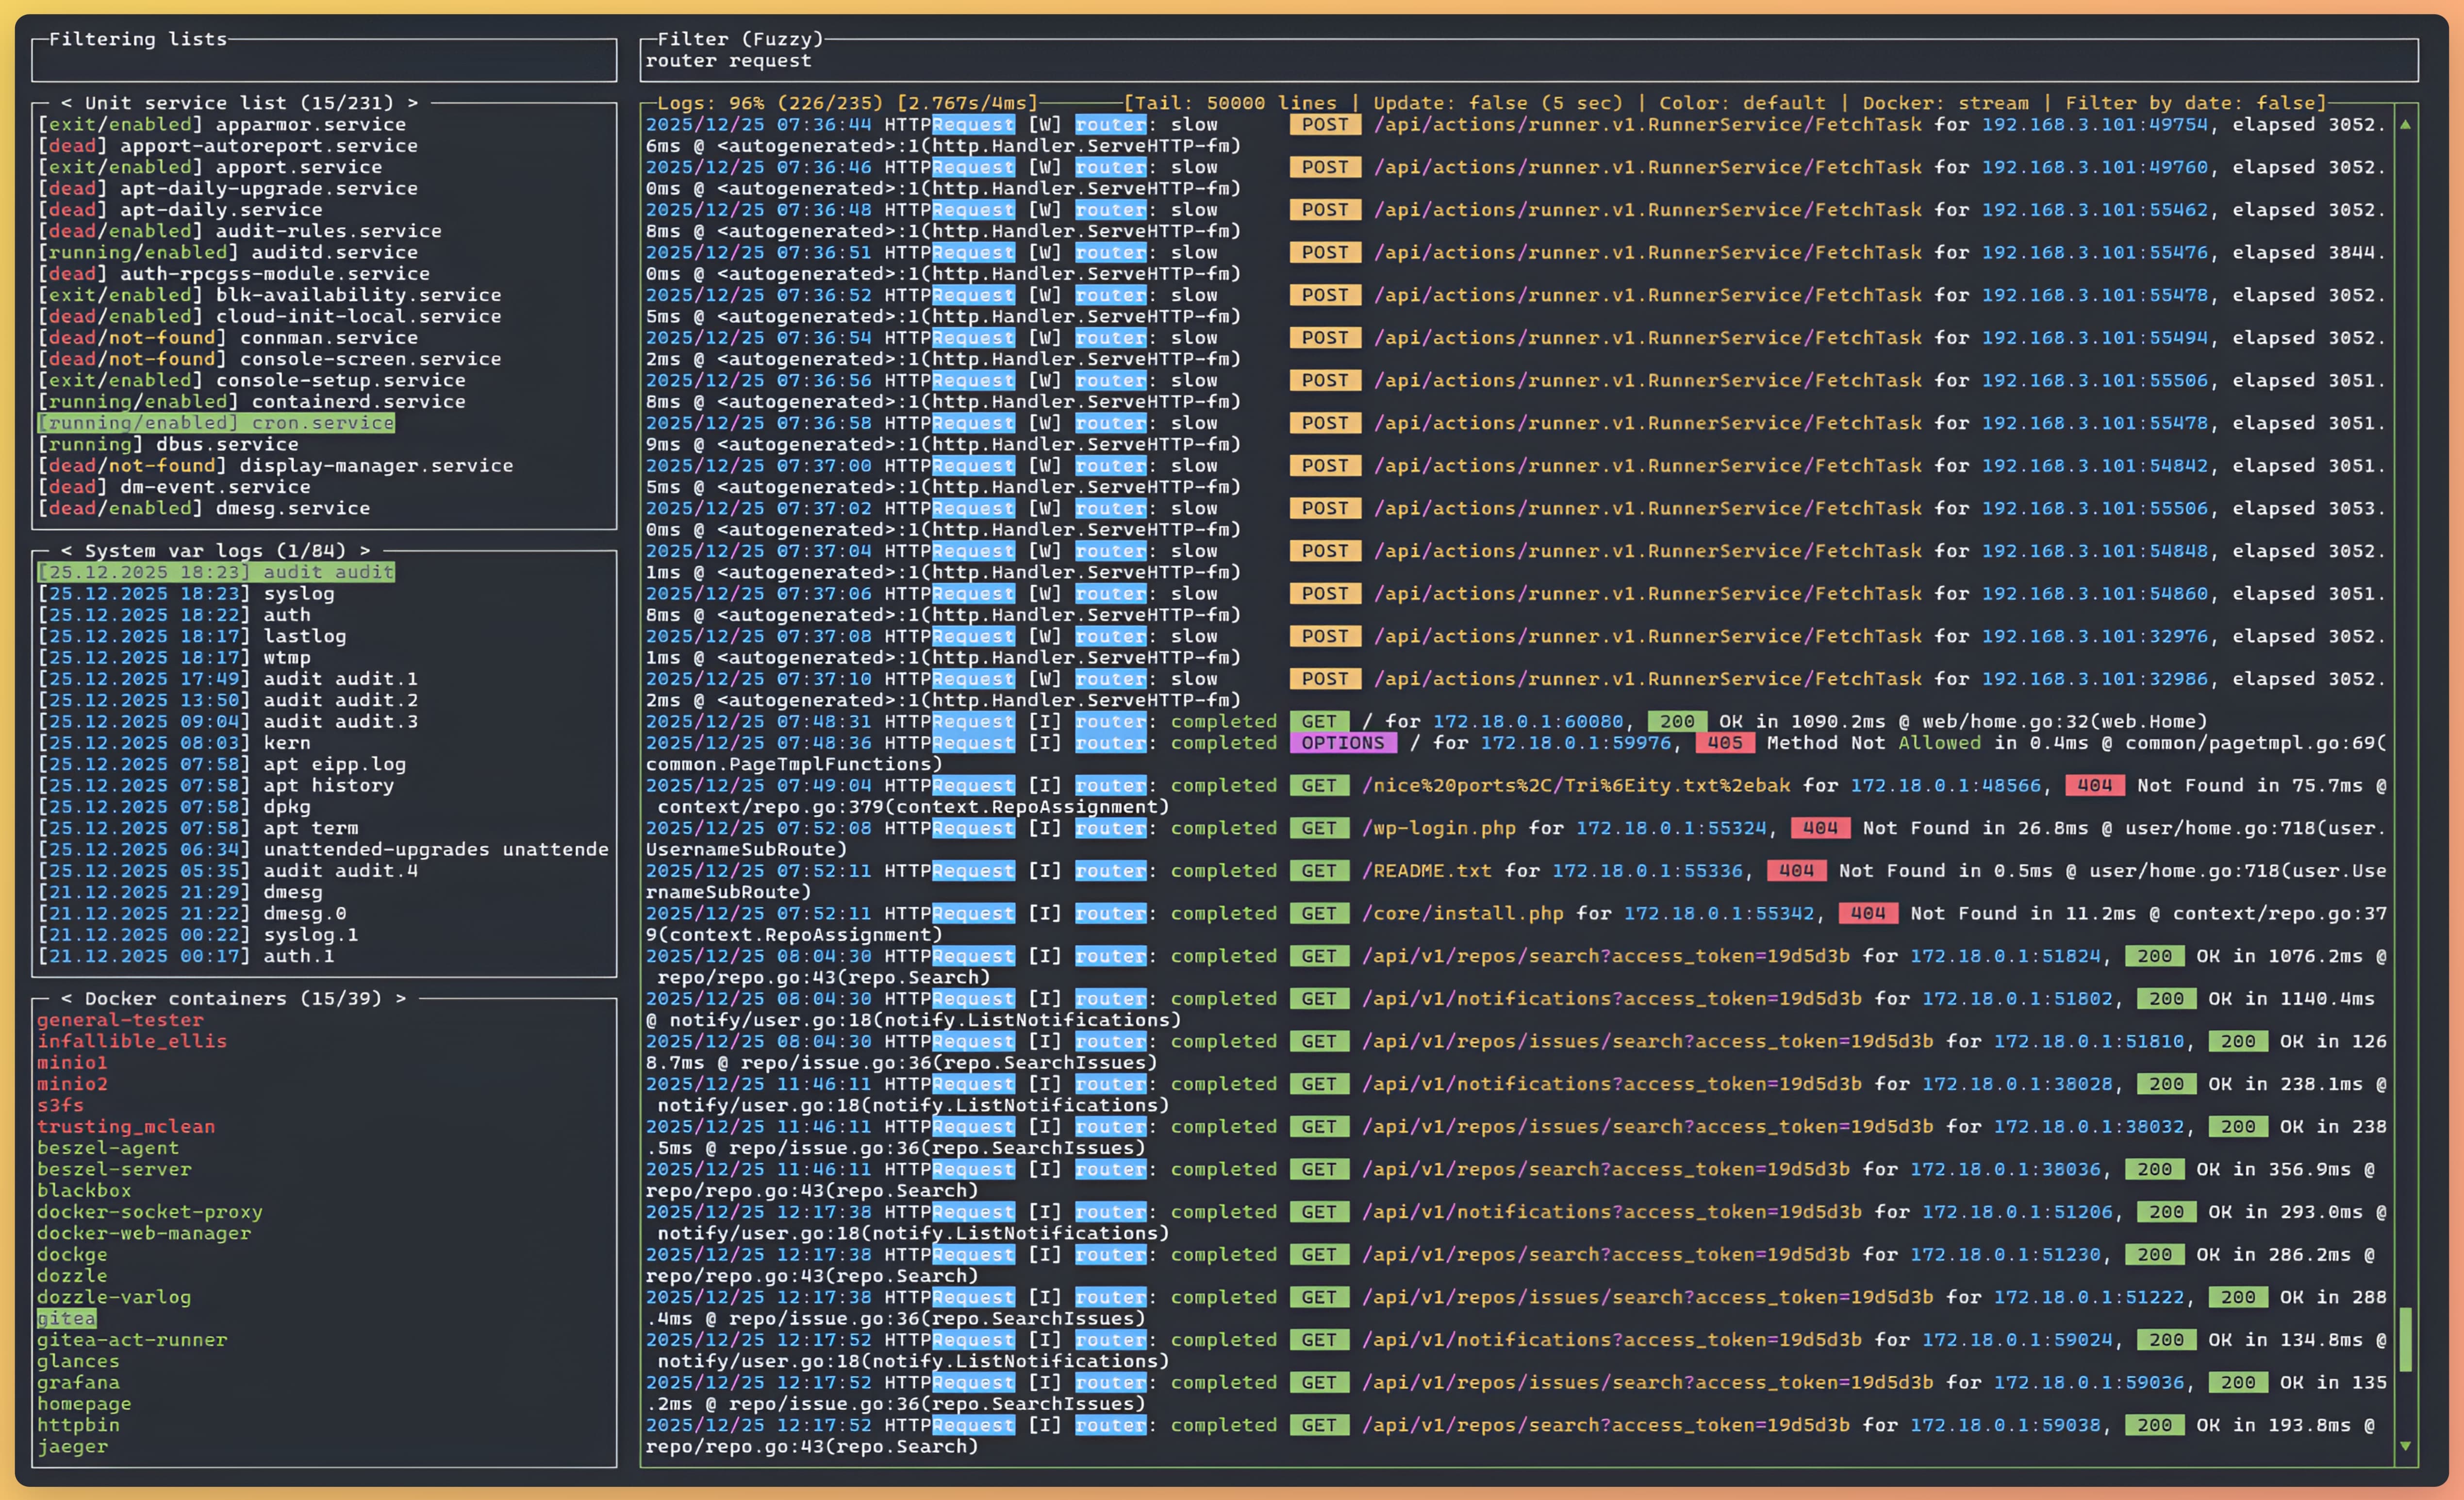
Regex filtering

Features

  • Simple installation, to run download one executable file without dependencies and settings.
  • It is possible to launch the interface in a Web browser when running in a Docker container.
  • Centralized search for the required journal by filtering all lists (log sources).
  • Streaming output of new events from the selected journal (like tail).
  • List of all services (including disabled unit files) with current state from systemd to access their logs.
  • View all system and user journals via journalctl (tool for reading logs from journald).
  • List of all system boots for kernel log output.
  • List of audit rules from auditd for filtering by keys and viewing in interpret format.
  • File system logs such as for Apache or Nginx, as well as syslog, messages, etc. from /var/log.
  • Lists all log files in users' home directories, as well as descriptor log files used by processes.
  • Reading archive logs truncated during rotation (gz, xz and bz2 formats) and Packet Capture (pcap format).
  • Apple System Logs support (asl format).
  • Windows Event Logs via PowerShell and wevtutil, as well as application logs from Windows file system.
  • Docker and Swarm logs from the file system or stream, including built-in timestamps and filtering by stream.
  • Logs of all containers in Docker Compose stacks, sorted by time for all entries.
  • Podman logs, without the need to run a background process (socket).
  • Kubernetes pods logs (you must first configure the cluster connection in kubeconfig).
  • Logs of k3s pods and containers from the file system on any nodes (including workers).
  • Search and analyze all logs from remote hosts in one interface using rsyslog configuration.
  • Access to logs on remote systems via the ssh protocol.
  • Supports context and namespace switching interface for Docker and Kubernetes.

Filtering

Supports 4 filtering modes:

  • Default - case sensitive exact search.
  • Fuzzy (like fzf) - custom inexact case-insensitive search (searches for all phrases separated by a space anywhere on a line).
  • Regex (like grep) - search with regular expression support, based on the built-in regexp library, case-insensitive by default (in case a regular expression syntax error occurs, the input field will be highlighted in red).
  • Date - filtering by date (since and/or until) for journald logs, as well as Docker or Podman containers (only supported in streaming mode) using the left and right arrow keys. This mode can be used in combination with other filtering modes and can improve loading performance for large logs. Changing the UTC offset is supported using the -T/--timezone-filter flag or the timezoneFilter configuration parameter (default: +00:00).

Highlighting

Several log output coloring modes are supported:

  • default - built-in log highlighter by default, requires no dependencies and is several times faster than other tools (including in command-line mode).
  • tailspin - uses tailspin.
  • bat - uses bat in ansi mode and log language (much slower than other modes).

When using external tools, they are required to be already installed on your system. You can also disable output highlighting with the Ctrl+Q keyboard shortcut, this is useful for improving performance when viewing large logs or if your terminal already has a built-in highlighting feature, such as WindTerm.

The built-in highlighting by default supports several color groups:

  • Custom - URLs, HTTP request methods and response status codes, double quotes and braces for json, file paths and processes in UNIX.
  • Yellow - warnings and known names (host name and system users).
  • Green - keywords indicating success.
  • Red - keywords indicating error.
  • Blue - statuses and actions (restart, update, etc).
  • Light blue - numbers (date, time, timestamp, bytes, versions, percentage, integers, IP and MAC addresses).

A full list of all keywords can be found in the color.log file (used for testing only).

[!IMPORTANT] If you have suggestions for improving log highlighting (e.g. adding new keywords), you can open an issue for a new feature.

Install

Binaries are available for download on the GitHub releases page.

Unix-based

Run the command in the console to quickly install or update the stable version for Linux, macOS or the BSD-based system:

curl -sSL https://raw.githubusercontent.com/Lifailon/lazyjournal/main/scripts/install.sh | bash

This command will run a script that will download the latest binary (auto-detect OS and arch) from the GitHub repository to your home directory along with other executables (default path is ~/.local/bin/lazyjournal) and configurations (~/.config/lazyjournal/config.yml) for the current user, and al

readme truncated — read the full docs on github

Frequently asked questions

Is lazyjournal free to use?

lazyjournal is open source under the MIT licence. There is no licence fee and no seat count — you can self-host it or, where the project offers one, pay a vendor for a managed version instead.

What does lazyjournal do?

TUI for viewing logs from journald, auditd, file system, Docker and Podman containers, Compose stacks and Kubernetes pods with support for log highlighting and

What is lazyjournal written in?

lazyjournal is primarily written in Go. Its source is publicly available at https://github.com/Lifailon/lazyjournal, and it has 1,406 GitHub stars.