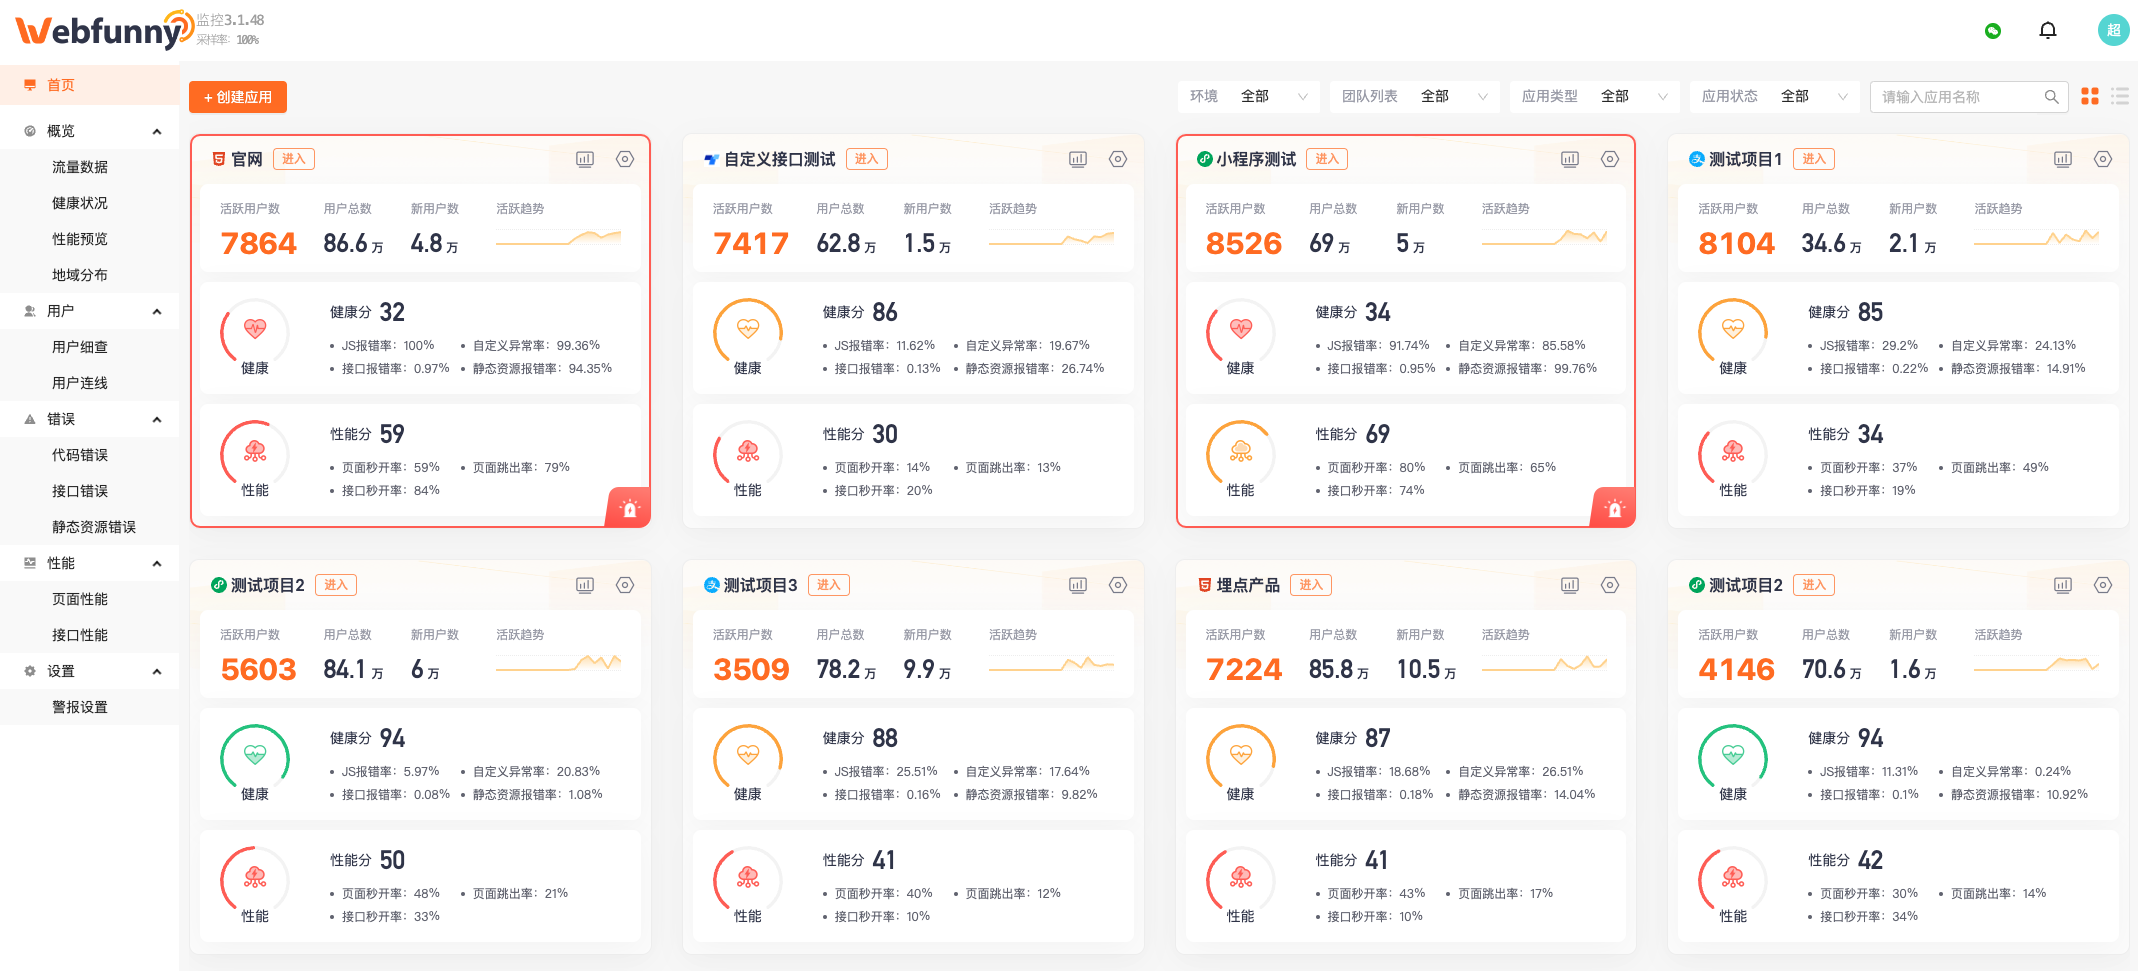
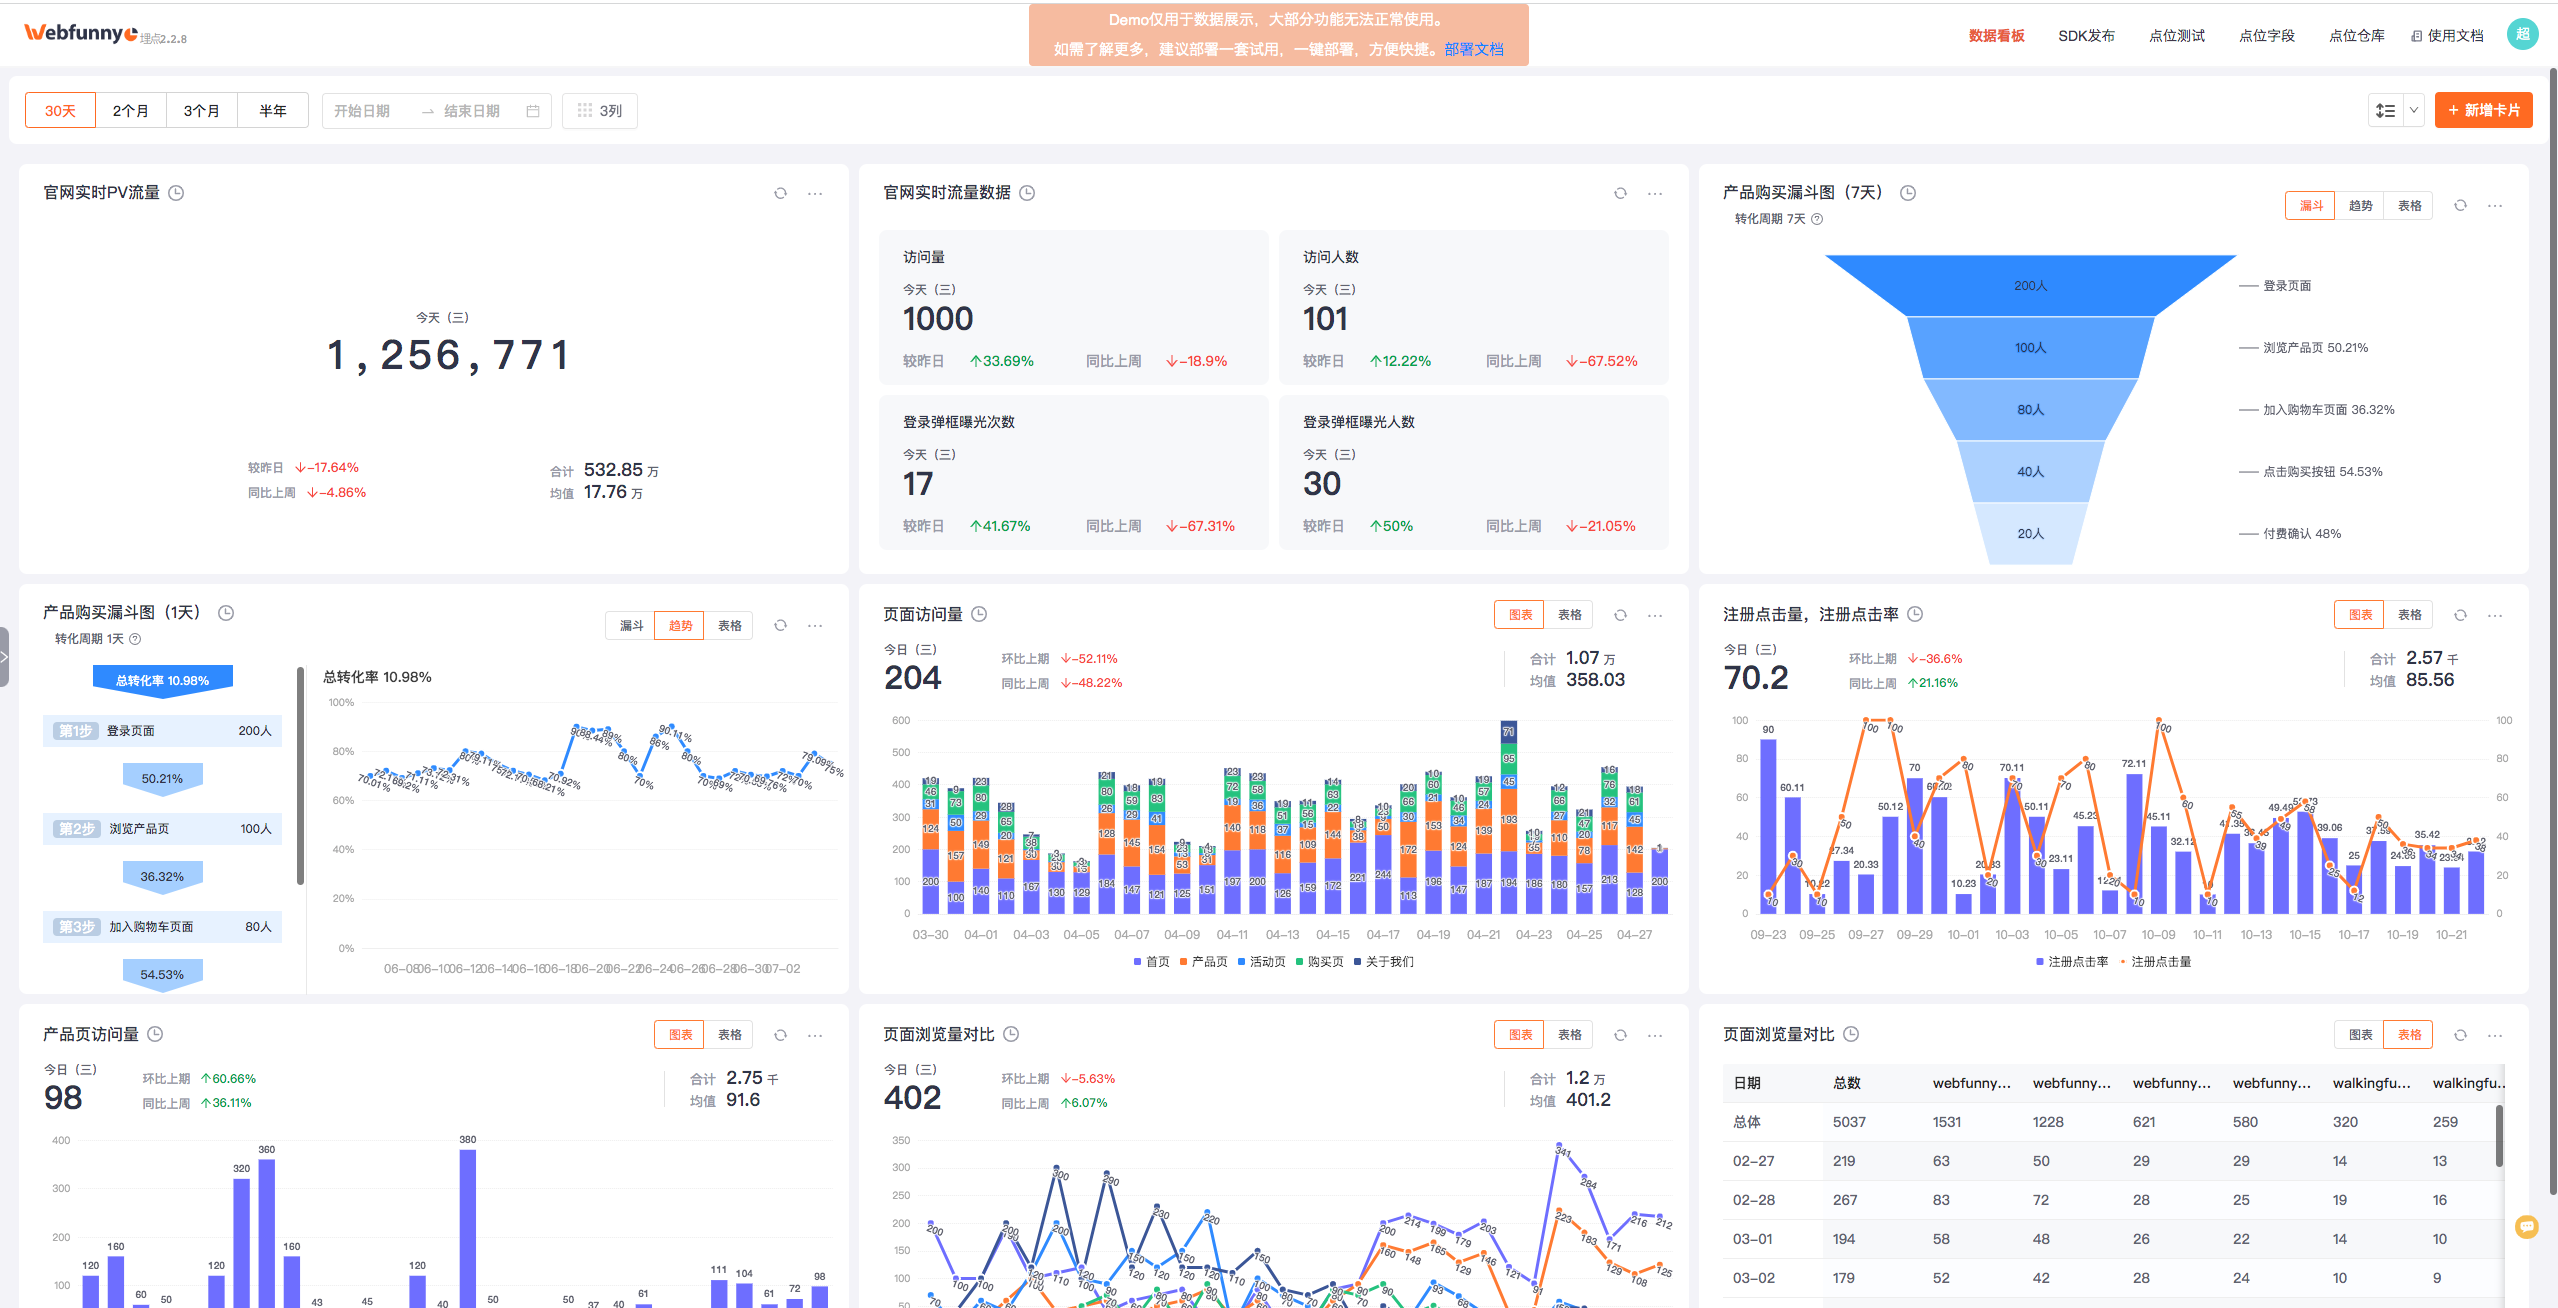
Webfunny Monitor is an Apache-2.0 licensed, JavaScript-based observability platform that combines front-end monitoring, APM back-end monitoring and a business burying-point (event tracking) system into one big-data analysis product, built for engineering teams chasing production faults and business teams performing fine-grained behavioural analysis.
What it is
Webfunny Monitor is a self-hosted monitoring suite in the JavaScript ecosystem. It bundles three sub-systems that are normally bought and operated separately: a front-end monitoring system aimed at technical teams, an APM back-end monitoring system aimed at backend and operations teams, and a burying-point system aimed at business teams. The README states the design goal plainly: full-link observability from the user's browser through backend services down to the database, with the monitoring half serving technology and the tracking half serving business, the two intended to run side by side.
The concrete problem it solves is tool sprawl. Rather than stitching a front-end error tracker, a distributed tracing backend and a product-analytics product together and reconciling three separate notions of who a user is, an operator deploys one stack. Events are captured by a probe snippet injected into the page, so business logic is not modified. The same userId that locates a front-end error therefore also identifies that user in behaviour replay and in the funnel dashboards, which is the gap mixed-tool setups leave open.
Key capabilities
- Front-end error analysis that aggregates and classifies exceptions automatically, resolves them back to original source with SourceMap, and supports assigning an error to a handler.
- Session reconstruction through behaviour replay and screen recording replay, plus remote debugging that connects live to a user's device to read the console,
localStorage and Cookie.
- APM application overview combining P99/P95/P50 response-time trends, request volume, error rate, slow calls and slow SQL on a single screen.
- Distributed tracing alongside a service topology graph that visualises inter-service call relationships and dependencies to identify the blast radius of a failure.
- Slow SQL analysis with 100ms, 200ms and 500ms threshold filters, searchable by service, database and keyword, across multiple database types.
- Visual selection tracking that lets a product manager mark element positions on a live page to create an event point without developer involvement, backed by a shared field and point repository reusable across applications.
- Excel data export and an API for pushing tracked data into downstream systems.
Who uses it and how
- Enterprises at scale: the README reports 200+ enterprise users across internet, finance, education and state-owned sectors, and the underlying stack is optimised for large-traffic scenarios with a cluster version for high availability at 亿级日活 scale.
- Front-end teams triaging production incidents: error aggregation, SourceMap resolution, loading waterfall charts and slow-interface Top10 rankings drive the debugging workflow, with multi-metric alerts delivered by email or Webhook.
- Backend and operations teams: P99/P95/P50 trends, slow SQL filtering and the topology graph target cross-service performance bottlenecks and failing dependency nodes.
- Product and growth teams: funnel and conversion analysis calculates per-step drop-off, alongside retention and heatmap cards, and visual selection tracking removes the developer from the instrumentation loop.
- Multi-platform products: probes cover H5 and PC/Web, WeChat and Alipay mini programs, Flutter, UniApp and Taro, plus HarmonyOS, Android and iOS.
Getting started
Docker one-click deployment is the recommended path, with the README linking to full Docker deployment documentation on webfunny.com; alternatively the system needs only a Node.js environment and the README states deployment completes in around 10 minutes. A free community edition aimed at individuals is available by application.
How it compares
No comparable products are named in the facts supplied, so this project stands alone in this registry and there is no listed alternative to contrast it against on licence, self-hosting, data ownership or cost model. Its own distinguishing claim is the combination of front-end monitoring, APM back-end monitoring and burying-point tracking inside one deployment rather than three.
When to use it — and when not to
A self-hoster must operate a Node.js environment and Docker, and alerting depends on an email or Webhook destination they supply themselves. The README delegates most deployment detail to the webfunny.com documentation rather than the repository, so teams that need everything in-tree should expect to read off-site docs. Confirm edition and terms before adopting: the registry metadata records Apache-2.0, while the README markets a free community edition for individuals and charges for the enterprise edition, private deployment and purchasable source code — and the repository carries 111 open issues at the time of writing.