traceway is a free, open source monitoring & observability project written in Go and released under MIT. It has 1,508 GitHub stars, 67 forks and 22 open issues, and was last pushed 7 days ago. On this registry it ranks #196 of 271 tracked projects in Monitoring & Observability, with 5 head-to-head comparisons available.
What is traceway?
Traceway is an OpenTelemetry-native, MIT-licensed observability platform that combines logs, traces, metrics, session replay, exceptions, AI tracing, and on-call paging in one place, and it is built for engineering teams that want production telemetry without per-language vendor SDKs, a Collector, or glue code.
What it is
Traceway is a single observability platform written in Go and released under the MIT licence. It ingests telemetry over OTLP/HTTP from any OpenTelemetry SDK, then presents it as trace-linked logs, end-to-end span waterfalls, per-route endpoint statistics, host and runtime metrics, normalized exception issues, session replay for web and Flutter, AI conversation analytics, and on-call rotations with escalation policies. Everything ships in the same repository and the same box: the project states there is no BSL and no "open core" edition, so features are not held back behind a commercial tier. It can be self-hosted, or run on Traceway Cloud for teams that would rather not operate the infrastructure.
The problem it solves is the assembly work that normally sits between an application and usable telemetry. In the OpenTelemetry ecosystem, that work usually means running an OpenTelemetry Collector, deploying a separate per-language vendor SDK, and writing glue code to tie logs to traces and traces to alerts. Traceway replaces that Collector-and-vendor-SDK arrangement: an OTLP exporter is pointed at the instance and data arrives, with logs linked to spans and exceptions resolved to original source locations on arrival.
Key capabilities
Native OTLP/HTTP ingest from any OpenTelemetry SDK for structured, trace-linked logs with sub-second search.
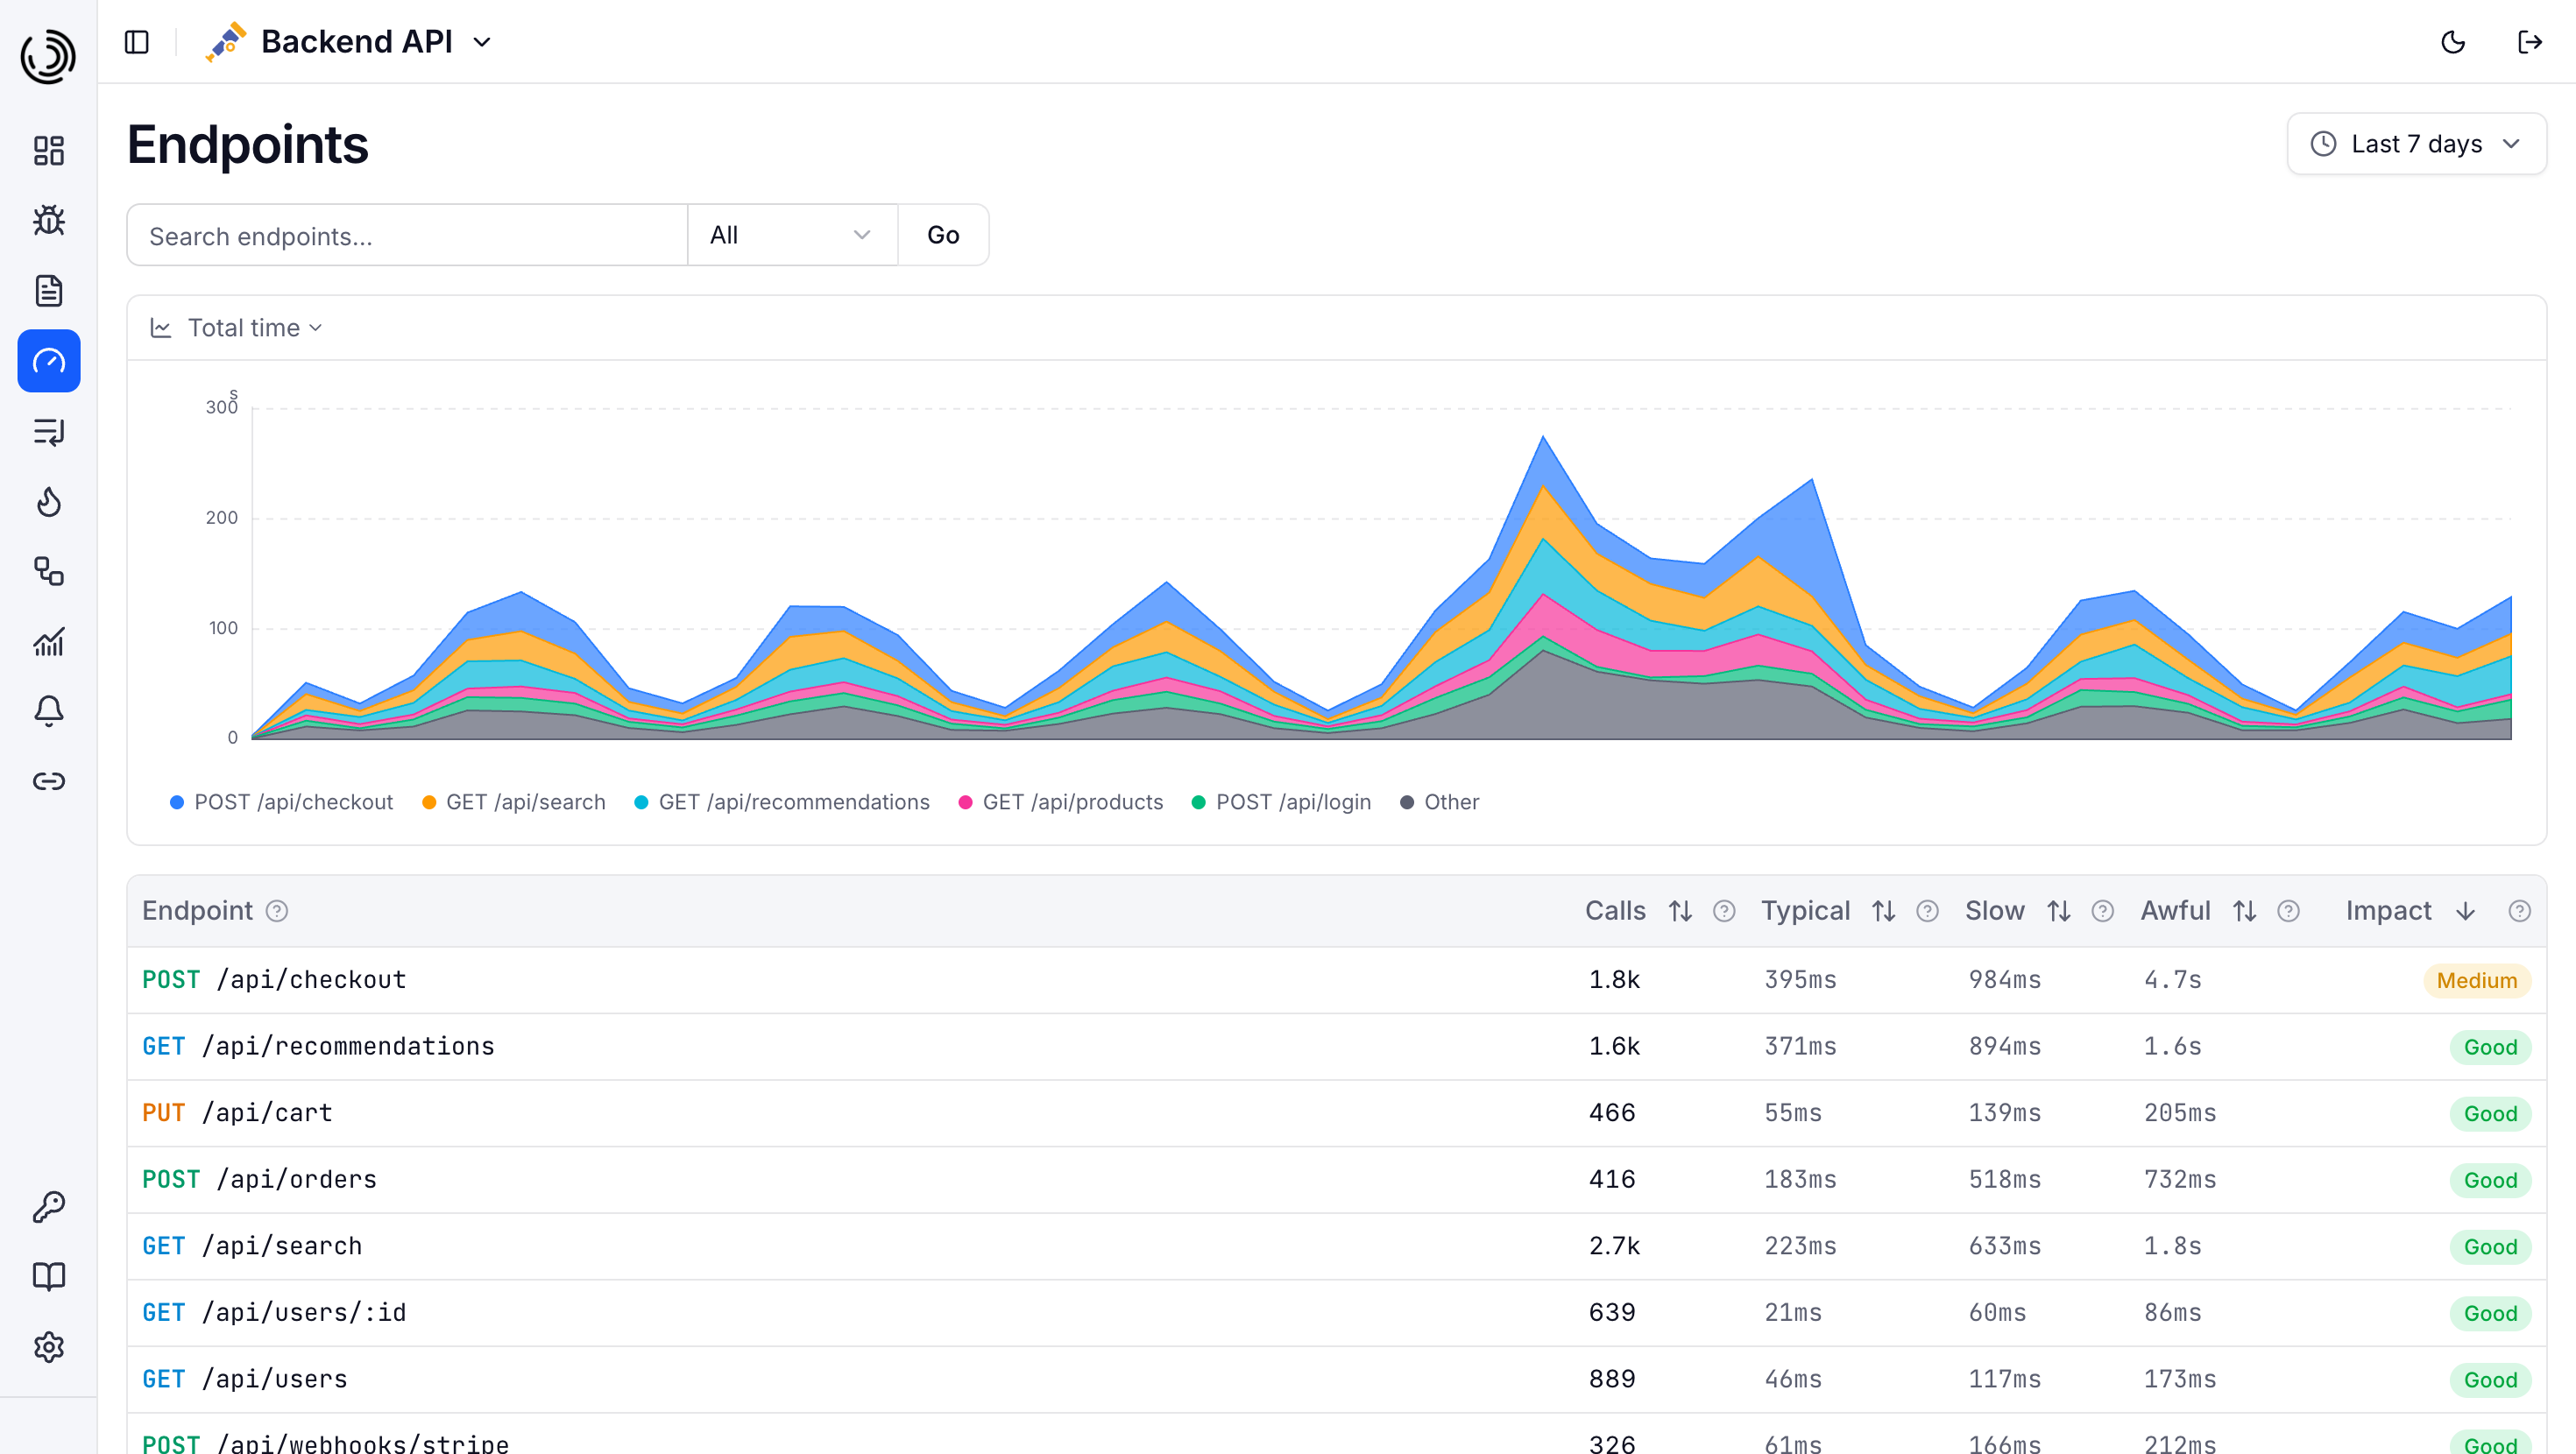
Endpoint analytics with P50/P95/P99 latency percentiles, throughput, and error rate, ranked by Apdex and a five-factor impact score.
Exception grouping that normalizes stack traces, assigns each a SHA-256 fingerprint, and source-maps minified output from webpack, esbuild, and Vite.
Profiling (marked experimental) with flame graphs for CPU, heap, and goroutines, version-to-version diffing, and ingest of native Go pprof and OTLP profiles.
AI observability for LLM cost, tokens, and latency across providers such as OpenRouter and any OTel-compatible gateway, grouping calls into conversations by gen_ai.conversation.id and keying per-customer analytics on user.id.
On-call paging with layered rotation schedules, overrides, escalation policies, and one-click acknowledge links delivered over email, Slack, Pushover, Telegram, or SMS.
Fleet Overview, one organization-wide page above every project showing live CPU, memory, disk, and network per instance, with Kubernetes nodes grouped by cluster and whole-cluster instrumentation through a single kubectl apply.
Who uses it and how
Platform and infrastructure teams running Kubernetes, where one kubectl apply instruments an entire cluster and node health appears grouped by cluster in Fleet Overview.
Multi-tenant organizations that need role-based access separated per org, with monitors, issues, and open pages aggregated above individual projects.
On-call teams that need pages to escalate until acknowledged, using email, Slack, Pushover, Telegram, or SMS plus login-free acknowledge links.
Frontend and mobile teams that need session replay for any JS framework or Flutter, so the interaction immediately preceding an error is visible alongside the stack trace.
AI and agent workflows: npx skills add tracewayapp/traceway installs /traceway-setup and /traceway into Claude Code, Cursor, Codex, or any agent reading SKILL.md, and the traceway CLI queries exceptions, logs, endpoints, and metrics with JSON when piped and tables on a TTY.
Getting started
The README describes self-hosting in 90 seconds: point an OTLP exporter at the instance and the platform is in business, or use the hosted Traceway Cloud option at cloud.tracewayapp.com. For agent-driven setup, run npx skills add tracewayapp/traceway, or install the traceway CLI, which is read-only apart from archiving exceptions and requires an explicit --yes for that action.
How it compares
The facts provided do not name any paid products this project replaces, and no comparable tools are named in the topic list or README. Traceway stands alone in this registry on the evidence given.
When to use it — and when not to
Adopt it if a team wants OpenTelemetry-native logs, traces, metrics, exception tracking, and paging behind one OTLP endpoint under a permissive MIT licence. The honest caveats are that profiling is explicitly experimental, the README excerpt cuts off mid-sentence in its symbolication section, and the provided facts name no required database, object storage, or SMTP infrastructure, so the operational footprint of a self-hosted deployment cannot be assessed from this material alone. Teams that need managed support commitments or have already standardized on a commercial vendor's agents rather than OTLP should look elsewhere.
project readme (upstream, from github) — read inline
Built on OpenTelemetry
OpenTelemetry-native observability. Open source. Self-hosted in 90 seconds.
Traceway is an OpenTelemetry-native observability platform. It combines logs, traces, metrics, session replay/RUM, exceptions, AI tracing, and on-call paging in one place. Point an OTLP exporter at it and you're in business. No Collector, no glue code, no per-language vendor SDK.
MIT licensed. No BSL. No "open core." Every feature is in the box. Self-host it for free, or run it on Traceway Cloud if you'd rather not babysit infra.
Logs: Structured, trace-linked, sub-second search. Native OTLP/HTTP ingest from any OTel SDK.
Traces: End-to-end span waterfalls across every service. Click a log, jump to its span.
Endpoints: Per-route latency percentiles (P50/P95/P99), throughput, and error rate, ranked by Apdex and a 5-factor impact score.
Metrics: Host, runtime, and custom metrics. Any dimension, any chart, with custom widget groups.
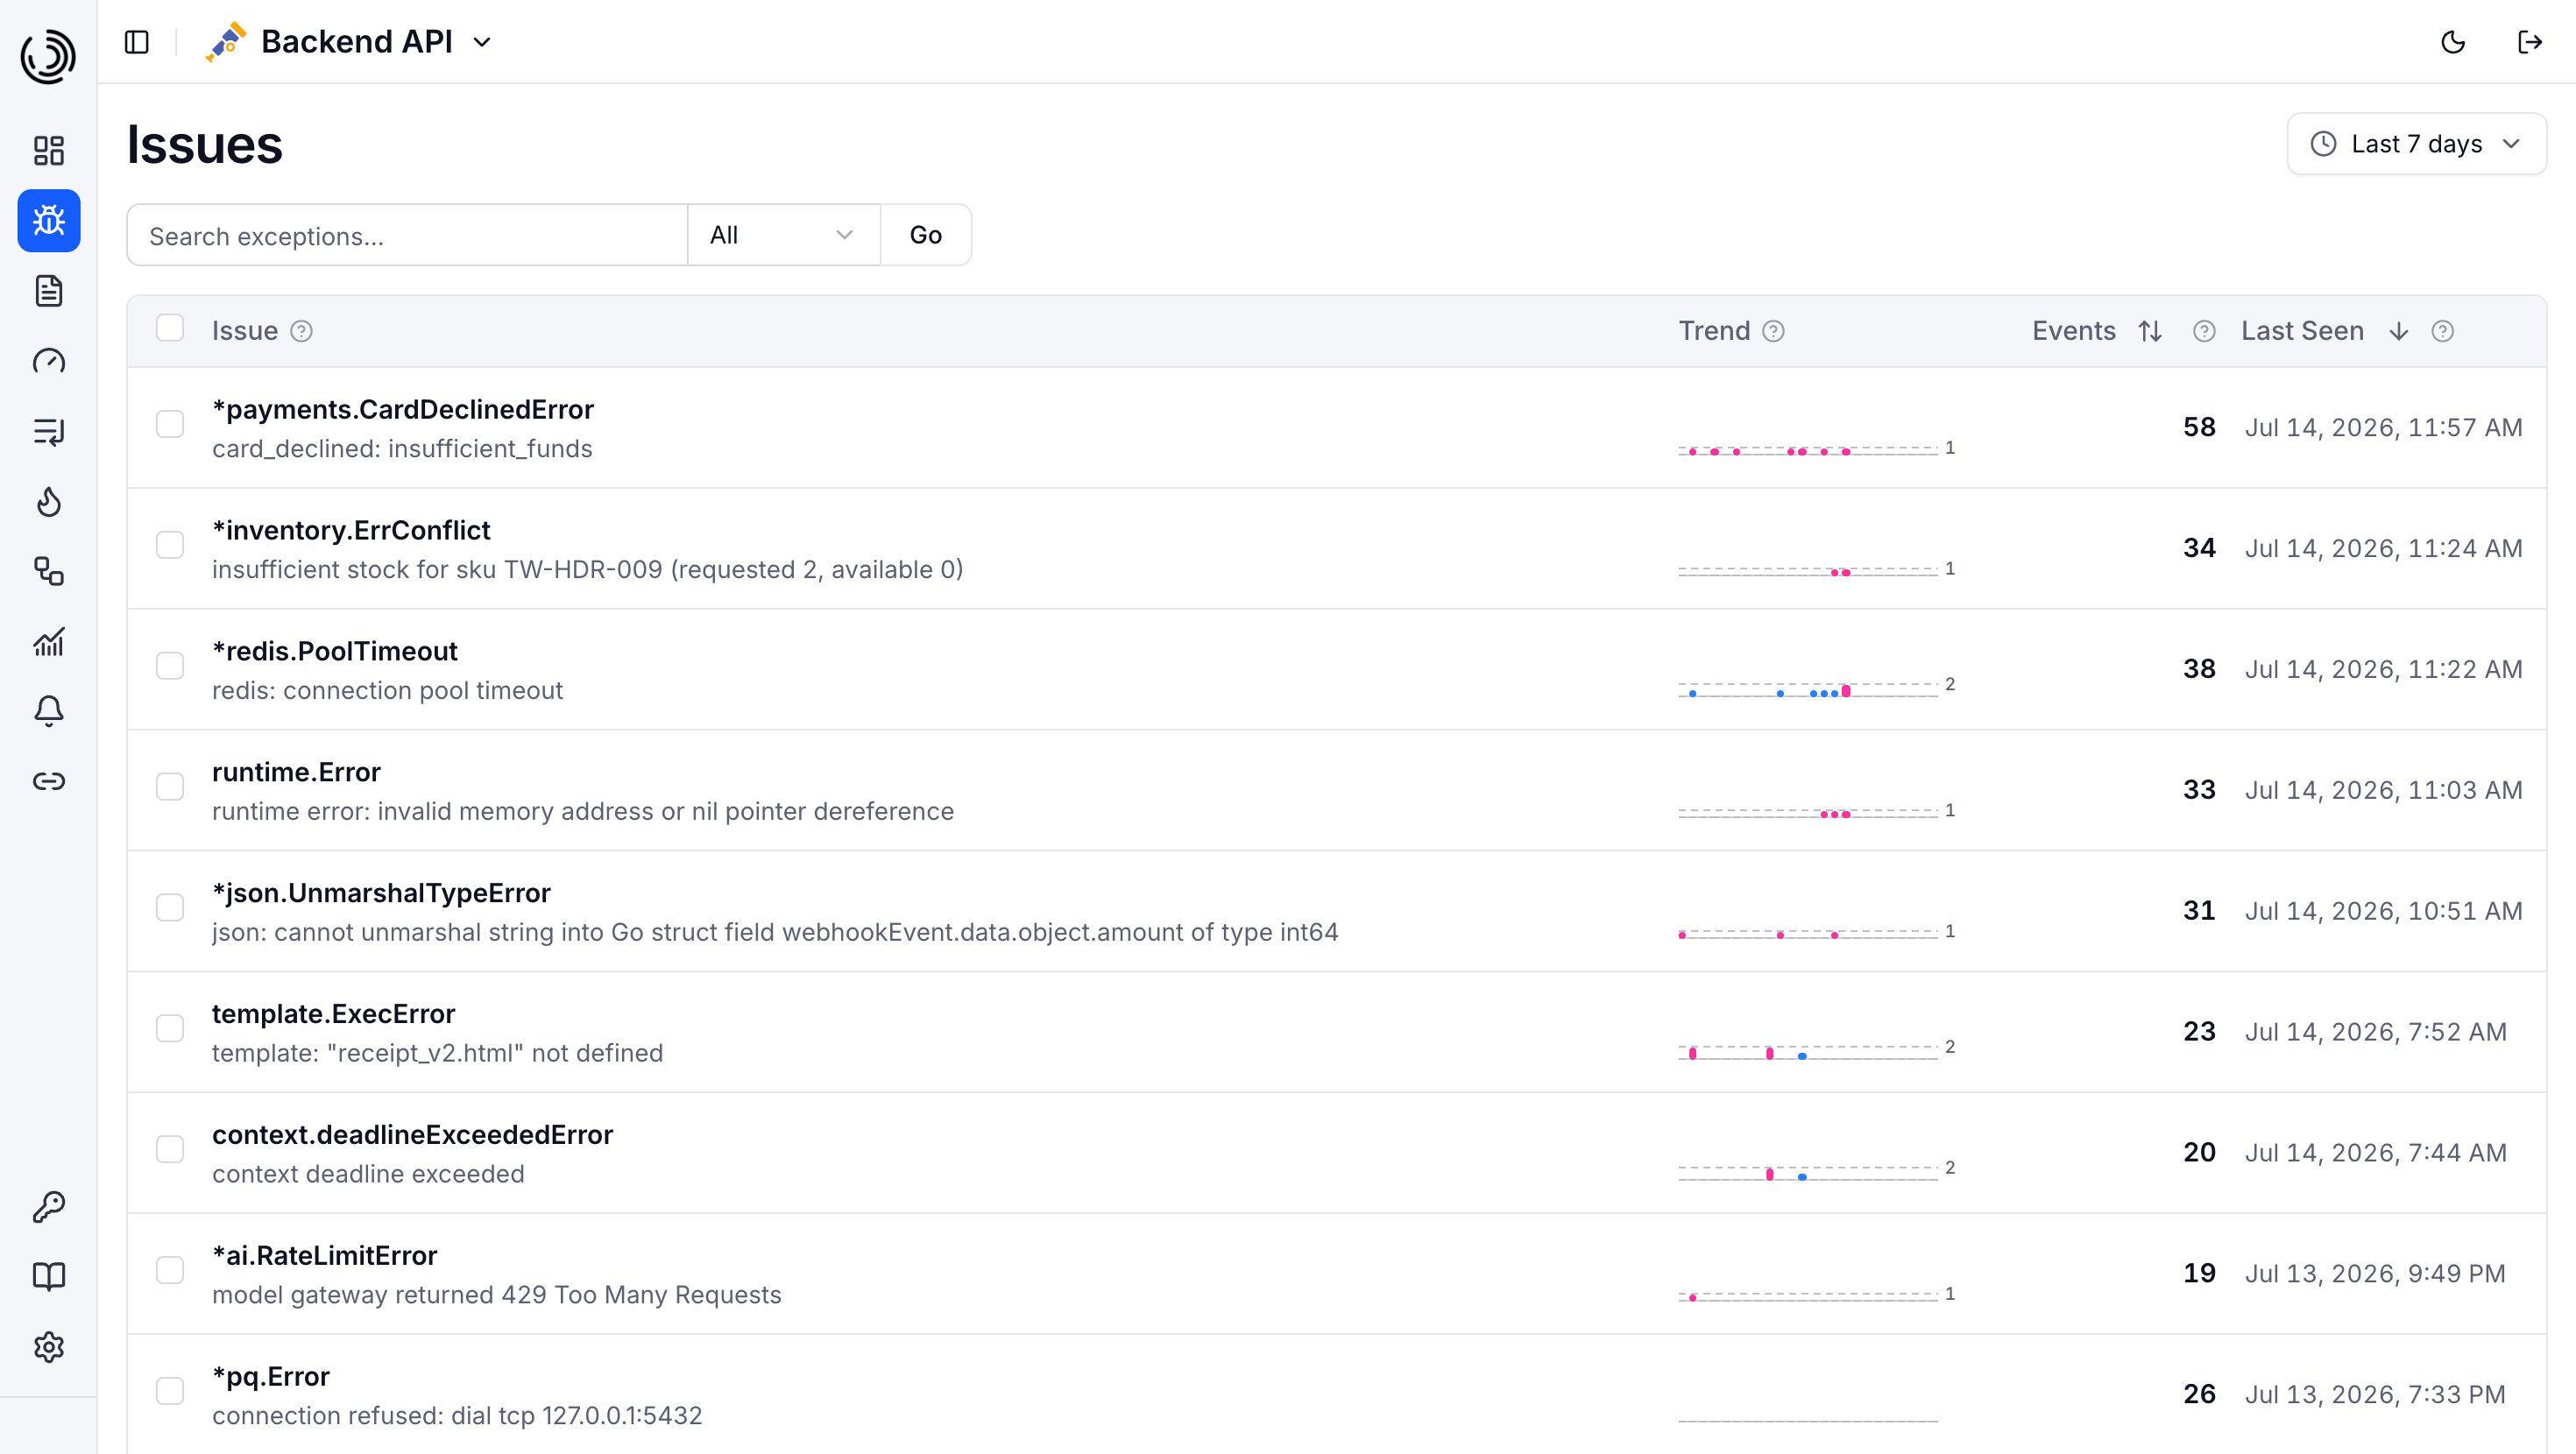
Exceptions: Stack traces are normalized, given a SHA-256 fingerprint, and grouped into ranked issues. Source-mapped (webpack, esbuild, Vite).
Profiling(experimental): Flame graphs for CPU, heap, and goroutines with version-to-version diffing and a top-functions table. Ingests native Go pprof and OTLP profiles.
Session Replay: Watch what the user did right before the error. Available for web (any JS framework) and Flutter.
AI Observability: LLM cost, tokens, latency, and full conversations across providers (OpenRouter and any OTel-compatible AI gateway). Calls group into conversations via gen_ai.conversation.id, tool calls are parsed from completions and rendered in the chat view, and multi-language content flagging catches conversations containing terms you care about. Per-customer analytics (conversation length, cost per conversation) key on user.id: set it to a stable customer identifier such as your account or tenant id, the same value across all of that user's conversations, never a session id.
On-Call & Paging: Rotation schedules with layers and overrides, escalation policies, and pages that escalate until someone acknowledges. Delivered via email, Slack, Pushover, Telegram, or SMS, with one-click acknowledge links that need no login.
Fleet Overview: One organization-wide page above every project: each reporting instance with live CPU, memory, disk and network, plus issues, monitors and open pages across all projects. Kubernetes nodes group by cluster, and a single kubectl apply instruments a whole cluster.
Plus: background-task (job) monitoring, configurable alerts (Slack / GitHub / email / webhook / Pushover / Telegram), multi-tenant orgs with role-based access, and a per-endpoint slow-threshold override.
AI-First
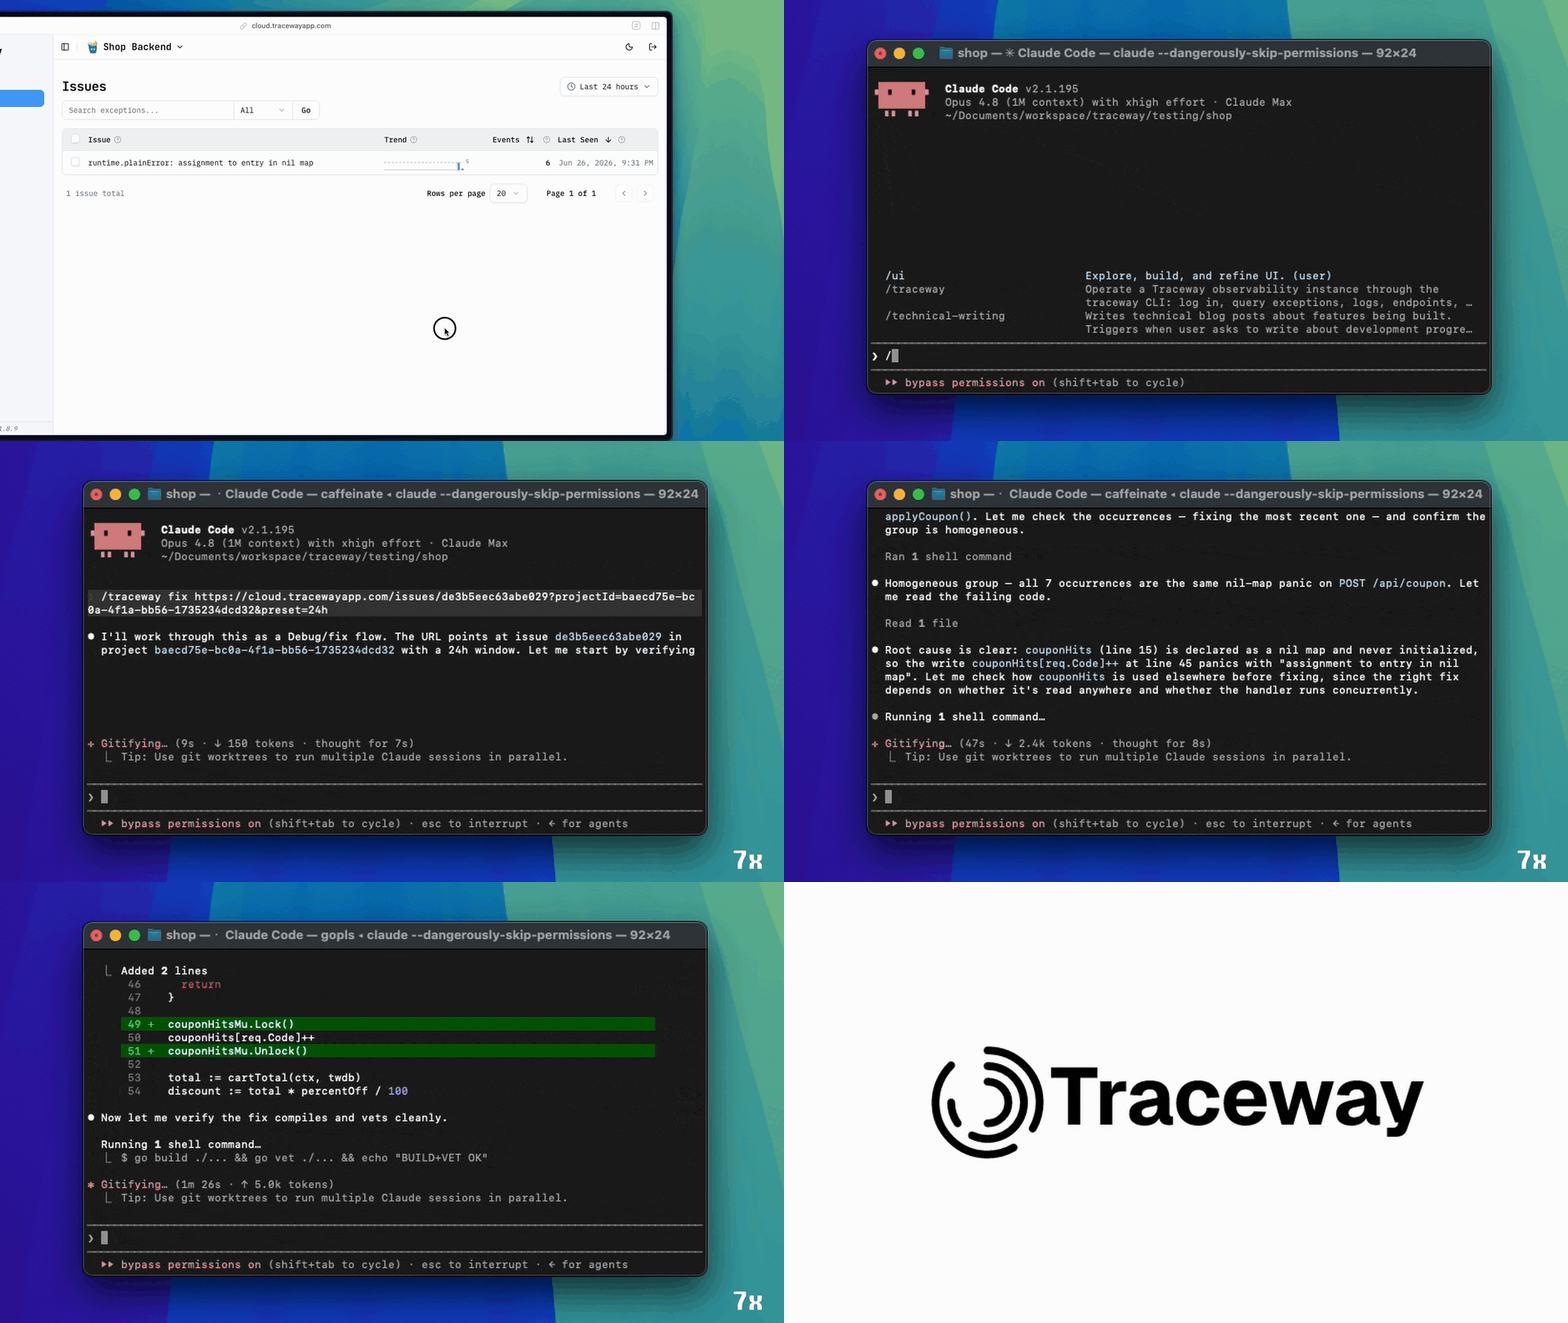
Your agent sets up Traceway, queries production telemetry, and finds the root cause:
npx skills add tracewayapp/traceway
One command installs two skills into Claude Code, Cursor, Codex, or any agent that reads SKILL.md:
/traceway-setup reads your repo and wires it up: OTel for backends, Traceway SDKs for web and mobile. Then it verifies data actually arrives.
/traceway installs the traceway CLI and uses it to query exceptions, logs, endpoints, and metrics, from bug report to root cause.
The CLI is designed for agents first: JSON when piped, tables on a TTY, stable error identifiers and exit codes, --fields to trim responses. It's read-only apart from archiving exceptions, which needs an explicit --yes. Nothing hangs, nothing gets damaged.
The skills are plain Markdown in skills/, in the same MIT-licensed repo. No marketplace, no lock-in. Learn more →
Symbolication
app.min.js:1:63 tells you nothing. Traceway resolves minified production errors back to the original file, line, and function the moment they arrive. The same engine handles stripped and obfuscated mobile crashes: iOS and Swift against the build's dSYM, Android against its R8 mapping.txt, Dart and Flutter against their obfuscation map.
The symbolicator is pure Go and built to keep up with ingest. Every debug artifact (a source map, a dSYM, an R8 mapping) compiles once into a binary .tw file and is memory-mapped from disk. Opening a compiled map takes under a microsecond, p99 lookup stays under a millisecond on a cold cache, and no map is re-parsed after a restart. The corpus is a disk budget, not a RAM budget.
The same engine ships as a standalone OpenTelemetry Collector processor, drop-in compatible with Honeycomb's source_map_symbolicator: same component type, same attribute contract, same config keys. Use it in your own pipeline, with or without Traceway behind it.
Upload source maps from CI with npx traceway-sourcemaps --directory ./dist; dSYMs and R8 mappings post to the same endpoint. Benchmarks live in benchmarks/; run them on your fork. Learn more →
Why Traceway
Enterprise (Datadog / New Relic)
DIY OSS stack (Prometheus + Loki + Tempo + ...)
Traceway
Pricing
Per-event, per-host, per-seat
Free + ops time
Self-host free, fixed cloud tiers
Setup
Vendor SDK per language
Glue 6 tools together
docker compose up -d
License
Proprietary
Mixed (some BSL / open-core)
MIT, no asterisks
OTel
Wrapped in vendor SDK
OTel Collector required
Native OTLP/HTTP ingest
Replay + traces + AI
3 separate products
Wire it yourself
One system, one trace ID
Quick Start
Self-host with Docker (recommended)
git clone https://github.com/tracewayapp/traceway
cd traceway && docker compose up -d
# ✓ dashboard at http://localhost
Point any OTel SDK at http://localhost/api/otel/v1/traces (or /metrics, /logs) and traces start flowing. See the self-hosting docs for production deployment, TLS, and storage configuration.
Prefer a single container with no external databases? The SQLite image is the smallest deployment. The DuckDB image keeps the same zero-dependency setup but adds a columnar telemetry store for far more dashboard
traceway is open source under the MIT licence. There is no licence fee and no seat count — you can self-host it or, where the project offers one, pay a vendor for a managed version instead.
What does traceway do?
The only tool you need to know what is happening and how to fix it.
What is traceway written in?
traceway is primarily written in Go. Its source is publicly available at https://github.com/tracewayapp/traceway, and it has 1,508 GitHub stars.

 OpenTelemetry