The Stress Terminal UI: s-tui


Stress-Terminal UI, s-tui, monitors CPU temperature, frequency, power and utilization in a graphical way from the terminal.
Screenshot
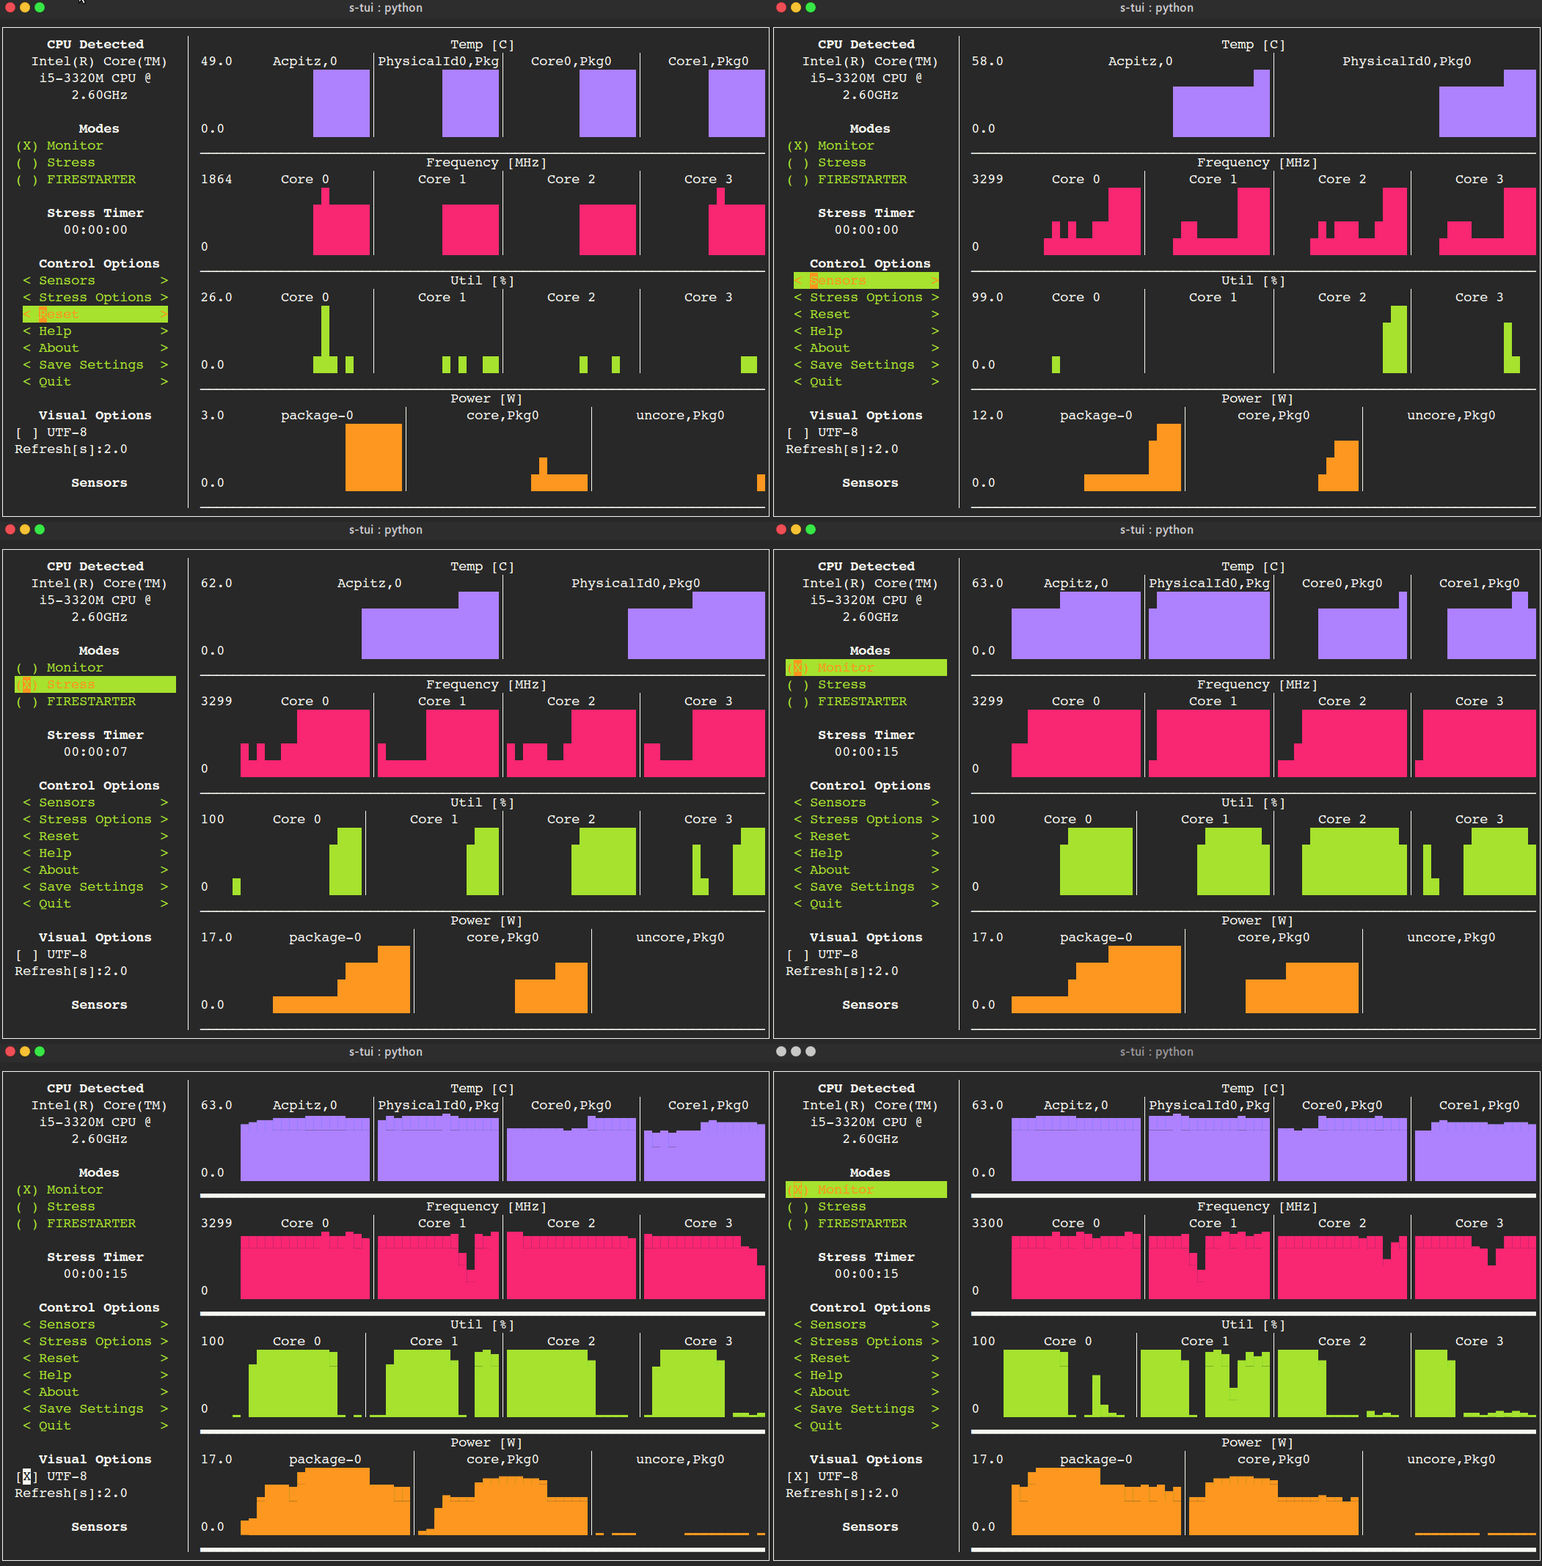
Table of Contents
- The Stress Terminal UI: s-tui
What it does
- Monitoring your CPU temperature/utilization/frequency/power
- Shows performance dips caused by thermal throttling
- Requires no X-server
- Built-in CPU stress test (zero dependencies, works out of the box)
- Optional integration with external stress tools (stress/stress-ng)
Usage
s-tui
Simple installation
pip (x86 + ARM)
The most up to date version of s-tui is available with pip.
Install with:
pip install s-tui --user
(This usually creates an executable in ~/.local/bin/ dir. Make sure it is in your PATH)
To install as root
sudo pip install s-tui
You might need to install python-dev first
Installation in virtualenv with pipsi:
pipsi install s-tui
More installation methods
Ubuntu (18.10 and newer)
sudo apt install s-tui
Ubuntu (18.04, 16.04)
A PPA is available but is not up to date
sudo add-apt-repository ppa:amanusk/python-s-tui
sudo apt-get update
sudo apt-get install python3-s-tui
Debian (10 and newer)
sudo apt install s-tui
Arch Linux, Manjaro
s-tui is in the Arch repository:
sudo pacman -S s-tui
s-tui-git follows the master branch, maintained by @MauroMombelli
Install it with:
yay -S s-tui-git
OpenSUSE
sudo zypper install s-tui
Fedora
s-tui is in the Fedora repository:
sudo dnf install s-tui
Options
TUI interface:

The side bar houses the controls for the displayed graphs.
At the bottom, all sensors reading are presented in text form.

* Use the arrow keys or 'hjkl' to navigate the side bar
* Toggle between stressed and regular operation using the radio buttons in 'Modes'.
* If you wish to alternate stress defaults, you can do it in <Stress options>
* Select graphs to display in the <Graphs> menu
* Select summaries to display in the <Summaries> menu
* Use the <Reset> button to reset graphs and statistics
* If your system supports it, you can use the UTF-8 button to get a smoother graph
* Save your current configuration with the <Save Settings> button
* Press 'q' or the <Quit> button to quit

* Run `s-tui --help` to get this message and additional cli options

optional arguments:
  -h, --help            show this help message and exit
  -d, --debug           Output debug log to _s-tui.log
  --debug-file DEBUG_FILE
                        Use a custom debug file. Default: _s-tui.log
  -dr, --debug_run      Run for 5 seconds and quit
  -c, --csv             Save stats to csv file
  --csv-file CSV_FILE   Use a custom CSV file. Default: s-tui_log_<TIME>.csv
  -t, --terminal        Display a single line of stats without tui
  -j, --json            Display a single line of stats in JSON format
  -nm, --no-mouse       Disable Mouse for TTY systems
  -v, --version         Display version
  -tt T_THRESH, --t_thresh T_THRESH
                        High Temperature threshold. Default: 80
Throttle Indicators
When CPU throttling is detected, s-tui changes the frequency graph and summary text color and appends a reason label. Labels may be combined with / (e.g. T/W).
Intel, with root + msr module (detailed per-core reasons via IA32_THERM_STATUS):
| Label | Meaning |
|---|---|
T |
Thermal — core temperature exceeded TjMax |
H |
PROCHOT — external thermal signal (VRM, GPU, battery) |
C |
Critical — near emergency shutdown temperature |
W |
Power limit — PL1/PL2 watt budget exceeded |
A |
Current limit — electrical current (amps) limit hit |
X |
Cross-domain — throttled by another domain (e.g. GPU) |
AMD, with root + msr module (per-core P-state cap via PStateCurLim):
| Label | Meaning |
|---|---|
Pc |
P-state cap — the SMU has barred the core from its top P-state |
AMD exposes no equivalent of Intel's reason breakdown through MSRs. The
thermal/power/current limits themselves (PPT, TDC, EDC, THM, STAPM) live in the
SMU power-management table, which needs an out-of-tree kernel module to reach,
so PStateCurLim is what remains: it indicates that a cap is in force, not why.
It behaves as a severity threshold rather than a reason code — the same chip
pinned at the same temperature was observed showing Pc under a load heavy
enough to drive it below its rated base clock, and nothing under a lighter one.
Expect it to stay clear on a well-cooled part that is boost-limited but never
forced that far down.
Without root (sysfs fallback, thermal only):
| Label | Meaning |
|---|---|
Tc |
Core thermal throttle |
Tp |
Package thermal throttle (affects all cores) |
When a temperature sensor exceeds the high value defined by the sensor, or a user configured threshold (default 80°C), the sensor summary text summary and associated graph will change color to indicate this.
Dependencies
s-tui includes a built-in CPU stress test that works out of the box with no extra dependencies. For better stress performance, install numpy:
pip install s-tui[stress]
or install numpy directly:
pip install numpy
When numpy is available, the built-in stresser uses repeated dense matrix multiplication (BLAS) for maximum thermal output. Without numpy, it falls back to hashlib SHA-256 hashing which still provides good CPU load.
For additional stress options (memory, I/O, sync workers), you can optionally install the external stress or stress-ng tool:
sudo apt-get install stress
Configuration
s-tui is a self-contained application that can run out-of-the-box and doesn't need config files to drive its core features. However, additional features like running scripts when a certain threshold has been exceeded (e.g. CPU temperature) does necessitate creating a config directory. This directory will be made in ~/.config/s-tui by default.
Saving a configuration
Selecting \ will save the current configuration to ~/.config/s-tui/s-tui.conf. If you would like to restore defaults, simply remove the file.
Adding threshold scripts
s-tui gives you the ability to run arbitrary shell scripts when a certain threshold is surpassed, like your CPU temperature. You can define this custom behaviour by adding a shell file to the directory ~/.config/s-tui/hooks.d with one of the following names, depending on what threshold you're interested in reacting to:
tempsource.sh: triggered when the CPU temperature threshold is exceeded
If s-tui finds a script in the hooks directory with the name of a source it supports, it will run that script every 30 seconds as long as the current value of the source remains above the threshold.
Note that at the moment only CPU temperature threshold hooks are supported.
Run from source code
Start by cloning the repository
git clone https://github.com/amanusk/s-tui.git
cd s-tui
Install required dependencies as [root] or as (local user)
[sudo] pip install urwid (--user)
[sudo] pip install psutil (--user)
Install stress (op