


pyroscope is a free, open source monitoring & observability project written in Go and released under AGPL-3.0. It has 11,661 GitHub stars, 802 forks and 400 open issues, and was last pushed 5 hours ago. On this registry it ranks #37 of 97 tracked projects in Monitoring & Observability, with 5 head-to-head comparisons available. It gained 3 stars over the last 3 tracked days.

What is pyroscope?

Grafana Pyroscope is a continuous profiling platform for developers, SREs, and platform teams who need to find CPU, memory, and I/O bottlenecks in running applications and trace them down to a single line of code.

What it is

Grafana Pyroscope is a continuous profiling platform that collects profiling data from applications and makes it queryable for performance analysis. It consists of three main parts: the Pyroscope Server, which stores and processes profiling data and serves queries; clients and instrumentation, which ship profiles from running code; and Grafana Profiles Drilldown, a queryless UI formerly called Explore Profiles, for visualizing and analysing the data. The project is written in Go and lives in the Grafana observability ecosystem, with collection paths for Pyroscope SDKs, Grafana Alloy, and OTLP from OpenTelemetry-compatible sources.

The concrete problem is operational visibility. Teams need both proactive work, such as reducing resource consumption, improving application performance, or preventing latency issues, and reactive work, such as resolving incidents with line-level detail while debugging active CPU, memory, or I/O bottlenecks. Pyroscope 2.0 makes the v2 architecture the default and replaces the v1 design of in-memory ingesters and local disks: profiles are written directly to object storage, which simplifies operations and lowers resource usage at scale.

Key capabilities

  • Collects profiles three ways: Pyroscope SDKs push data, Grafana Alloy pulls or pushes it, and OTLP carries profiles from OpenTelemetry-compatible sources such as the OpenTelemetry eBPF profiler.
  • Stores and queries profiles in the Pyroscope Server, which handles storage, processing, and query serving.
  • Writes profiles straight to object storage on the v2 write path, routing by service with no ingesters and no local disk.
  • Runs compaction-workers that merge small segments into larger blocks in the background.
  • Fans read-path queries across object storage to build flame graphs in Grafana.
  • Presents Grafana Profiles Drilldown, a queryless UI, for visualizing and analysing profiling data.
  • Ships as the Docker image grafana/pyroscope and the Go module github.com/grafana/pyroscope/v2.

Who uses it and how

  • SRE and on-call teams use it reactively to resolve incidents with line-level detail and to debug active CPU, memory, or I/O bottlenecks.
  • Performance and platform engineers use it proactively to cut resource consumption, improve application performance, and prevent latency issues.
  • Teams already running Grafana use Profiles Drilldown to view flame graphs built from object storage and to drill into specific services for root cause analysis.
  • Go and Linux service owners, given the project's stated language and topic focus, instrument services through the SDKs or pull profiles with Grafana Alloy.
  • Existing v1 operators opt in to the v2 architecture with a flag and migrate without data loss.

Getting started

Deploy the Pyroscope Server from the Docker image grafana/pyroscope, or use the Go module github.com/grafana/pyroscope/v2 when embedding it in Go code. Client configuration and the migration from v1 to v2 are documented at grafana.com/docs/pyroscope.

How it compares

No competing continuous profiling product is named in the facts, so Pyroscope stands alone in this registry on that axis. Its stated integrations place it inside the Grafana stack, next to Grafana Alloy for collection and Grafana Profiles Drilldown for analysis, rather than beside a named alternative.

When to use it — and when not to

Self-hosting means operating the Pyroscope Server alongside object storage, because the v2 architecture writes profiles directly there, and it means running compaction-workers to merge segments in the background. Teams that cannot adopt the AGPL-3.0 licence, or that want a managed service rather than a self-operated system, should not pick it. The repository carries 400 open issues, so operators should expect an active but non-trivial queue, and v1 users must plan the flag-gated migration instead of assuming a drop-in upgrade.

project readme (upstream, from github) — read inline

Pyroscope

ci Go Report License: AGPLv3 FOSSA Status Latest release DockerHub Go Reference

🎉 Announcement: Pyroscope 2.0 is here!

Pyroscope 2.0 makes the new v2 architecture the default. Profiles are written directly to object storage, removing the need for in-memory ingesters and local disks - simplifying operations and lowering resource usage at scale. Existing v1 deployments can opt in via a flag and migrate without data loss.

Read the 2.0 release notes and the v2 architecture overview. Upgrading from v1? See the migration guide.

Want the full story? Watch the GrafanaCON 2026 talk Pyroscope 2.0: Continuous Profiling Architecture Deep Dive.

What is Grafana Pyroscope?

Grafana Pyroscope is a continuous profiling platform designed to surface performance insights from your applications, helping you optimize resource usage such as CPU, memory, and I/O operations. With Pyroscope, you can both proactively and reactively address performance bottlenecks across your system.

The typical use cases are:

  • Proactive: Reducing resource consumption, improving application performance, or preventing latency issues.
  • Reactive: Quickly resolving incidents with line-level detail and debugging active CPU, memory, or I/O bottlenecks.

Pyroscope provides powerful tools to give you a comprehensive view of your application's behavior while allowing you to drill down into specific services for more targeted root cause analysis.

How Does Pyroscope Work?

deployment_diagram

Pyroscope consists of three main components:

  • Pyroscope Server: Stores and processes profiling data and serves queries.
  • Clients and instrumentation: Profiling data reaches the server in several ways: the Pyroscope SDKs (push), Grafana Alloy (pull or push), or OTLP from OpenTelemetry-compatible sources such as the OpenTelemetry eBPF profiler.
  • Grafana Profiles Drilldown: A queryless, intuitive UI for visualizing and analyzing profiling data (formerly Explore Profiles).

Under the hood, Pyroscope v2 writes profiles straight to object storage—no ingesters, no local disk. The animations below trace the three parts of the architecture. For the details behind each component, see the v2 architecture documentation.

Write path — profiles are routed by service and written straight to object storage:
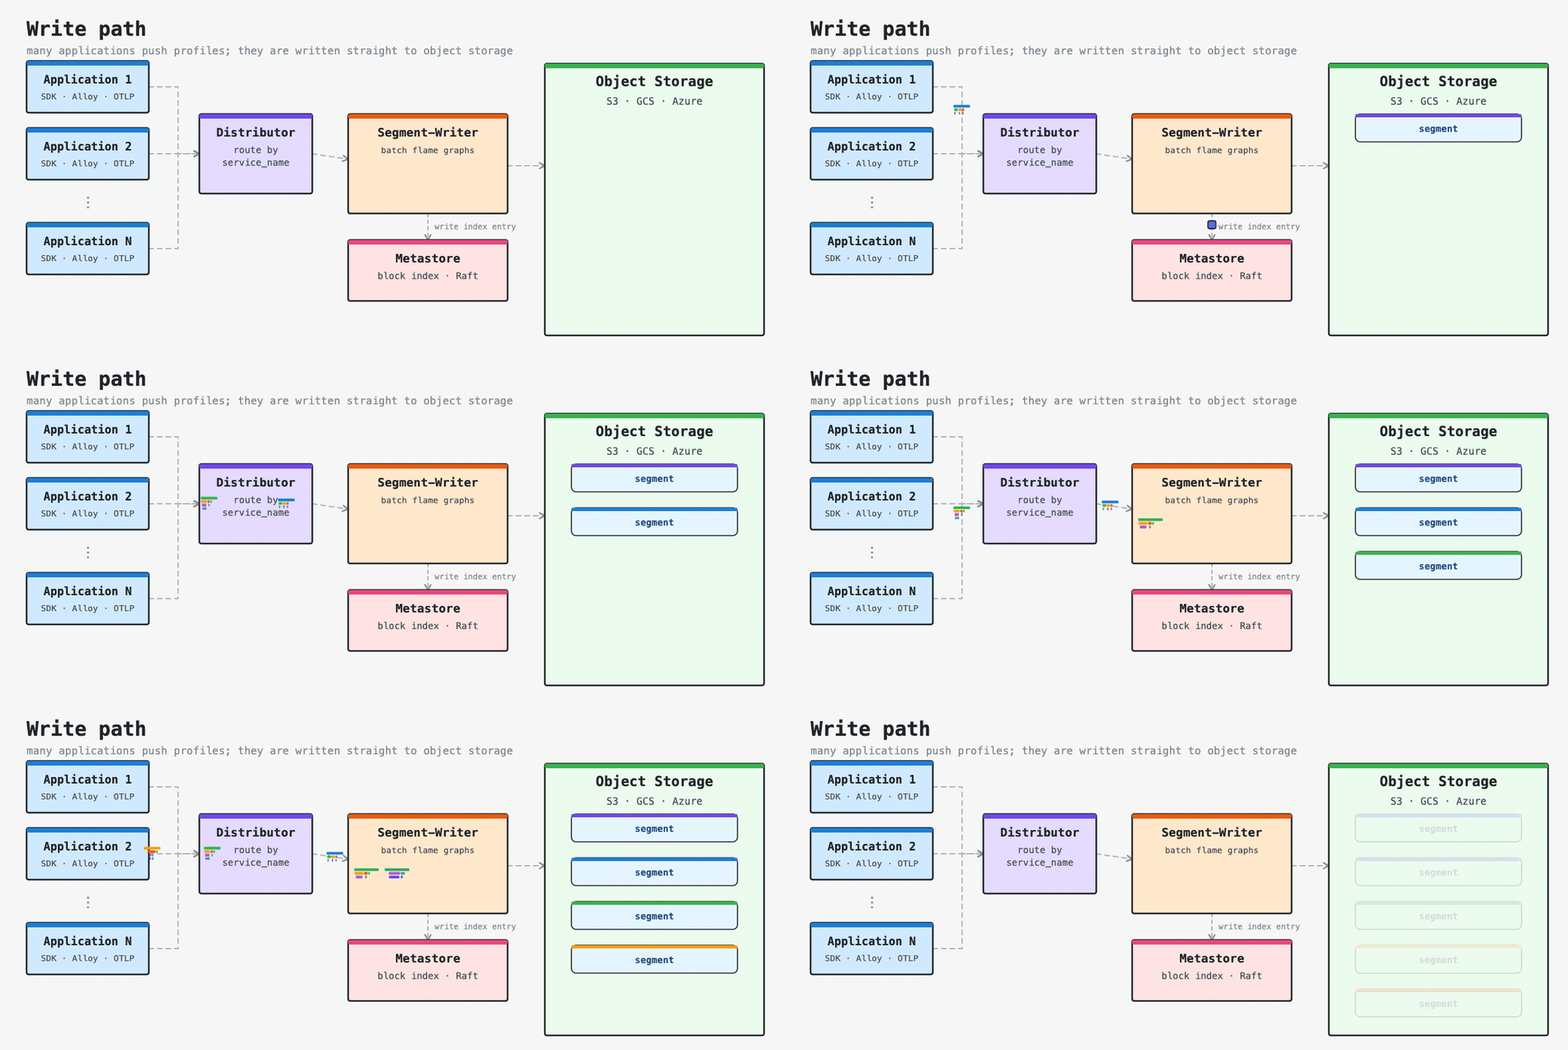
Pyroscope v2 write path

Compaction — compaction-workers merge small segments into larger blocks in the background:
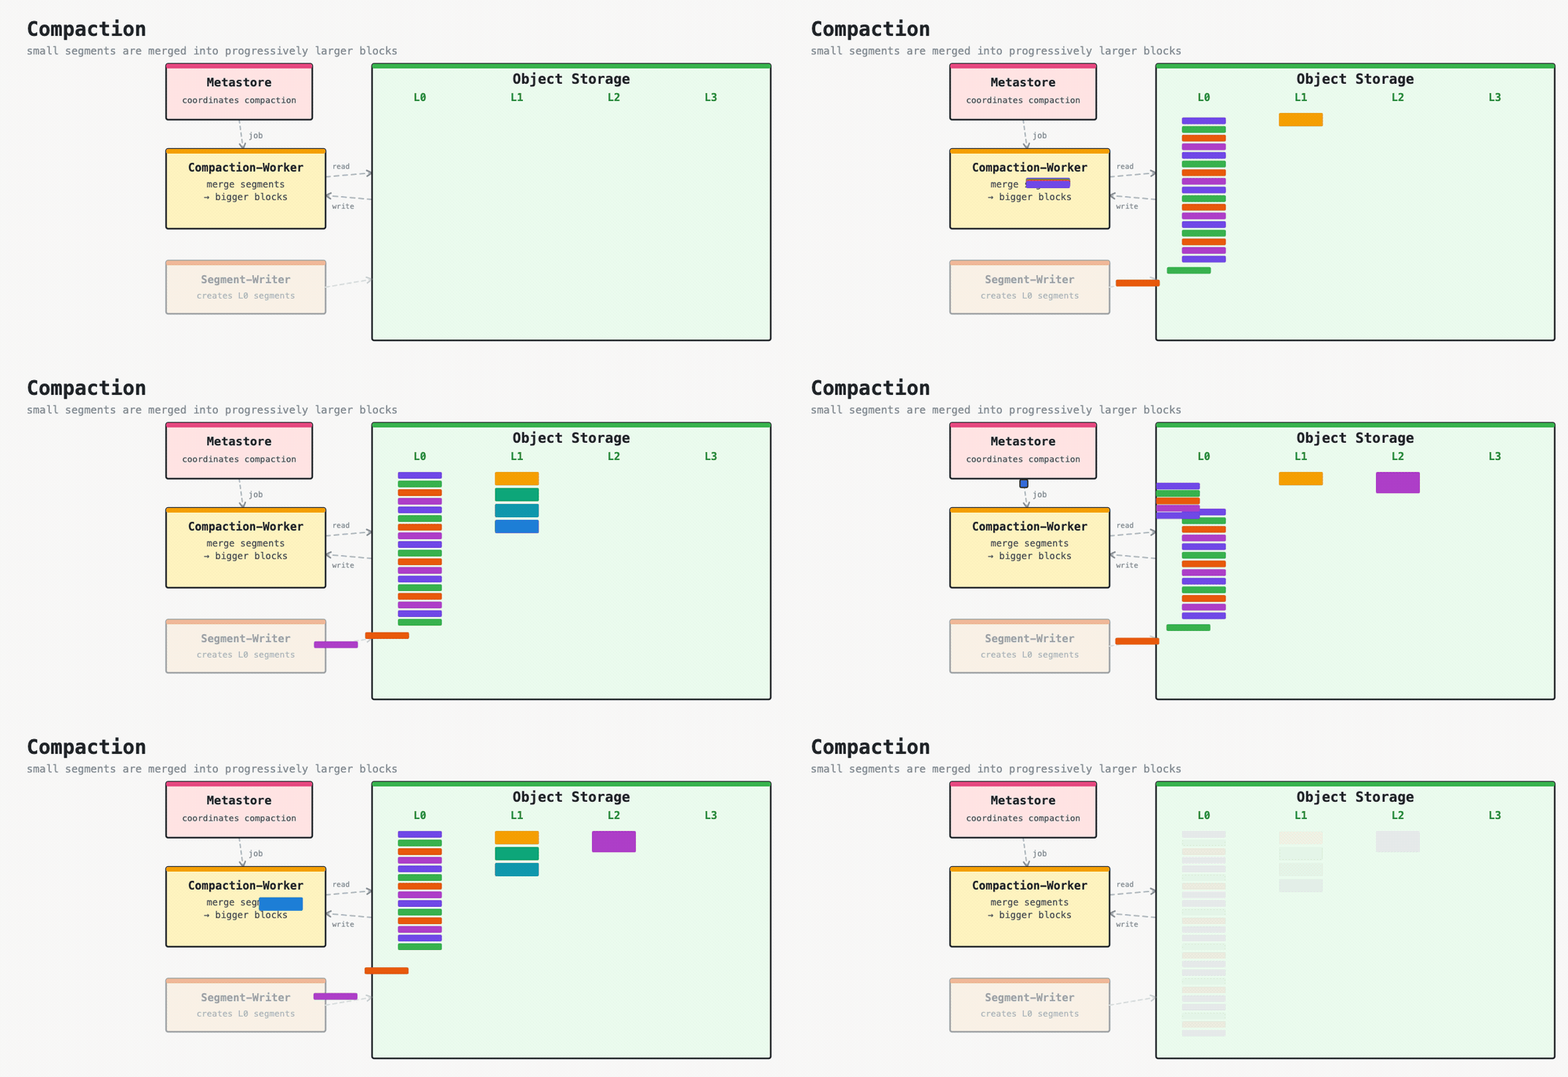
Pyroscope v2 compaction

Read path — queries fan out across object storage to build flame graphs in Grafana Profiles Drilldown:
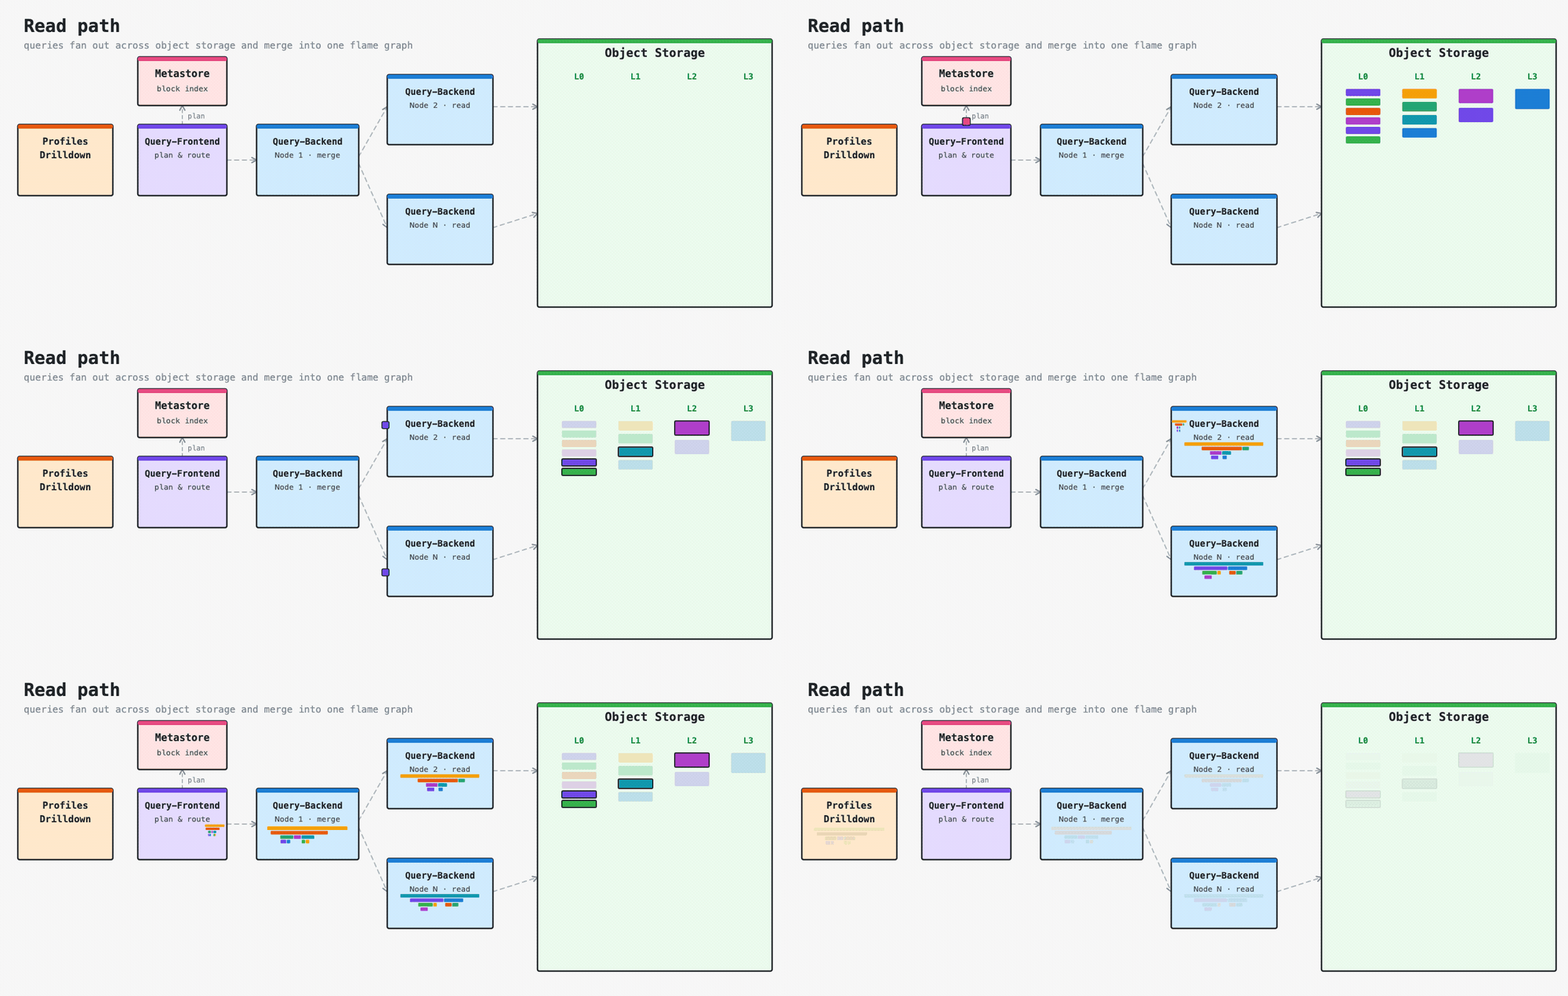
Pyroscope v2 read path


Pyroscope Live Demo

Pyroscope GIF Demo


Quick Start: Run the Pyroscope server locally

Docker

docker run -it -p 4040:4040 grafana/pyroscope

Homebrew (macOS / Linux)

brew install pyroscope-io/brew/pyroscope
brew services start pyroscope

Binary

Download the archive for your operating system and architecture from the latest release, unpack it, and run the binary:

tar xvf pyroscope_*.tar.gz
./pyroscope

Pyroscope listens on port 4040. For Kubernetes/Helm, Linux packages, building from source, and full configuration options, see the Get started guide and the server documentation.

Quick Start: Visualize profiles with Grafana Profiles Drilldown

image

Grafana Profiles Drilldown (formerly Explore Profiles) is the primary, queryless way to visualize and analyze your profiling data.

Grafana Cloud / OSS

Profiles Drilldown is pre-installed and is the default way to explore your profiles – all you need to do is start sending data.

Documentation

For more information on how to use Pyroscope with other programming languages, install it on Linux, or use it in a production environment, check out our documentation:

Send data to the server

You can send profiles to Pyroscope with the language SDKs, with Grafana Alloy, or over OTLP from OpenTelemetry-compatible sources such as the OpenTelemetry eBPF profiler.

For more documentation on how to add the Pyroscope SDK to your code, see the client documentation on our website or find language-specific examples and documentation below:


Golang

Documentation
Examples

Java

Documentation
Examples

Python

Documentation
Examples
readme truncated — read the full docs on github

Frequently asked questions

Is pyroscope free to use?

pyroscope is open source under the AGPL-3.0 licence. There is no licence fee and no seat count — you can self-host it or, where the project offers one, pay a vendor for a managed version instead.

What does pyroscope do?

Continuous Profiling Platform. Debug performance issues down to a single line of code

What is pyroscope written in?

pyroscope is primarily written in Go. Its source is publicly available at https://github.com/grafana/pyroscope, and it has 11,661 GitHub stars.