pmm is a free, open source monitoring & observability project written in Go and released under AGPL-3.0. It has 1,125 GitHub stars, 238 forks and 240 open issues, and was last pushed 9 hours ago. On this registry it ranks #215 of 270 tracked projects in Monitoring & Observability, with 5 head-to-head comparisons available. It gained 16 stars over the last 30 tracked days.

What is pmm?

Percona Monitoring and Management (PMM) is an open source database monitoring, observability and management tool, licensed AGPL-3.0, that gives MySQL, MongoDB, PostgreSQL, Valkey and Redis operators a single pane of glass over database performance, security and availability.

What it is

Percona Monitoring and Management is a client-server monitoring platform written in Go and distributed primarily as a Docker image. The server component runs as the percona/pmm-server:3 container with persistent state held in the pmm-data volume, and it exposes a web interface on port 8443 that is published to HTTPS on the host. Client components connect the databases to be observed back to that server. The project lives in the Percona ecosystem and carries the database, database-management, monitoring, observability and pmm topics on GitHub.

The concrete problem it solves is fragmentation. Teams running more than one database engine normally end up consulting a different set of dashboards, metrics endpoints and alerting rules for each engine. PMM consolidates MySQL, MongoDB, PostgreSQL, Valkey and Redis into one interface, so performance data, alerts and advisor findings for all of them are reviewed in the same place rather than gathered engine by engine. It also moves beyond passive graphing by shipping built-in Advisors that run regular checks against connected databases and flag potential security threats, performance degradation, data loss and data corruption.

Key capabilities

  • Server deployment from the percona/pmm-server:3 Docker image, backed by the pmm-data volume mounted at /srv.
  • Web interface published with --publish 443:8443, reachable in a browser at the server host, defaulting to https://localhost.
  • Default credentials of username admin and password admin on first login.
  • Customizable dashboards with real-time alerting for database performance.
  • Drill-down analysis that zooms from node level to single query level for troubleshooting and optimization.
  • Built-in Advisors performing scheduled checks for security threats, performance degradation, data loss and data corruption.
  • Coverage of five engines in one tool: MySQL, MongoDB, PostgreSQL, Valkey and Redis.

Who uses it and how

  • Database reliability and operations teams running more than one engine, who need one dashboard set instead of per-engine tooling.
  • Teams troubleshooting incidents, using query-level drill-down to find root cause faster.
  • Organizations operating business-critical database environments spread across hybrid infrastructure, from cloud providers to bare metal.
  • Security-conscious operators who rely on the Advisors' recurring checks rather than ad hoc audits.
  • Operations groups with mission-critical monitoring deployments, which have the option of commercial enterprise-grade support from Percona alongside the community forum.

Getting started

Run docker pull percona/pmm-server:3, create the volume with docker volume create pmm-data, then start the server with docker run --detach --restart always --publish 443:8443 --volume pmm-data:/srv --name pmm-server percona/pmm-server:3. Open the host in a browser and log in with admin / admin. The README points to the separate "About PMM installation" documentation page for other installation methods.

How it compares

No list of paid products that this project replaces is provided in the facts, and no comparable monitoring tools are named there either. On the available evidence, it stands alone in this registry.

When to use it — and when not to

A self-hoster must run and maintain the Docker server container and its pmm-data volume, so a working container runtime and persistent storage are prerequisites, and the documented quickstart leaves TLS termination and authentication hardening to the operator. Teams that want only a single-engine agent, or that will not accept an AGPL-3.0 copyleft licence, should look elsewhere. The README excerpt is thin beyond the quickstart: it defers installation detail to external documentation, and the repository shows 240 open issues, so prospective adopters should expect an actively worked backlog rather than a quiet one.

project readme (upstream, from github) — read inline

Percona Monitoring and Management

CI CLA assistant Code coverage Go Report Card OpenSSF Scorecard OpenSSF Best Practices Forum

PMM

Percona Monitoring and Management

A single pane of glass to easily view and monitor the performance of your MySQL, MongoDB, PostgreSQL, Valkey, and Redis databases.

Percona Monitoring and Management (PMM) is the best-of-breed open source database monitoring solution. It helps you reduce complexity, optimize performance, and improve the security of your business-critical database environments, no matter where they are located or deployed. PMM helps users to:

  • Reduce Complexity
  • Optimize Database Performance
  • Improve Data Security

See the PMM Documentation for more information.

Use cases

  • Monitor your database performance with customizable dashboards and real-time alerting.
  • Spot critical performance issues faster, understand the root cause of incidents better and troubleshoot them more efficiently.
  • Zoom-in, drill-down database performance from node to single query levels. Perform in-depth troubleshooting and performance optimization.
  • Built-in Advisors run regular checks of the databases connected to PMM. The checks identify and alert you of potential security threats, performance degradation, data loss and data corruption.

Architecture
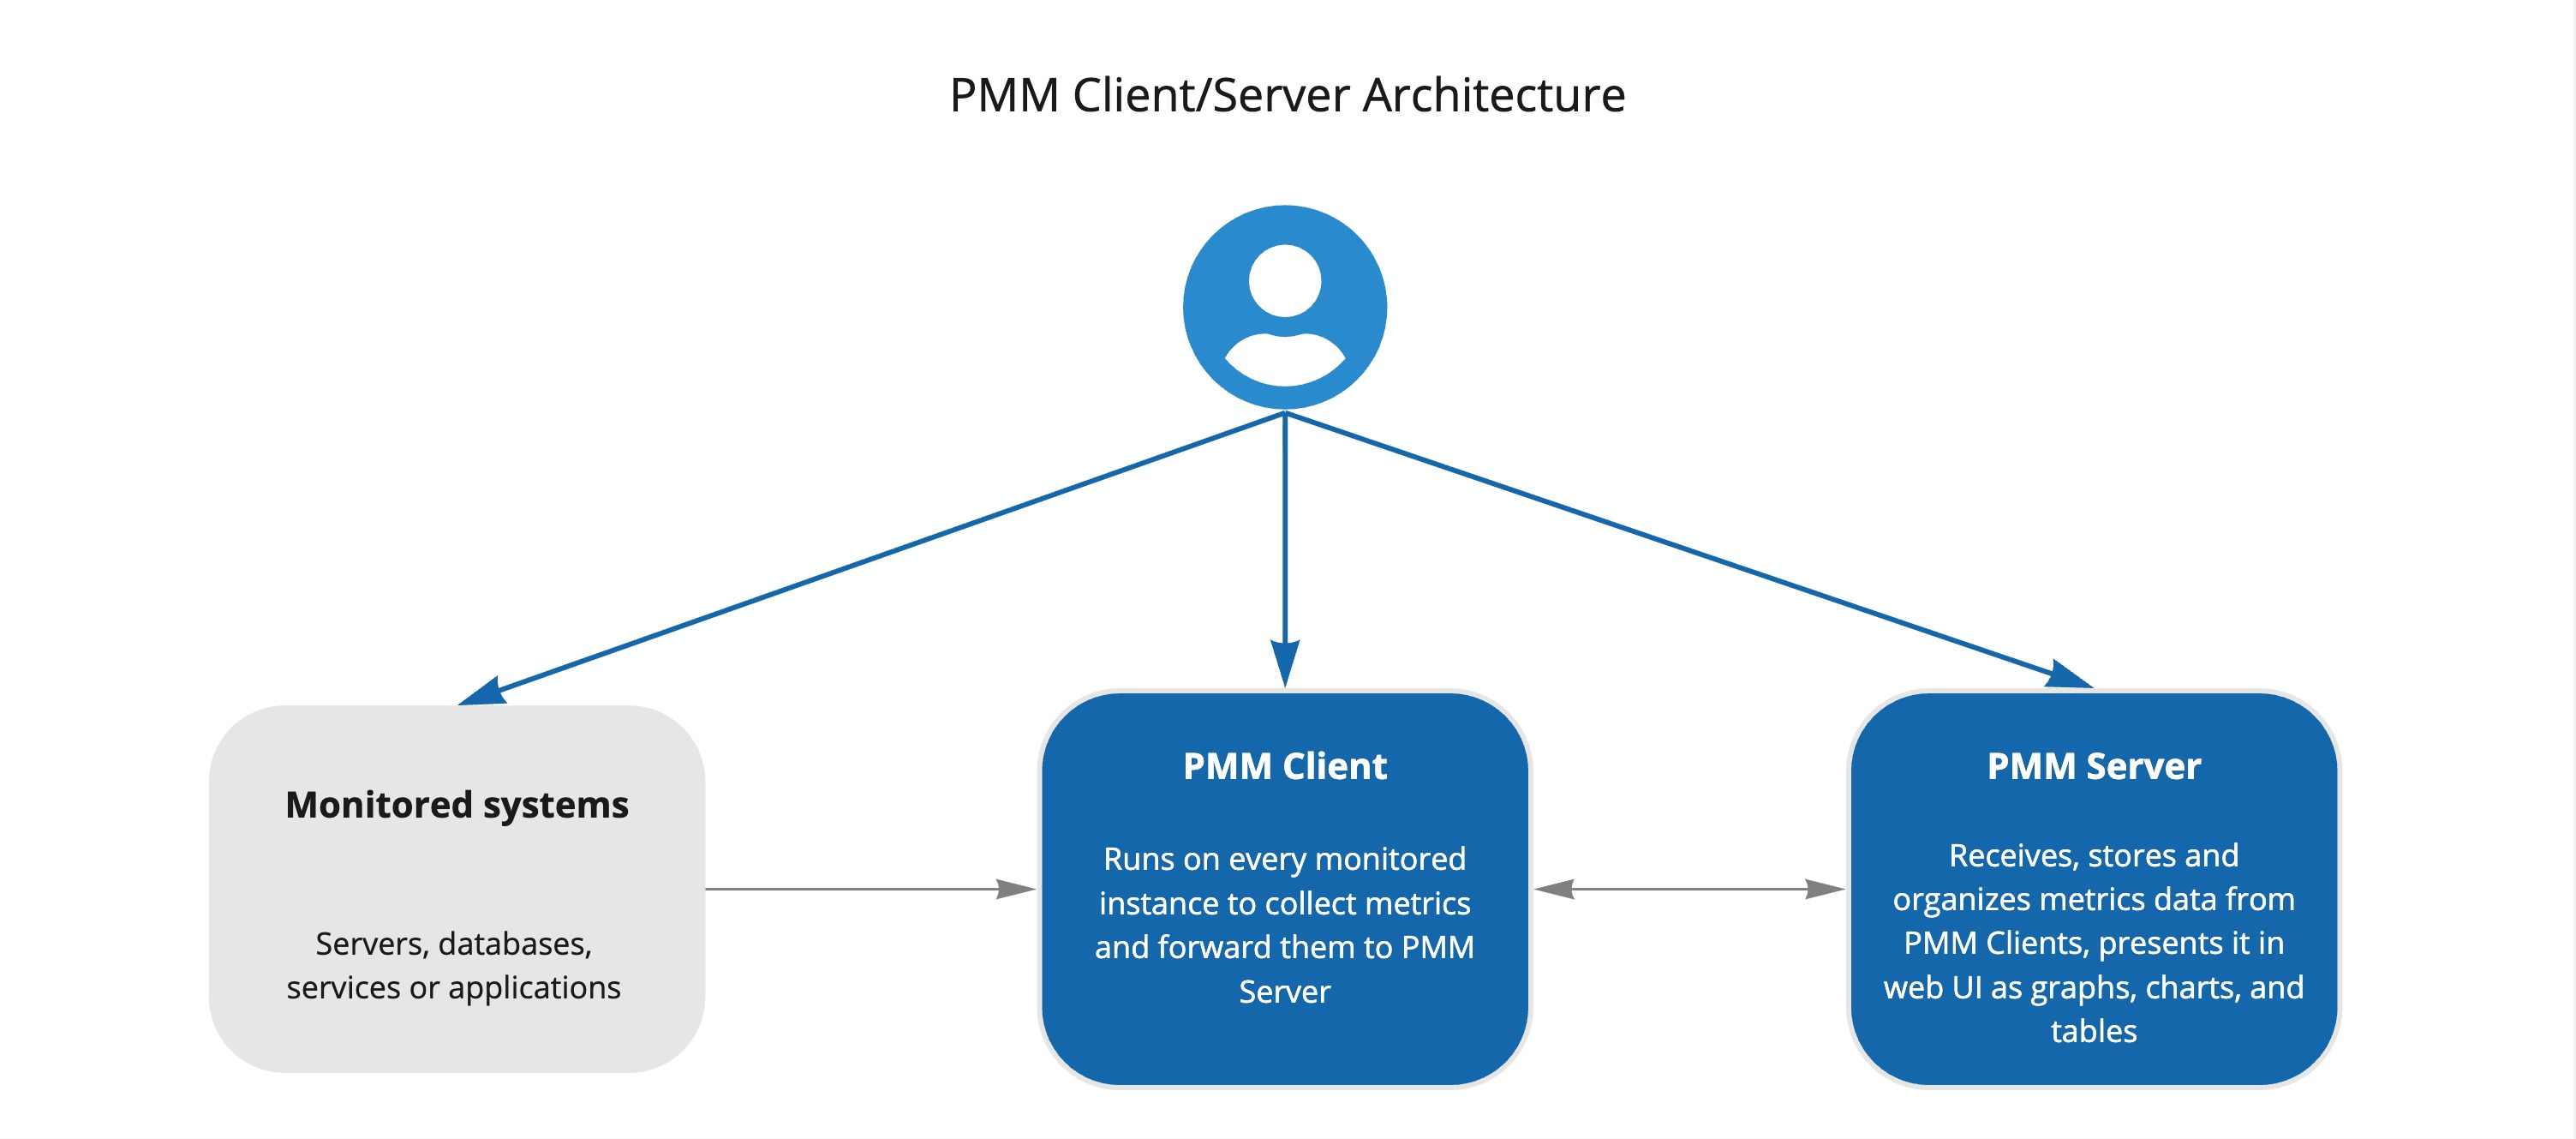
Overall Architecture

PMM Server

PMM Client

Installation

There are different installation methods, please check our About PMM installation documentation page.

But in a nutshell:

  1. Download PMM server Docker image:
$ docker pull percona/pmm-server:3
  1. Create the data volume container:
$ docker volume create pmm-data
  1. Run PMM Server container:
$ docker run --detach --restart always \
  --publish 443:8443 \
  --volume pmm-data:/srv \
  --name pmm-server \
  percona/pmm-server:3
  1. Start a web browser and type the server name or IP address of the PMM server host (defaults to https://localhost).

Enter the username and password. The defaults are username: admin and password: admin

Need help?

Commercial Support Community Support
Enterprise-grade support for mission-critical monitoring deployments with Percona Monitoring and Management.

Get expert guidance for complex monitoring scenarios across hybrid environments—from cloud providers to bare metal infrastructures.
Connect with our engineers and community members to troubleshoot issues, share best practices, and discuss monitoring strategies.
Get Percona Support Visit our Forum

How to get involved

We encourage contributions and are always looking for new members that are as dedicated to serving the community as we are.

If you’re looking for information about how you can contribute, we have contribution guidelines across all our repositories in CONTRIBUTING.md files. Some of them may just link to the main project’s repository’s contribution guidelines.

We're looking forward to your contributions and hope to hear from you soon on our Forums.

Submitting bug reports

If you find a bug in Percona Monitoring and Management or one of the related projects, you should submit a report to that project's JIRA issue tracker. Some of related projects also have GitHub Issues enabled, so you could also submit there.

Your first step should be to search the existing set of open tickets for a similar report. If you find that someone else has already reported your problem, then you can upvote that report to increase its visibility.

If there is no existing report, submit a report following these steps:

  1. Sign in to Percona JIRA. You will need to create an account if you do not have one.
  2. From the top navigation bar, anywhere in Jira, click Create.
  3. Select Percona Monitoring and Management (PMM) from the Project drop-down menu.
  4. Fill in the fields of Summary, Description, Steps To Reproduce, and Affects Version to the best you can. If the bug corresponds to a crash, attach the stack trace from the logs.

An excellent resource is Elika Etemad's article on filing good bug reports.

As a general rule of thumb, please try to create bug reports that are:

  • Reproducible - Include steps to reproduce the problem.
  • Specific - Include as much detail as possible: which version, what environment, etc.
  • Unique - Do not duplicate existing tickets.

Licensing

Percona is dedicated to keeping open source open. Wherever possible, we strive to apply a permissive license to both our software and documentation.

PMM components are licensed under the following open source licenses:

Frequently asked questions

Is pmm free to use?

pmm is open source under the AGPL-3.0 licence. There is no licence fee and no seat count — you can self-host it or, where the project offers one, pay a vendor for a managed version instead.

What does pmm do?

Percona Monitoring and Management: an open source database monitoring, observability and management tool

What is pmm written in?

pmm is primarily written in Go. Its source is publicly available at https://github.com/percona/pmm, and it has 1,125 GitHub stars.