



Laminar
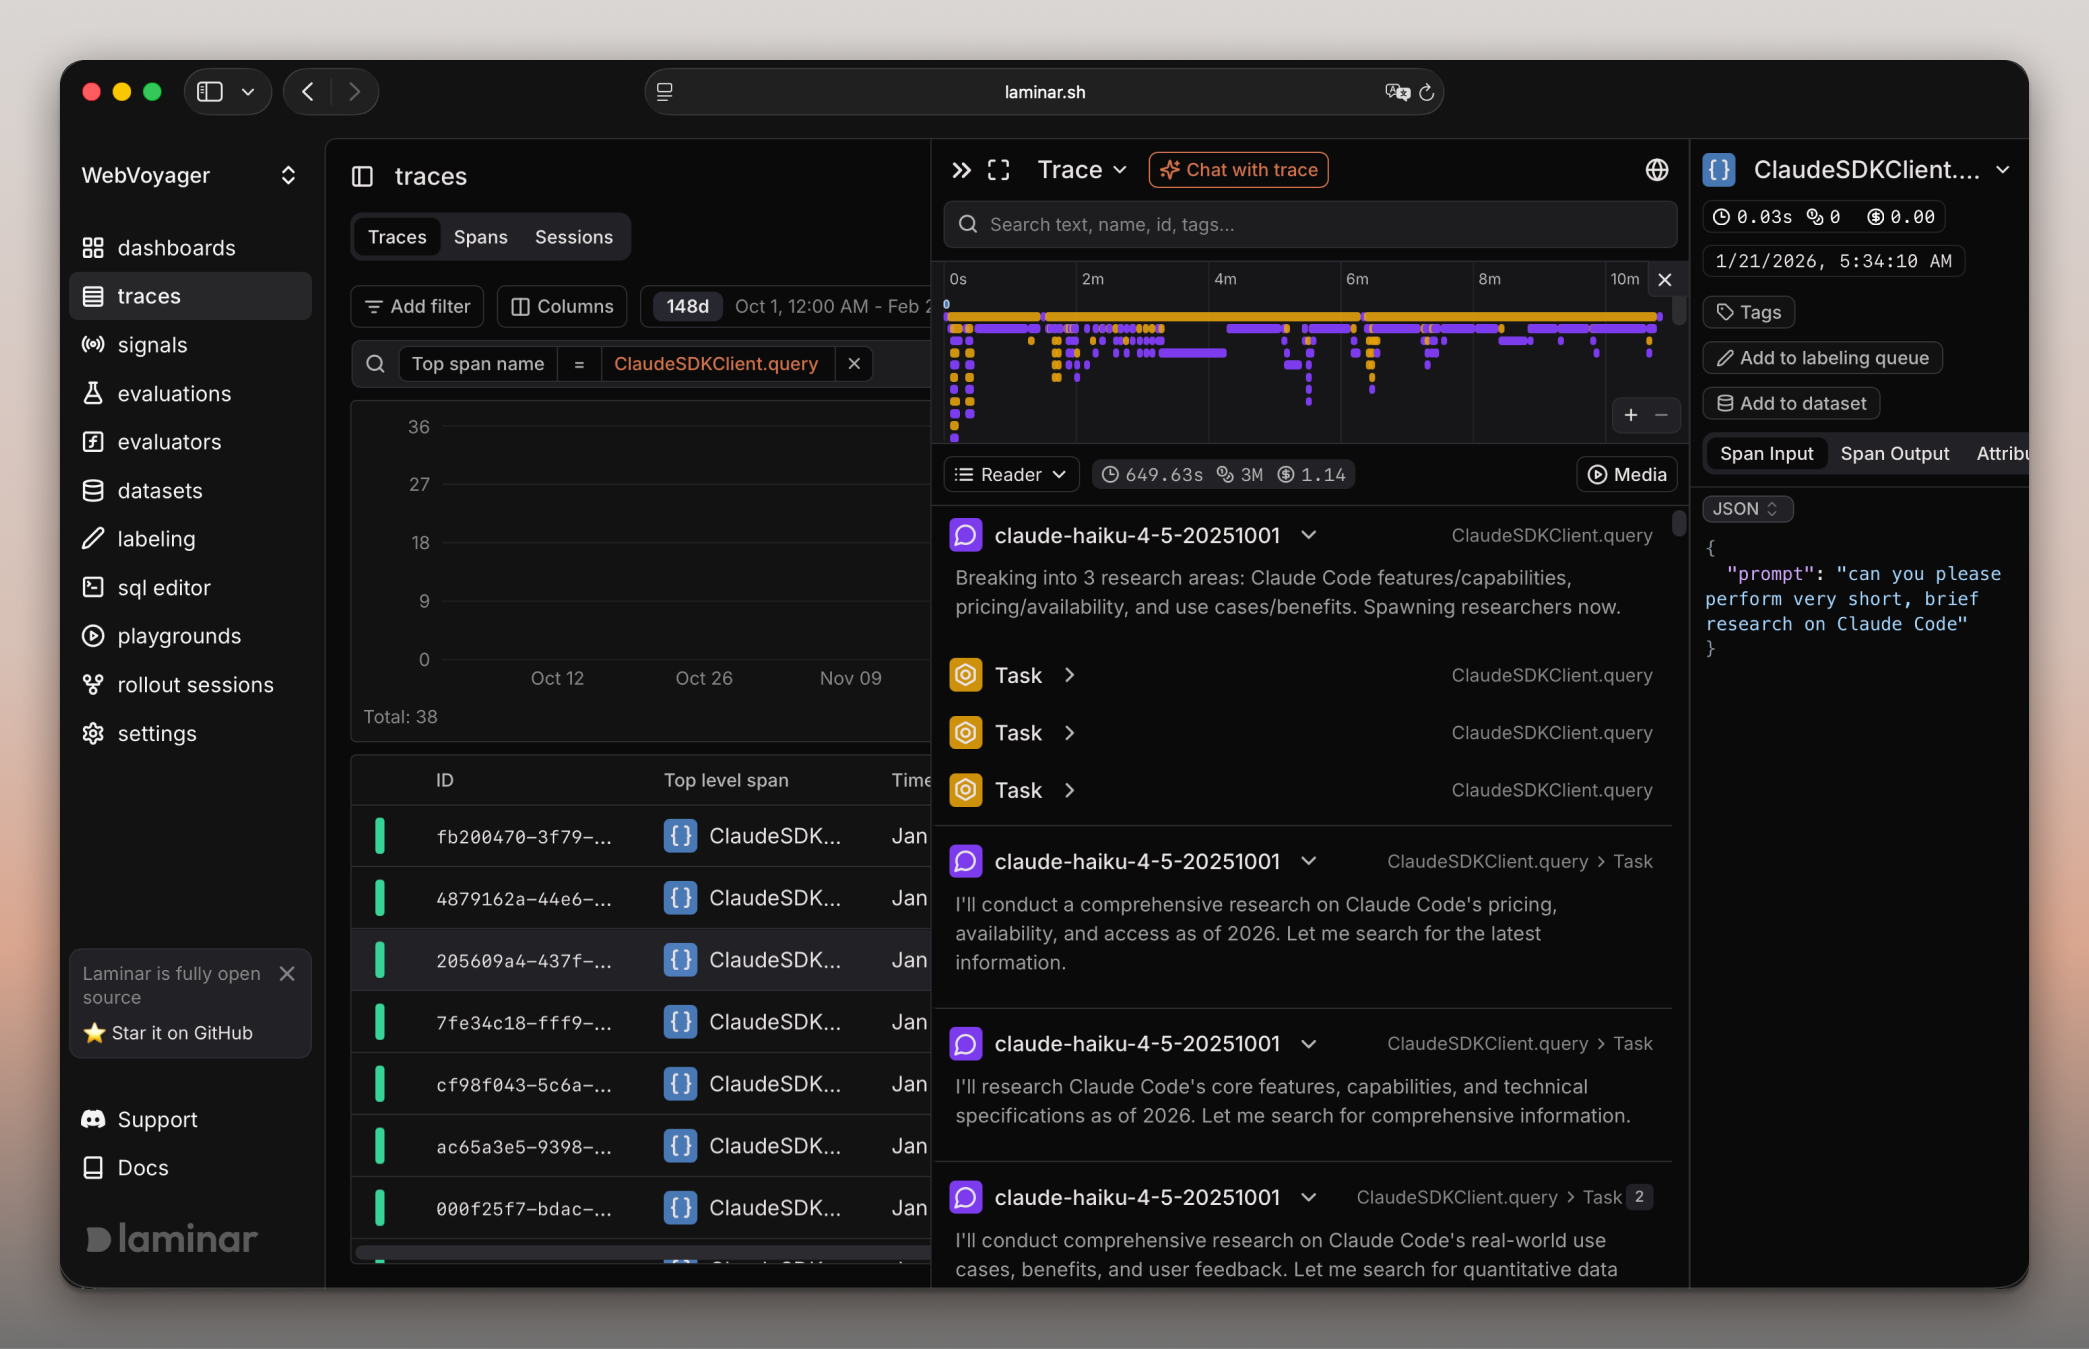
Laminar is an open-source observability platform purpose-built for AI agents.
- Tracing. Docs
- OpenTelemetry-native powerful tracing SDK - 1 line of code to automatically trace Vercel AI SDK, Browser Use, Stagehand, LangChain, OpenAI, Anthropic, Gemini, and more.
- Signals. Docs
- Describe any behavior of your agent that you want to track in plain English (e.g. "agent is stuck in a loop")
- Laminar reads every agent run and pings you in Slack when it happens.
- Evals. Docs
- Unopinionated, extensible SDK and CLI for running evals locally or in CI/CD pipeline.
- UI for visualizing evals and comparing results.
- MCP / CLI access for your coding agent
- Query traces, spans, metrics, and events with SQL
- Let your coding agent investigate and debug issues based on your traces
- Dashboards. Docs
- Powerful dashboard builder for traces, metrics, and events with support of custom SQL queries.
- Data annotation & Datasets. Docs
- Custom data rendering UI for fast data annotation and dataset creation for evals.
- Extremely high performance.
- Written in Rust 🦀
- 20x trace compression for efficient ingestion and storage. Read more about it here.
- Custom realtime engine for viewing traces as they happen.
- Ultra-fast full-text search over span data.
- gRPC exporter for tracing data.
Documentation
Check out the full documentation here laminar.sh/docs.
Getting started
The fastest and easiest way to get started is with our managed platform -> laminar.sh
Self-hosting with Docker compose
Laminar is very easy to self-host locally. For a quick start, clone the repo and start the services with docker compose:
git clone https://github.com/lmnr-ai/lmnr
cd lmnr
docker compose up -d
This will spin up a lightweight but full-featured version of the stack. This is good for a quickstart or for lightweight usage. You can access the UI at http://localhost:5667 in your browser.
You will also need to properly configure the SDK, with baseUrl and correct ports. See guide on self-hosting.
For production environment, we recommend using our managed platform or docker compose -f docker-compose-full.yml up -d.
Upgrading existing self-hosted installations
The ClickHouse configuration disables internal telemetry logs that are not useful
for a single-node installation and retains query and error logs for three days.
After pulling this change, recreate the ClickHouse container to apply the
configuration. The examples below use docker-compose.yml; pass -f with the
Compose file used by your deployment when it differs:
docker compose up -d --force-recreate clickhouse
Disabling a system log stops new writes but does not clear an existing table. To reclaim its disk space while preserving the table structure, truncate the disabled log tables after ClickHouse restarts:
docker compose exec -T clickhouse clickhouse-client --multiquery <<'SQL'
TRUNCATE TABLE IF EXISTS system.trace_log;
TRUNCATE TABLE IF EXISTS system.text_log;
TRUNCATE TABLE IF EXISTS system.part_log;
TRUNCATE TABLE IF EXISTS system.metric_log;
TRUNCATE TABLE IF EXISTS system.asynchronous_metric_log;
TRUNCATE TABLE IF EXISTS system.background_schedule_pool_log;
TRUNCATE TABLE IF EXISTS system.query_metric_log;
TRUNCATE TABLE IF EXISTS system.query_thread_log;
TRUNCATE TABLE IF EXISTS system.query_views_log;
TRUNCATE TABLE IF EXISTS system.session_log;
TRUNCATE TABLE IF EXISTS system.crash_log;
TRUNCATE TABLE IF EXISTS system.opentelemetry_span_log;
TRUNCATE TABLE IF EXISTS system.zookeeper_log;
TRUNCATE TABLE IF EXISTS system.blob_storage_log;
TRUNCATE TABLE IF EXISTS system.processors_profile_log;
TRUNCATE TABLE IF EXISTS system.asynchronous_insert_log;
SQL
When ClickHouse applies the new TTL to an existing query_log or error_log,
it may rename the previous table with a numeric suffix such as query_log_0.
Inspect any suffixed tables before dropping them if you also want to reclaim
their historical data.
Configuring LLM provider (optional)
Frontend AI features (chat-with-trace, SQL-with-AI) and server-side AI workers require an LLM provider. Configure one in your .env file at the repo root.
Pick one of the following provider setups. LLM_MODEL_SMALL|MEDIUM|LARGE are optional — per-provider defaults apply when unset. LLM_DEFAULT_HEADERS_JSON is optional for any provider or gateway that requires static headers.
# Optional for any provider/gateway that requires static headers
# LLM_DEFAULT_HEADERS_JSON='{"X-Gateway-Tenant":"tenant"}'

# Option A: Gemini
LLM_PROVIDER=gemini
LLM_API_KEY=your_gemini_key

# Option B: OpenAI (or any OpenAI-compatible gateway such as LiteLLM, OpenRouter, vLLM)
LLM_PROVIDER=openai
# LLM_BASE_URL=http://localhost:4000   # optional, for OpenAI-compatible gateways
LLM_API_KEY=your_openai_key

# Option C: AWS Bedrock (Anthropic Claude). Uses AWS credentials instead of LLM_API_KEY.
LLM_PROVIDER=bedrock
AWS_ACCESS_KEY_ID=...
AWS_SECRET_ACCESS_KEY=...
AWS_REGION=us-east-1

# Option D: Azure AI Foundry. One resource serves three API shapes; pick the one
# matching your deployment. Model ids are deployment names, so set LLM_MODEL_*
# unless your deployments are named after the models.
#   azure_chat_completions -> <resource>.services.ai.azure.com/openai/v1/chat/completions
#   azure_responses        -> <resource>.services.ai.azure.com/openai/v1/responses
#   azure_anthropic        -> <resource>.services.ai.azure.com/anthropic/v1/messages (Claude)
LLM_PROVIDER=azure_chat_completions
LLM_API_KEY=your_azure_key
AZURE_RESOURCE_ID=your_resource_name   # or AZURE_BASE_URL for private endpoints
# AZURE_API_VERSION=preview            # optional; only for resources that require it
Custom Postgres schema (optional)
By default Laminar uses the public schema. To target a different schema (e.g.
when deploying alongside other services in a shared Postgres instance), set the
same value for both the frontend and the app-server:
POSTGRES_SCHEMA=laminar
# Set to false if the schema is pre-provisioned or the DB role lacks CREATE.
# POSTGRES_CREATE_SCHEMA=true
The schema is applied as the connection search_path, so all tables, foreign
keys, and migrations target it. When a non-public schema is set, the frontend
also tracks migrations inside that schema (.__drizzle_migrations)
rather than the shared drizzle schema. Note that running Laminar alongside
another Drizzle-managed service in the same database may still require manual
intervention, since Drizzle's migration journal is versioned per-schema.
Anonymous usage telemetry
Self-hosted deployments collect anonymized usage telemetry. To opt out, set LAMINAR_TELEMETRY_DISABLED=true in your .env.
Contributing
For running and building Laminar locally, or to learn more about docker compose files, follow the guide in Contributing.
TS quickstart
First, create a project and generate a project API key. Then,
npm add @lmnr-ai/lmnr
It will install Laminar TS SDK and all instrumentation packages (OpenAI, Anthropic, LangChain ...)
To start tracing LLM calls just add
import { Laminar } from '@lmnr-ai/lmnr';
Laminar.initialize({ projectApiKey: process.env.LMNR_PROJECT_API_KEY });
To trace inputs / outputs of functions use observe wrapper.
import { OpenAI } from 'openai';
import { observe } from '@lmnr-ai/lmnr';

const client = new OpenAI({ apiKey: process.env.OPENAI_API_KEY });

const poemWriter = observe({name: 'poemWriter'}, async (topic) => {
  const respons