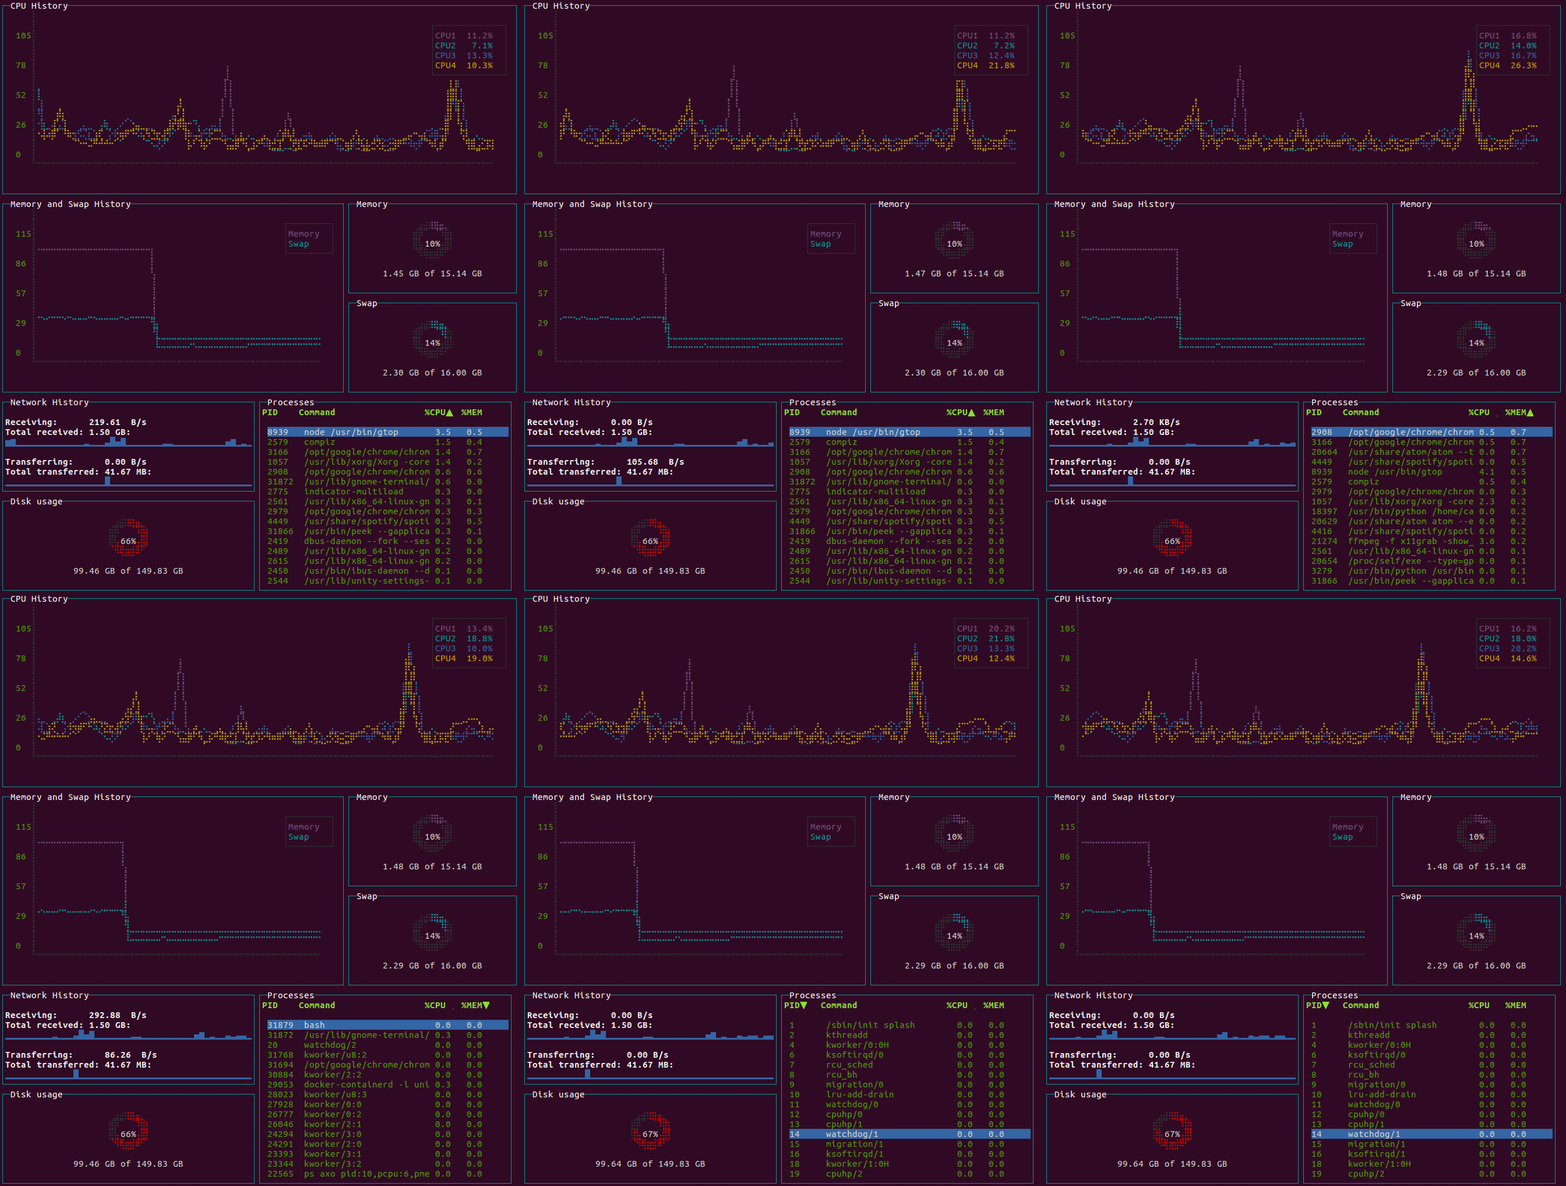
gtop is a system monitoring dashboard for the terminal — a Node.js command-line tool that renders a live, interactive view of a machine's process table and resource metrics in a text user interface, aimed at developers, system administrators and anyone who wants top-style visibility on a Linux, macOS or Windows host without leaving the shell.
What it is
gtop is an open-source terminal application written in JavaScript and published on npm as gtop. It draws a full-screen dashboard inside the terminal, showing the running process table alongside live system metrics, and it lets the operator re-sort that table interactively while the dashboard runs. It lives in the Node.js ecosystem and depends on a Node.js runtime of version 8 or later. Releases are distributed through npm, through Snap, and as a Docker image at aksakalli/gtop. The project is released under the MIT license, and the repository sits at roughly 9,900 stars with 337 forks and 40 open issues, with the most recent push dated 6 November 2025.
The concrete problem it solves is having to remember and type different inspection commands on every machine. The classic approach to process inspection is a patchwork of top, ps, free and platform-specific variants, each with its own flags, its own output format and its own quirks. gtop replaces that with one npm-installed command that starts with a single word — gtop — and presents the same interactive dashboard on every supported platform. It is a lighter, self-contained alternative to assembling several native utilities, and it is also a practical replacement in container environments, where the host's metrics are not visible from inside a container unless the container is given access to the host's network and process namespaces.
Key capabilities
- Live process table that can be re-sorted at runtime by pressing
p for Process Id, c for CPU usage, or m for Memory usage.
- Clean shutdown from the dashboard with
q, or with ctrl+c in most shell environments.
- Cross-platform support for Linux, OSX and Windows, with the README explicitly noting that Windows support is partial.
- Distributed on npm with a global install path:
npm install gtop -g, then start it with the gtop command.
- Official Docker image
aksakalli/gtop, which must be launched with --net="host" and --p to read metrics from the host machine rather than from the container.
- Snap package published through snapcraft, giving Ubuntu and other snap-enabled systems a second installation channel.
- Documented terminal-encoding workaround: if question marks or other unexpected characters appear, run with
LANG=en_US.utf8 TERM=xterm-256color gtop.
Who uses it and how
- Operators inspecting a single Linux or macOS server interactively, with no agent, daemon or background service to install first.
- Engineers running workloads on container hosts, who launch the published Docker image with host network and host PID mode so the dashboard sees the host's processes and metrics instead of the container's isolated view.
- Developers on Windows machines who want the same dashboard as their Linux colleagues, accepting the partial platform support the README documents.
- Ubuntu and snap-based users who install from the snap channel instead of npm, and who keep the tool on hand for quick ad hoc checks.
- Teams that need read-only, on-the-spot inspection on one machine at a time, and that do not want to stand up a full metrics pipeline for that purpose.
Getting started
Install globally from npm with npm install gtop -g and start the dashboard by running gtop. Alternatively, run the official image directly with docker run --rm -it --name gtop --net="host" --p aksakalli/gtop, which requires the host network and host PID assignments to reach the host's metrics.
How it compares
The registry entry supplies no list of paid products that gtop replaces, and no comparable tools are named in the facts beyond the top topic keyword attached to the repository. It stands alone in this registry against that backdrop, so any comparison would have to be drawn from outside the available facts.
When to use it — and when not to
Choose gtop when a single machine needs a quick, interactive, terminal-based look at its processes and resource usage, and when installing a Node.js runtime of version 8 or later — or running the Docker image — is acceptable. Do not choose it for fleet-wide monitoring, historical metrics, alerting or retention: the README describes an interactive dashboard only, with no storage layer, no central server and no data export, so anything beyond the current session is out of scope. Prospective users should also weigh the partial Windows support and the terminal-encoding troubleshooting the README calls out, since both can require environment variables to be set before the display renders correctly.