EasyMonitor
Open-source, self-hosted uptime and performance monitoring you can run with one
docker compose up.


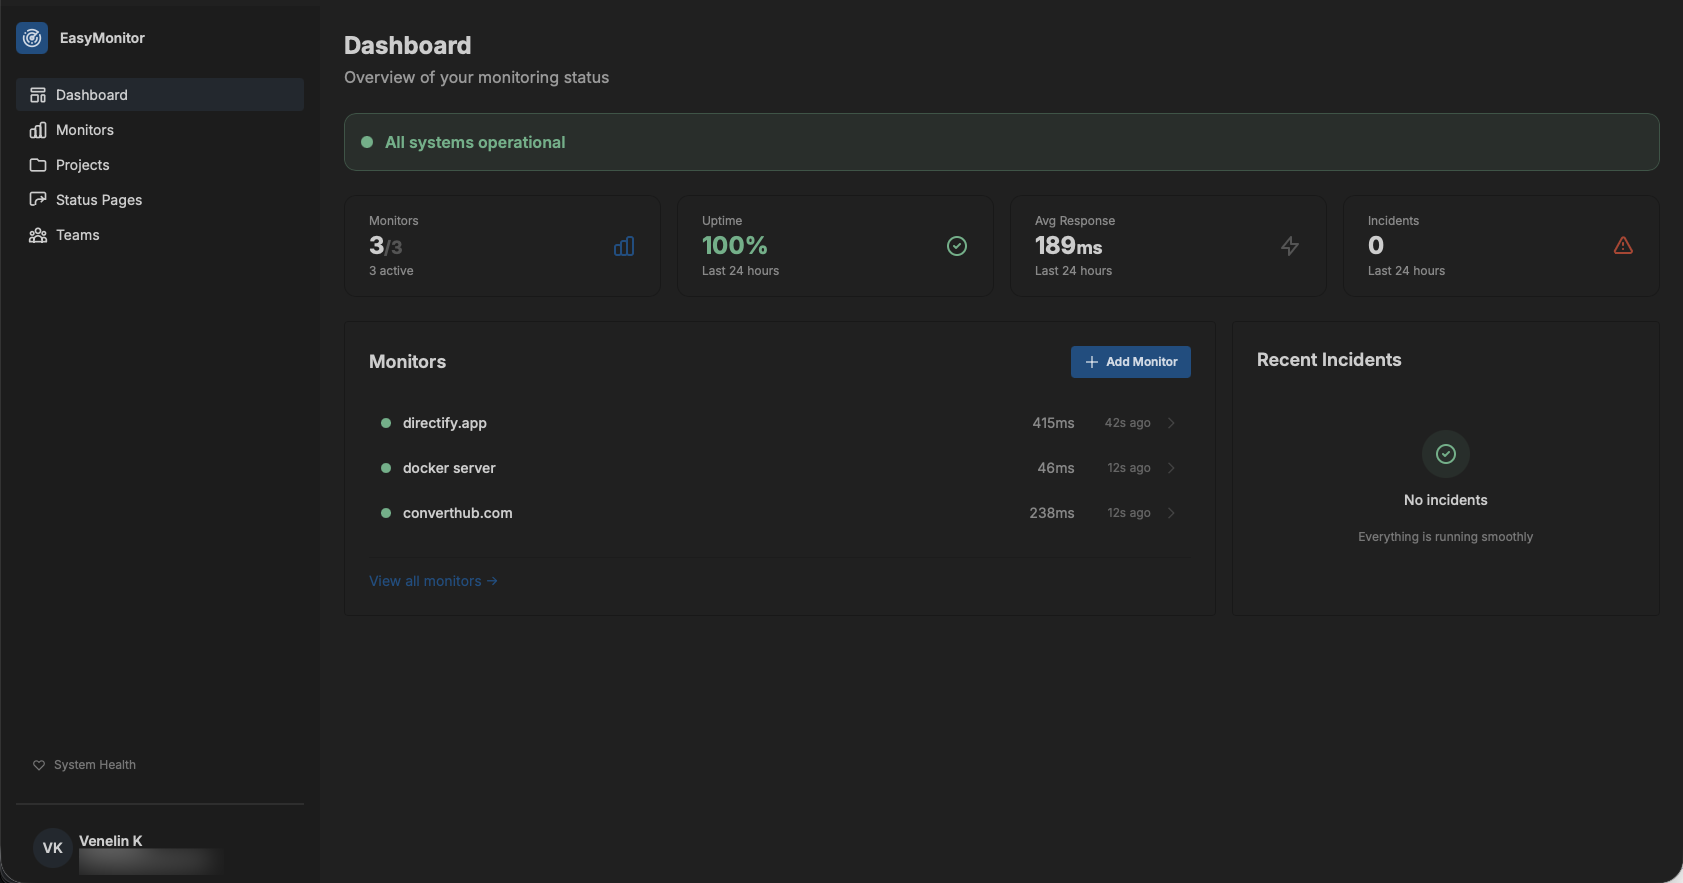
EasyMonitor is a full-stack monitoring platform for your websites and APIs. Add a URL, pick an interval, and get alerted when something breaks. Group monitors into projects, share live status with your users via public status pages, and run probes in multiple regions to eliminate false positives.
Screenshot
Features
- HTTP, ICMP, and TCP port checks — every 30 seconds to 1 hour per monitor
- SSL certificate expiry monitoring — captured during HTTPS checks; alerts at 30/14/7 days before expiry
- Multi-region probes — lightweight Go binaries (~10 MB) you can deploy anywhere
- Consecutive-failure threshold — configurable per monitor; no alerts on flaky single failures
- Multi-channel alerts — email, Slack, Discord, Telegram, ntfy, generic webhooks (HMAC-signed), and Pushover (per-user, per-monitor selection) on down and recovery
- Projects — group related monitors (e.g. main site + APIs)
- Teams — share monitors and projects with collaborators with role-based access
- Status pages — public, unlisted (secret link), or private
- Add projects (live link) or individual monitors
- Hide specific monitors per page
- Themes, custom CSS, logo upload
- Incidents and scheduled maintenance with timeline updates
- Custom domains with auto-HTTPS via Caddy on-demand TLS
- TimescaleDB — efficient time-series storage for check results
- Redis Streams — reliable job bus between scheduler, probes, and result consumer
- Laravel Horizon — queue dashboard for ops visibility
Architecture
                       ┌──────────────────────────┐
                       │  Laravel + Livewire UI   │
                       │  (admin + public pages)  │
                       └────────────┬─────────────┘
                                    │
                XADD checks         │         consumes results
                ┌───────────────────┴───────────────────┐
                ▼                                       ▲
       ┌────────────────┐                       ┌──────┴────────┐
       │ Redis Streams  │ ◀──── XADD results ───┤ Probe nodes   │
       │ checks/results │    (HTTP, ICMP, TCP)  │ (Go, multi-r.)│
       └────────────────┘                       └───────────────┘
                │
                ▼
       ┌──────────────────────────┐
       │ PostgreSQL + TimescaleDB │
       │ (hypertable for checks)  │
       └──────────────────────────┘
Stack
- Backend: Laravel 12, PHP 8.4, Livewire 3
- Frontend: Tailwind CSS 4, DaisyUI 5, Alpine.js (bundled with Livewire)
- Probe: Go 1.24 (separate binary, multi-architecture)
- Database: PostgreSQL 18 + TimescaleDB 2.26
- Message bus: Redis 7 Streams
- Web: Caddy 2.10 (HTTPS) → Nginx → PHP-FPM (with Supervisor + Horizon)
Quick start
Prerequisites
- Docker and Docker Compose v2
- ~2 GB free RAM (4 GB comfortable for production)
- Linux, macOS, or WSL2
One command
git clone https://github.com/easymonitordev/easymonitor.git
cd easymonitor
./setup.sh
The installer is interactive and walks through:
- Mode — local development or production
- Domain + admin email (production only) — auto-detects your server's public IP and verifies DNS
- Database — auto-generates strong password in production
- Redis password — optional
- Registration policy — open or first-user-only
- Email driver — log only, Amazon SES, or generic SMTP
- Pushover — optional; paste an application token to enable push alerts
- Object storage — local disk, Cloudflare R2, or Amazon S3
It then:
- Writes
.env - Patches
docker/caddy/Caddyfile.productionfor production installs - Builds and starts all containers
- Generates app key, JWT secret, probe token
- Runs migrations
- Builds frontend assets
- Sets up the storage symlink
When it finishes, open the URL it prints. The first user can register and becomes the admin.
Adding a probe in another region
A local probe runs by default. To add probes in other regions, they need a network path to the server's Redis. Never expose Redis directly on the public internet — use a private network tunnel instead.
Supported options:
- Tailscale (recommended) — two commands on server and probe, done
- Cloudflare Tunnel — free, zero ports exposed
- Manual — SSH tunnel, WireGuard, your own VPN
The setup.sh installer has a "Will you run probes on other machines?" prompt that auto-installs Tailscale on the server if you pick that option.
The probe node itself lives in a separate repo so you can deploy it on any host without cloning the full EasyMonitor app:
- Probe repo: github.com/easymonitordev/probe-node
- Pre-built image:
easymonitor/probe-node:latest(Docker Hub) — mirror atghcr.io/easymonitordev/probe-node:latest
Full server-side tunnel setup (Tailscale / Cloudflare / manual) and probe-side docker run details are in PROBE_NODE_SETUP.md.
To disable the bundled local probe:
docker compose up -d --scale probe=0
Custom domains for status pages
When using the production Caddyfile (configured automatically by setup.sh for production installs), customers can point their own domain at your EasyMonitor instance:
- In the status page settings, they enter
status.theircompany.com - They add the displayed TXT record at their DNS provider for verification
- They CNAME their domain to your EasyMonitor host (gray cloud / DNS only on Cloudflare)
- Click Verify Domain in the UI
Caddy then provisions a Let's Encrypt certificate automatically on the first request via on-demand TLS. The app gates which domains are allowed via a /caddy/ask endpoint that checks the domain_verified_at flag.
Notifications
Each user chooses where their alerts go from Settings → Notifications. Every monitor picks a subset of the user's configured channels; new monitors default to the user's default channel.
Supported channels:
| Channel | Setup | Per-user config |
|---|---|---|
Configured by the admin via MAIL_MAILER (log, SES, SMTP) |
Uses the account email | |
| Slack | No admin setup — Slack-side only | User adds one or more incoming webhooks, each labelled (e.g. #alerts-api, #alerts-frontend) — pick which ones to alert per monitor |
| Discord | No admin setup — Discord-side only | User adds one or more channel webhooks (Server Settings → Integrations → Webhooks), each labelled — pick which ones to alert per monitor |
| Webhook | No admin setup | User adds one or more HTTP endpoints (any URL) — each gets an auto-generated HMAC-SHA256 secret. Payloads are signed with X-EasyMonitor-Signature: sha256=… and tagged with X-EasyMonitor-Event: monitor.down|monitor.recovered|certificate.expiring. Pipe to PagerDuty, Zapier, n8n, custom services |
| Telegram | No admin setup — Telegram-side only | User creates a bot via @BotFather, then adds the bot token + chat id per chat/group, each labelled — pick which ones to alert per monitor |
| ntfy | No admin setup | User picks a topic on ntfy.sh or a self-hosted ntfy server (optional access token for protected topics), subscribes in the ntfy app — no account needed |
| Pushover | Admin sets PUSHOVER_APP_TOKEN once (from pushover.net/apps/build) |
User pastes their user key (and optional device) |
Send-test buttons on the Notifications page let each user verify their configuration end-to-end.
Webhook payload
Webhook deliveries are HTTP POST with Content-Type: application/json. Two events fire — one when a monitor crosses the failure threshold and one when it recovers.
Headers
| Header | Value |
|---|---|
X-EasyMonitor-Event |
monitor.down, monitor.recovered, or certificate.expiring |
X-EasyMonitor-Signature |
sha256= — HMAC-SHA256 of the raw body using your channel's secret |
User-Agent |
EasyMonitor-Webhook/1.0 |
monitor.down body
{
  "event": "monitor.down",
  "monitor": {
    "id": 42,
    "name": "Production API",
    "url": "https://api.example.com/health",
    "check_type": "http"
  },
  "error": "Get \"https://api.example.com/health\": dial tcp: connection refused",
  "checked_at": "2026-05-14T13:42:07+00:00",
  "dashboard_url": "https://easymonitor.example.com/monitors/42"
}
error is