dockprom
A monitoring solution for Docker hosts and containers with Prometheus, Grafana, cAdvisor, NodeExporter and alerting with AlertManager.
Install
Clone this repository on your Docker host, cd into dockprom directory and run compose up:
git clone https://github.com/stefanprodan/dockprom
cd dockprom

ADMIN_USER='admin' ADMIN_PASSWORD='admin' ADMIN_PASSWORD_HASH='$2a$14$1l.IozJx7xQRVmlkEQ32OeEEfP5mRxTpbDTCTcXRqn19gXD8YK1pO' docker-compose up -d
Caddy v2 does not accept plaintext passwords. It MUST be provided as a hash value. The above password hash corresponds to ADMIN_PASSWORD 'admin'. To know how to generate hash password, refer Updating Caddy to v2
Prerequisites:
- Docker Engine >= 1.13
- Docker Compose >= 1.11
Updating Caddy to v2
Perform a docker run --rm caddy caddy hash-password --plaintext 'ADMIN_PASSWORD' in order to generate a hash for your new password.
ENSURE that you replace ADMIN_PASSWORD with new plain text password and ADMIN_PASSWORD_HASH with the hashed password references in docker-compose.yml for the caddy container.
Containers:
- Prometheus (metrics database)
http://:9090 - Prometheus-Pushgateway (push acceptor for ephemeral and batch jobs)
http://:9091 - AlertManager (alerts management)
http://:9093 - Grafana (visualize metrics)
http://:3000 - NodeExporter (host metrics collector)
- cAdvisor (containers metrics collector)
- Caddy (reverse proxy and basic auth provider for prometheus and alertmanager)
Setup Grafana
Navigate to http://:3000 and login with user admin password admin. You can change the credentials in the compose file or by supplying the ADMIN_USER and ADMIN_PASSWORD environment variables on compose up. The config file can be added directly in grafana part like this
grafana:
  image: grafana/grafana:7.2.0
  env_file:
    - config
and the config file format should have this content
GF_SECURITY_ADMIN_USER=admin
GF_SECURITY_ADMIN_PASSWORD=changeme
GF_USERS_ALLOW_SIGN_UP=false
If you want to change the password, you have to remove this entry, otherwise the change will not take effect
- grafana_data:/var/lib/grafana
Grafana is preconfigured with dashboards and Prometheus as the default data source:
- Name: Prometheus
- Type: Prometheus
- Url: http://prometheus:9090
- Access: proxy
Docker Host Dashboard
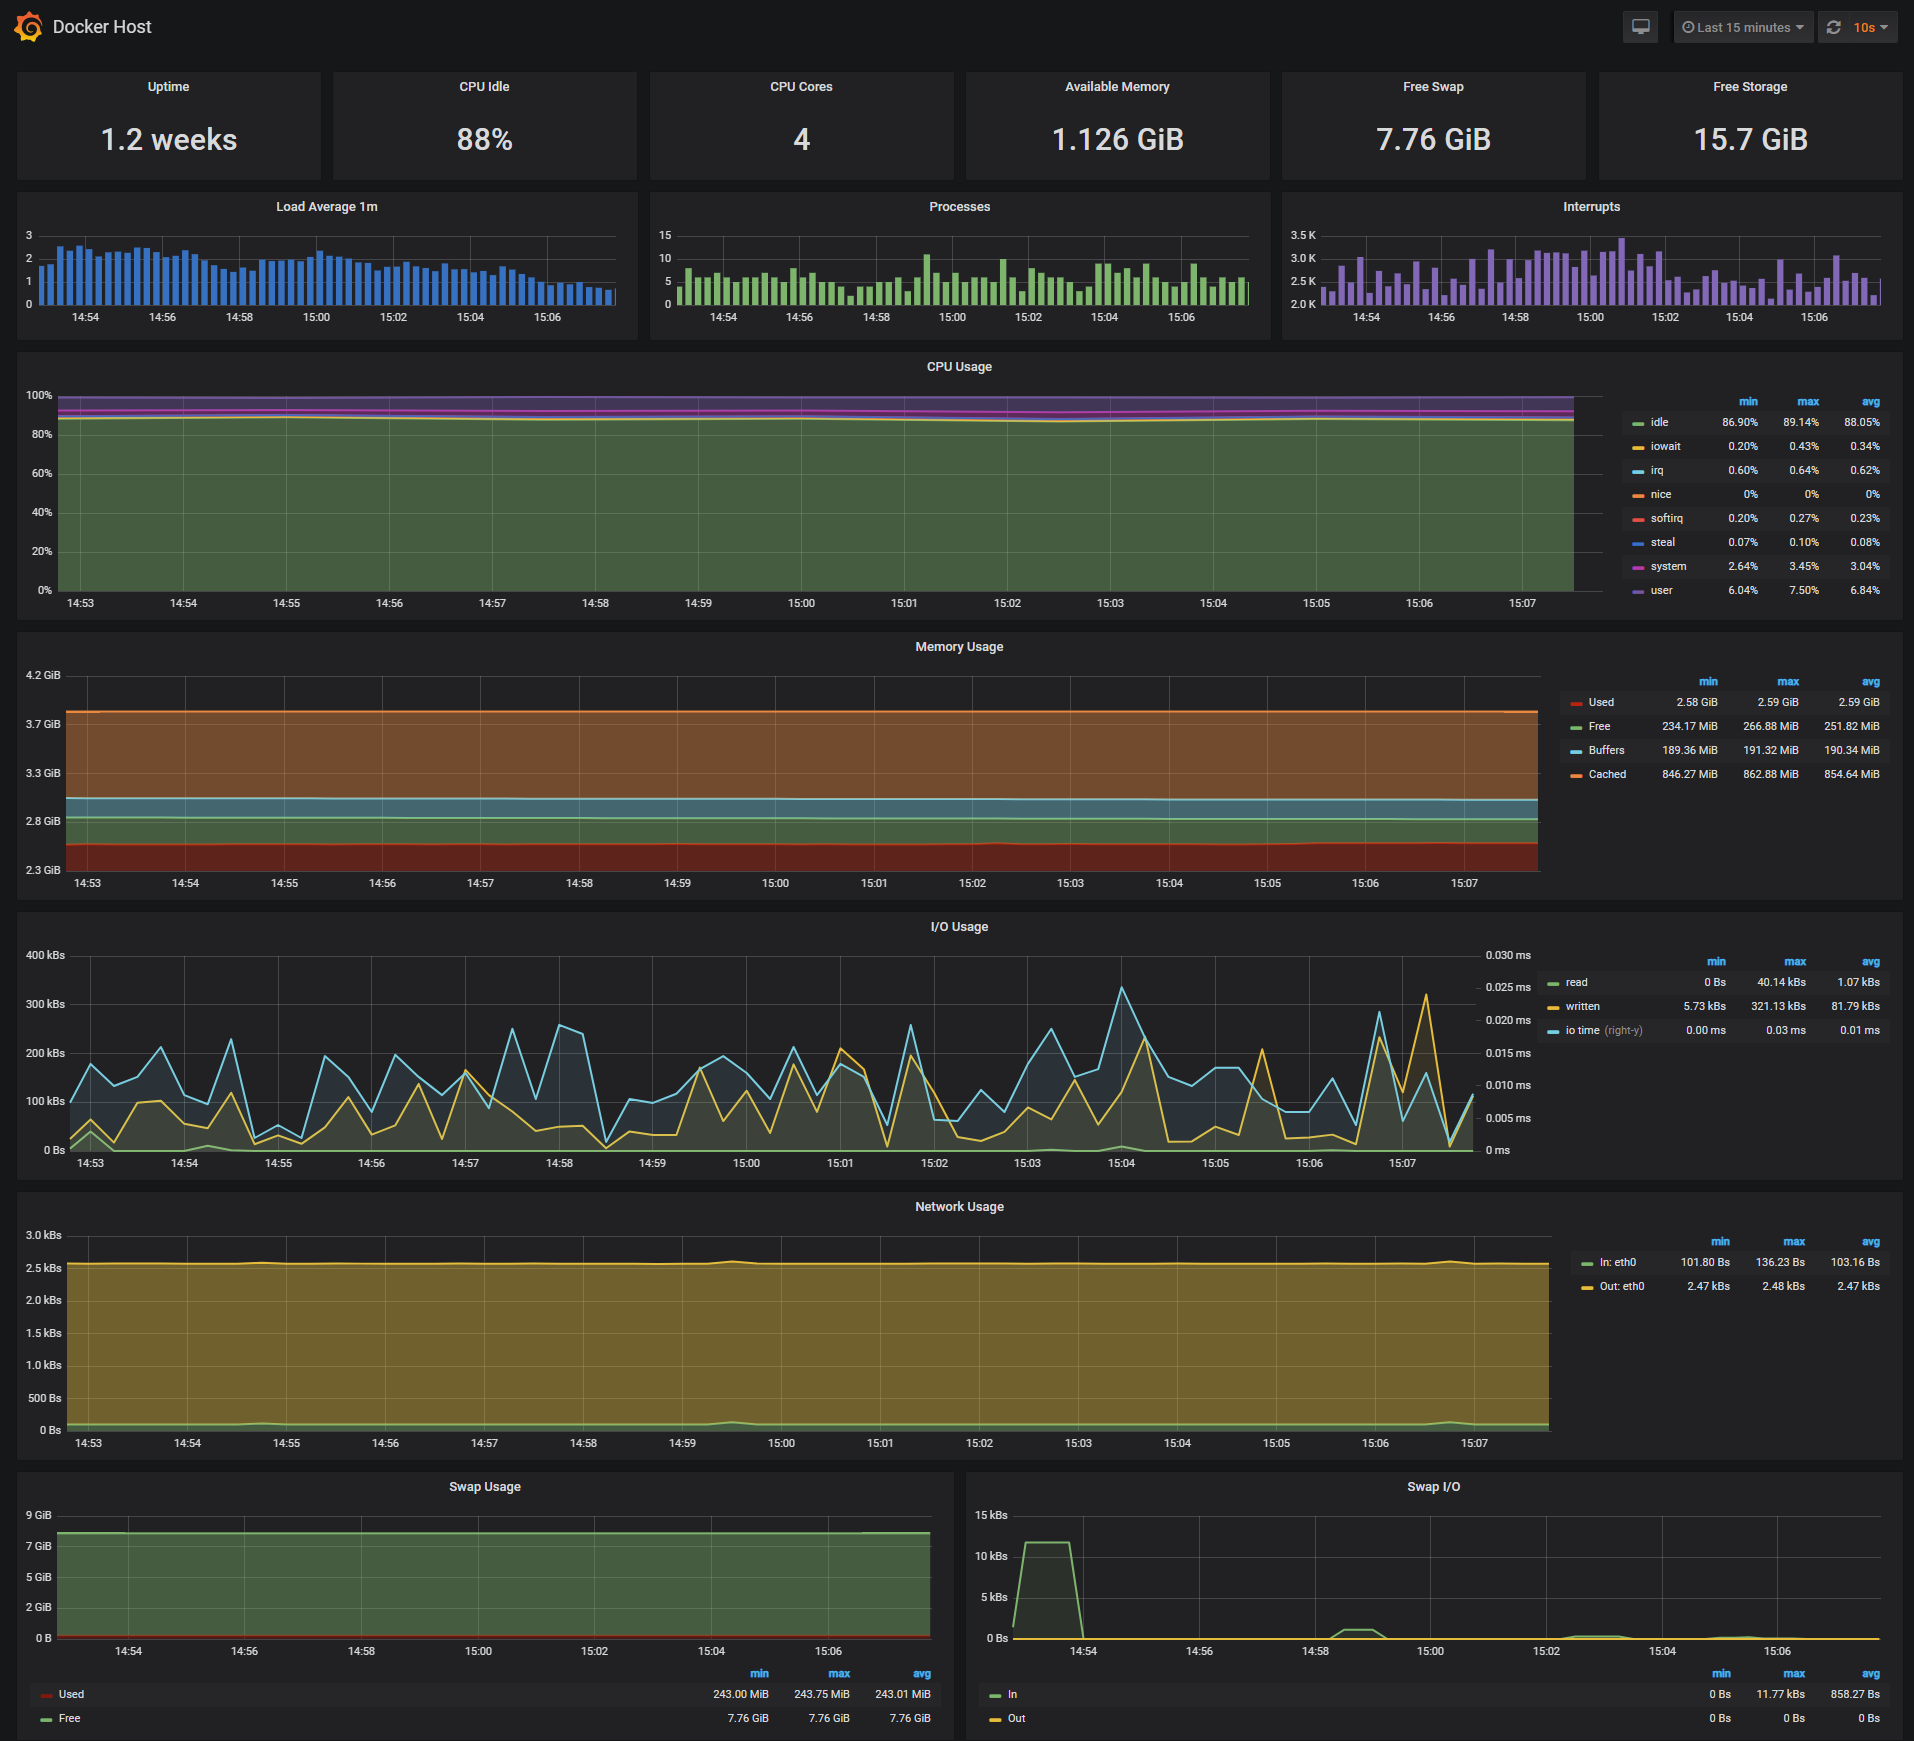
The Docker Host Dashboard shows key metrics for monitoring the resource usage of your server:
- Server uptime, CPU idle percent, number of CPU cores, available memory, swap and storage
- System load average graph, running and blocked by IO processes graph, interrupts graph
- CPU usage graph by mode (guest, idle, iowait, irq, nice, softirq, steal, system, user)
- Memory usage graph by distribution (used, free, buffers, cached)
- IO usage graph (read Bps, read Bps and IO time)
- Network usage graph by device (inbound Bps, Outbound Bps)
- Swap usage and activity graphs
For storage and particularly Free Storage graph, you have to specify the fstype in grafana graph request.
You can find it in grafana/provisioning/dashboards/docker_host.json, at line 480 :
"expr": "sum(node_filesystem_free_bytes{fstype=\"btrfs\"})",
I work on BTRFS, so i need to change aufs to btrfs.
You can find right value for your system in Prometheus http://:9090 launching this request :
node_filesystem_free_bytes
Docker Containers Dashboard
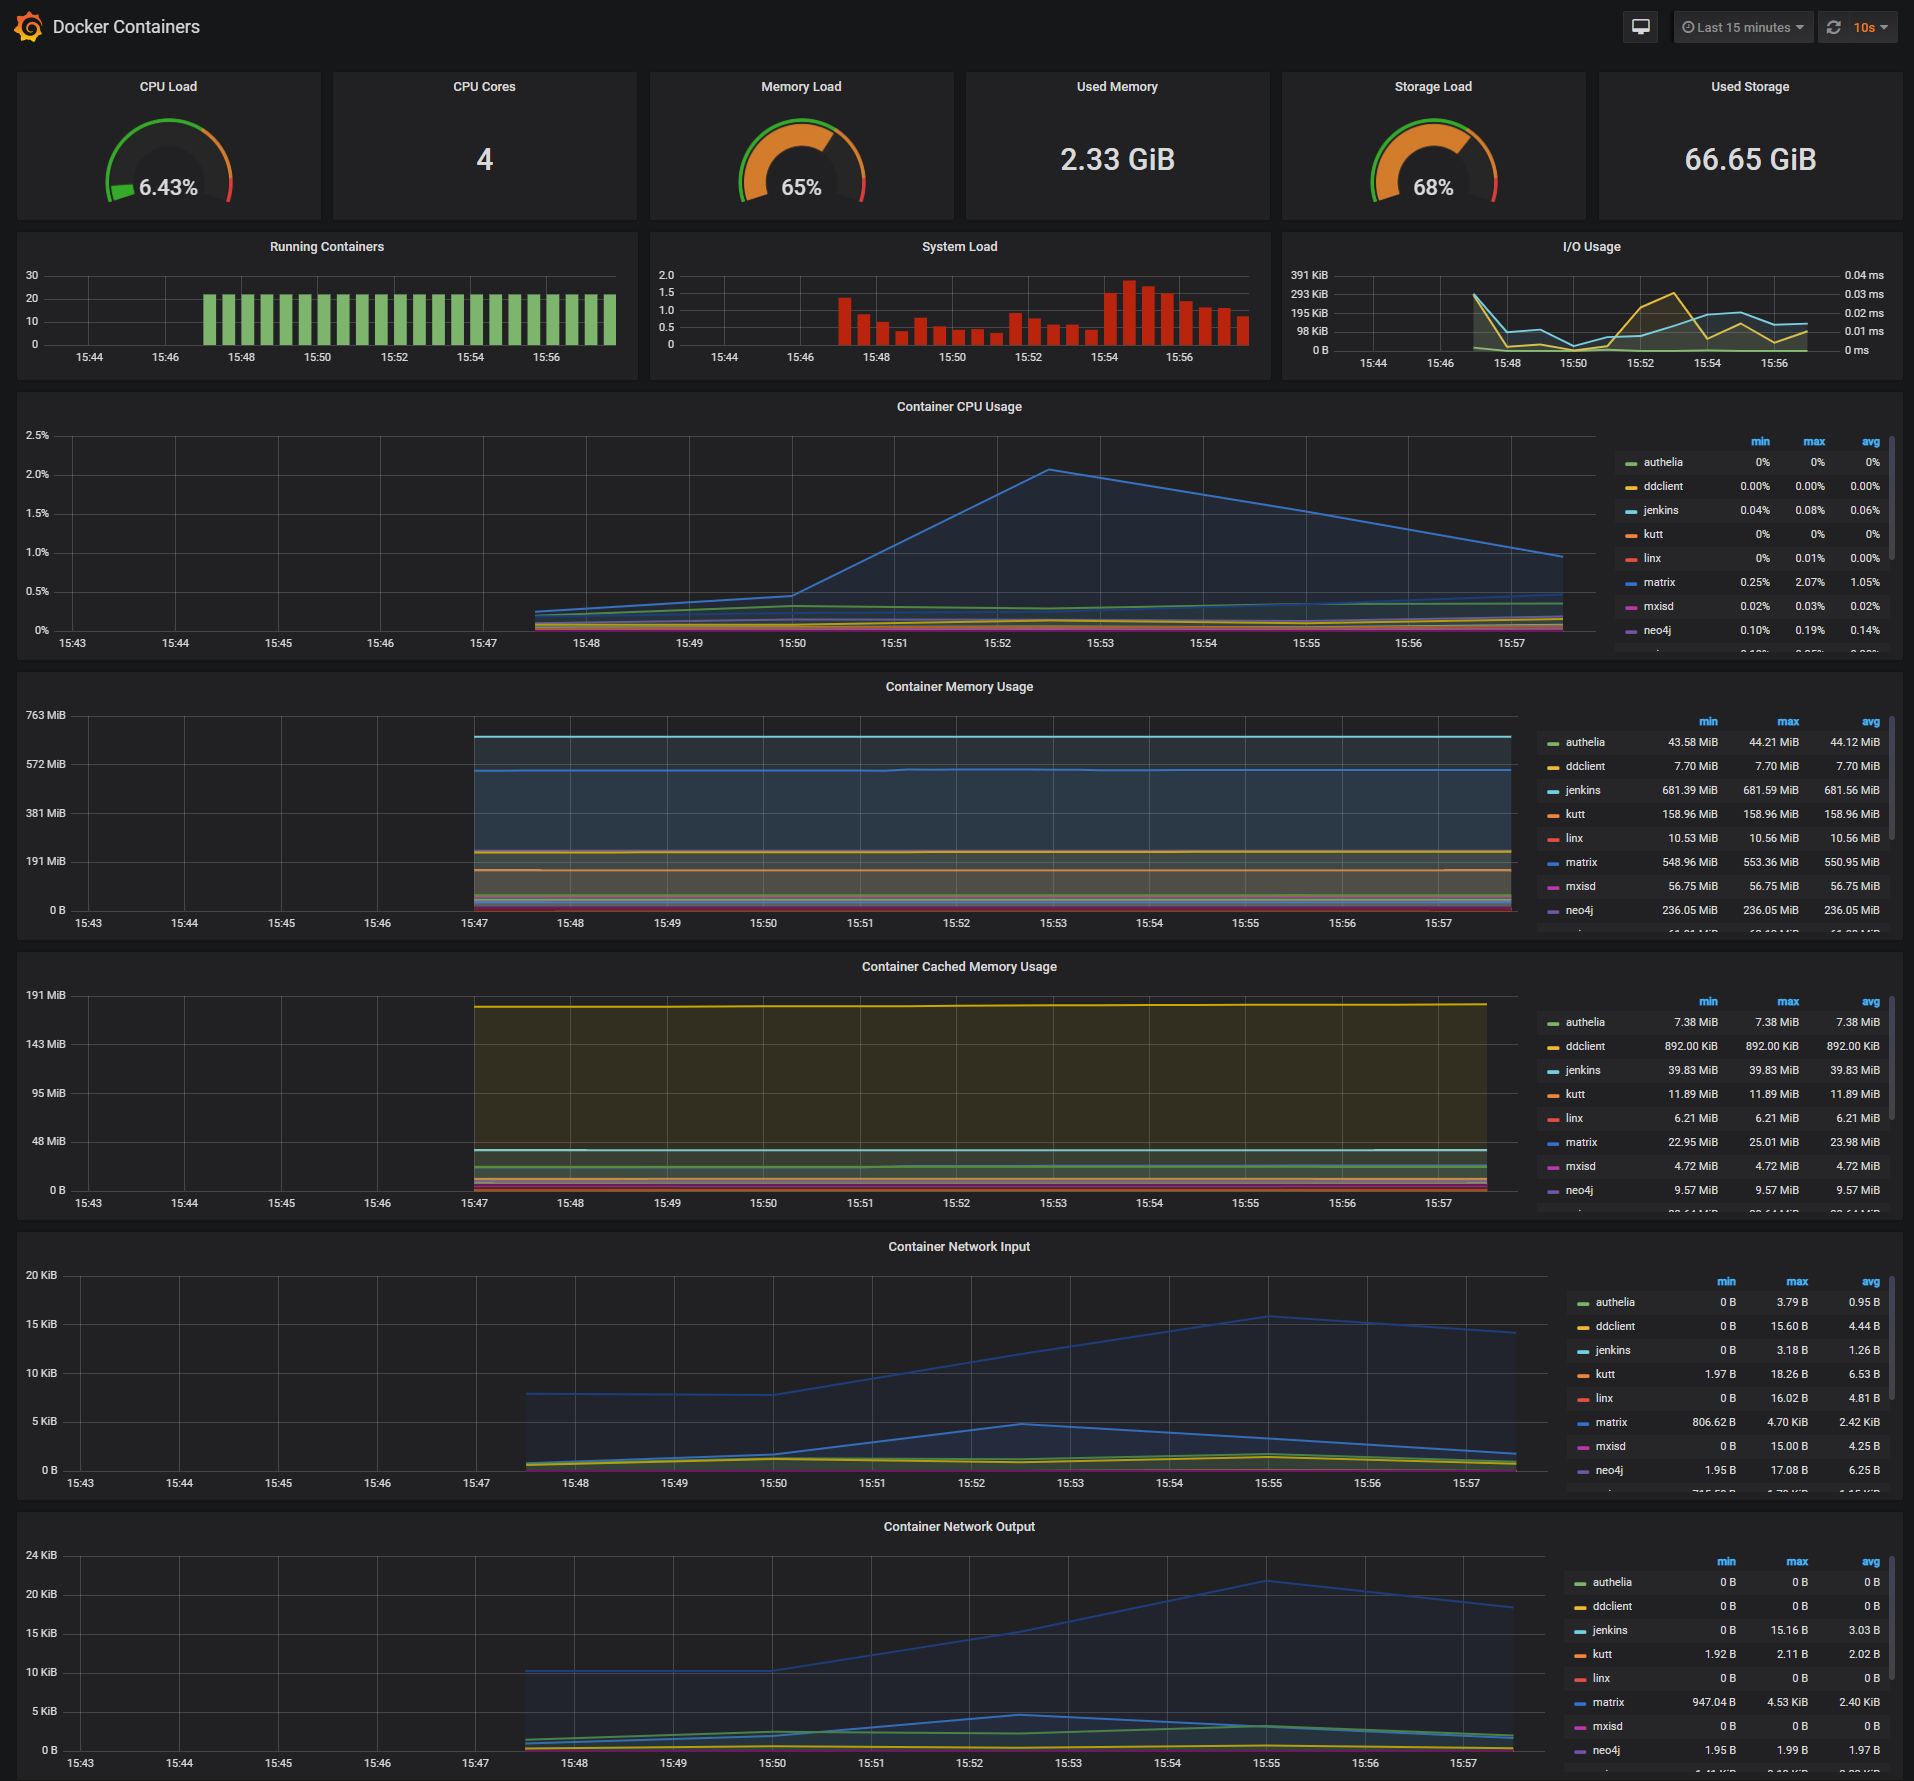
The Docker Containers Dashboard shows key metrics for monitoring running containers:
- Total containers CPU load, memory and storage usage
- Running containers graph, system load graph, IO usage graph
- Container CPU usage graph
- Container memory usage graph
- Container cached memory usage graph
- Container network inbound usage graph
- Container network outbound usage graph
Note that this dashboard doesn't show the containers that are part of the monitoring stack.
For storage and particularly Storage Load graph, you have to specify the fstype in grafana graph request.
You can find it in grafana/provisioning/dashboards/docker_containers.json, at line 406 :
"expr": "(node_filesystem_size_bytes{fstype=\"btrfs\"} - node_filesystem_free_bytes{fstype=\"btrfs\"}) / node_filesystem_size_bytes{fstype=\"btrfs\"} * 100",
I work on BTRFS, so i need to change aufs to btrfs.
You can find right value for your system in Prometheus http://:9090 launching this request :
node_filesystem_size_bytes
node_filesystem_free_bytes
Monitor Services Dashboard
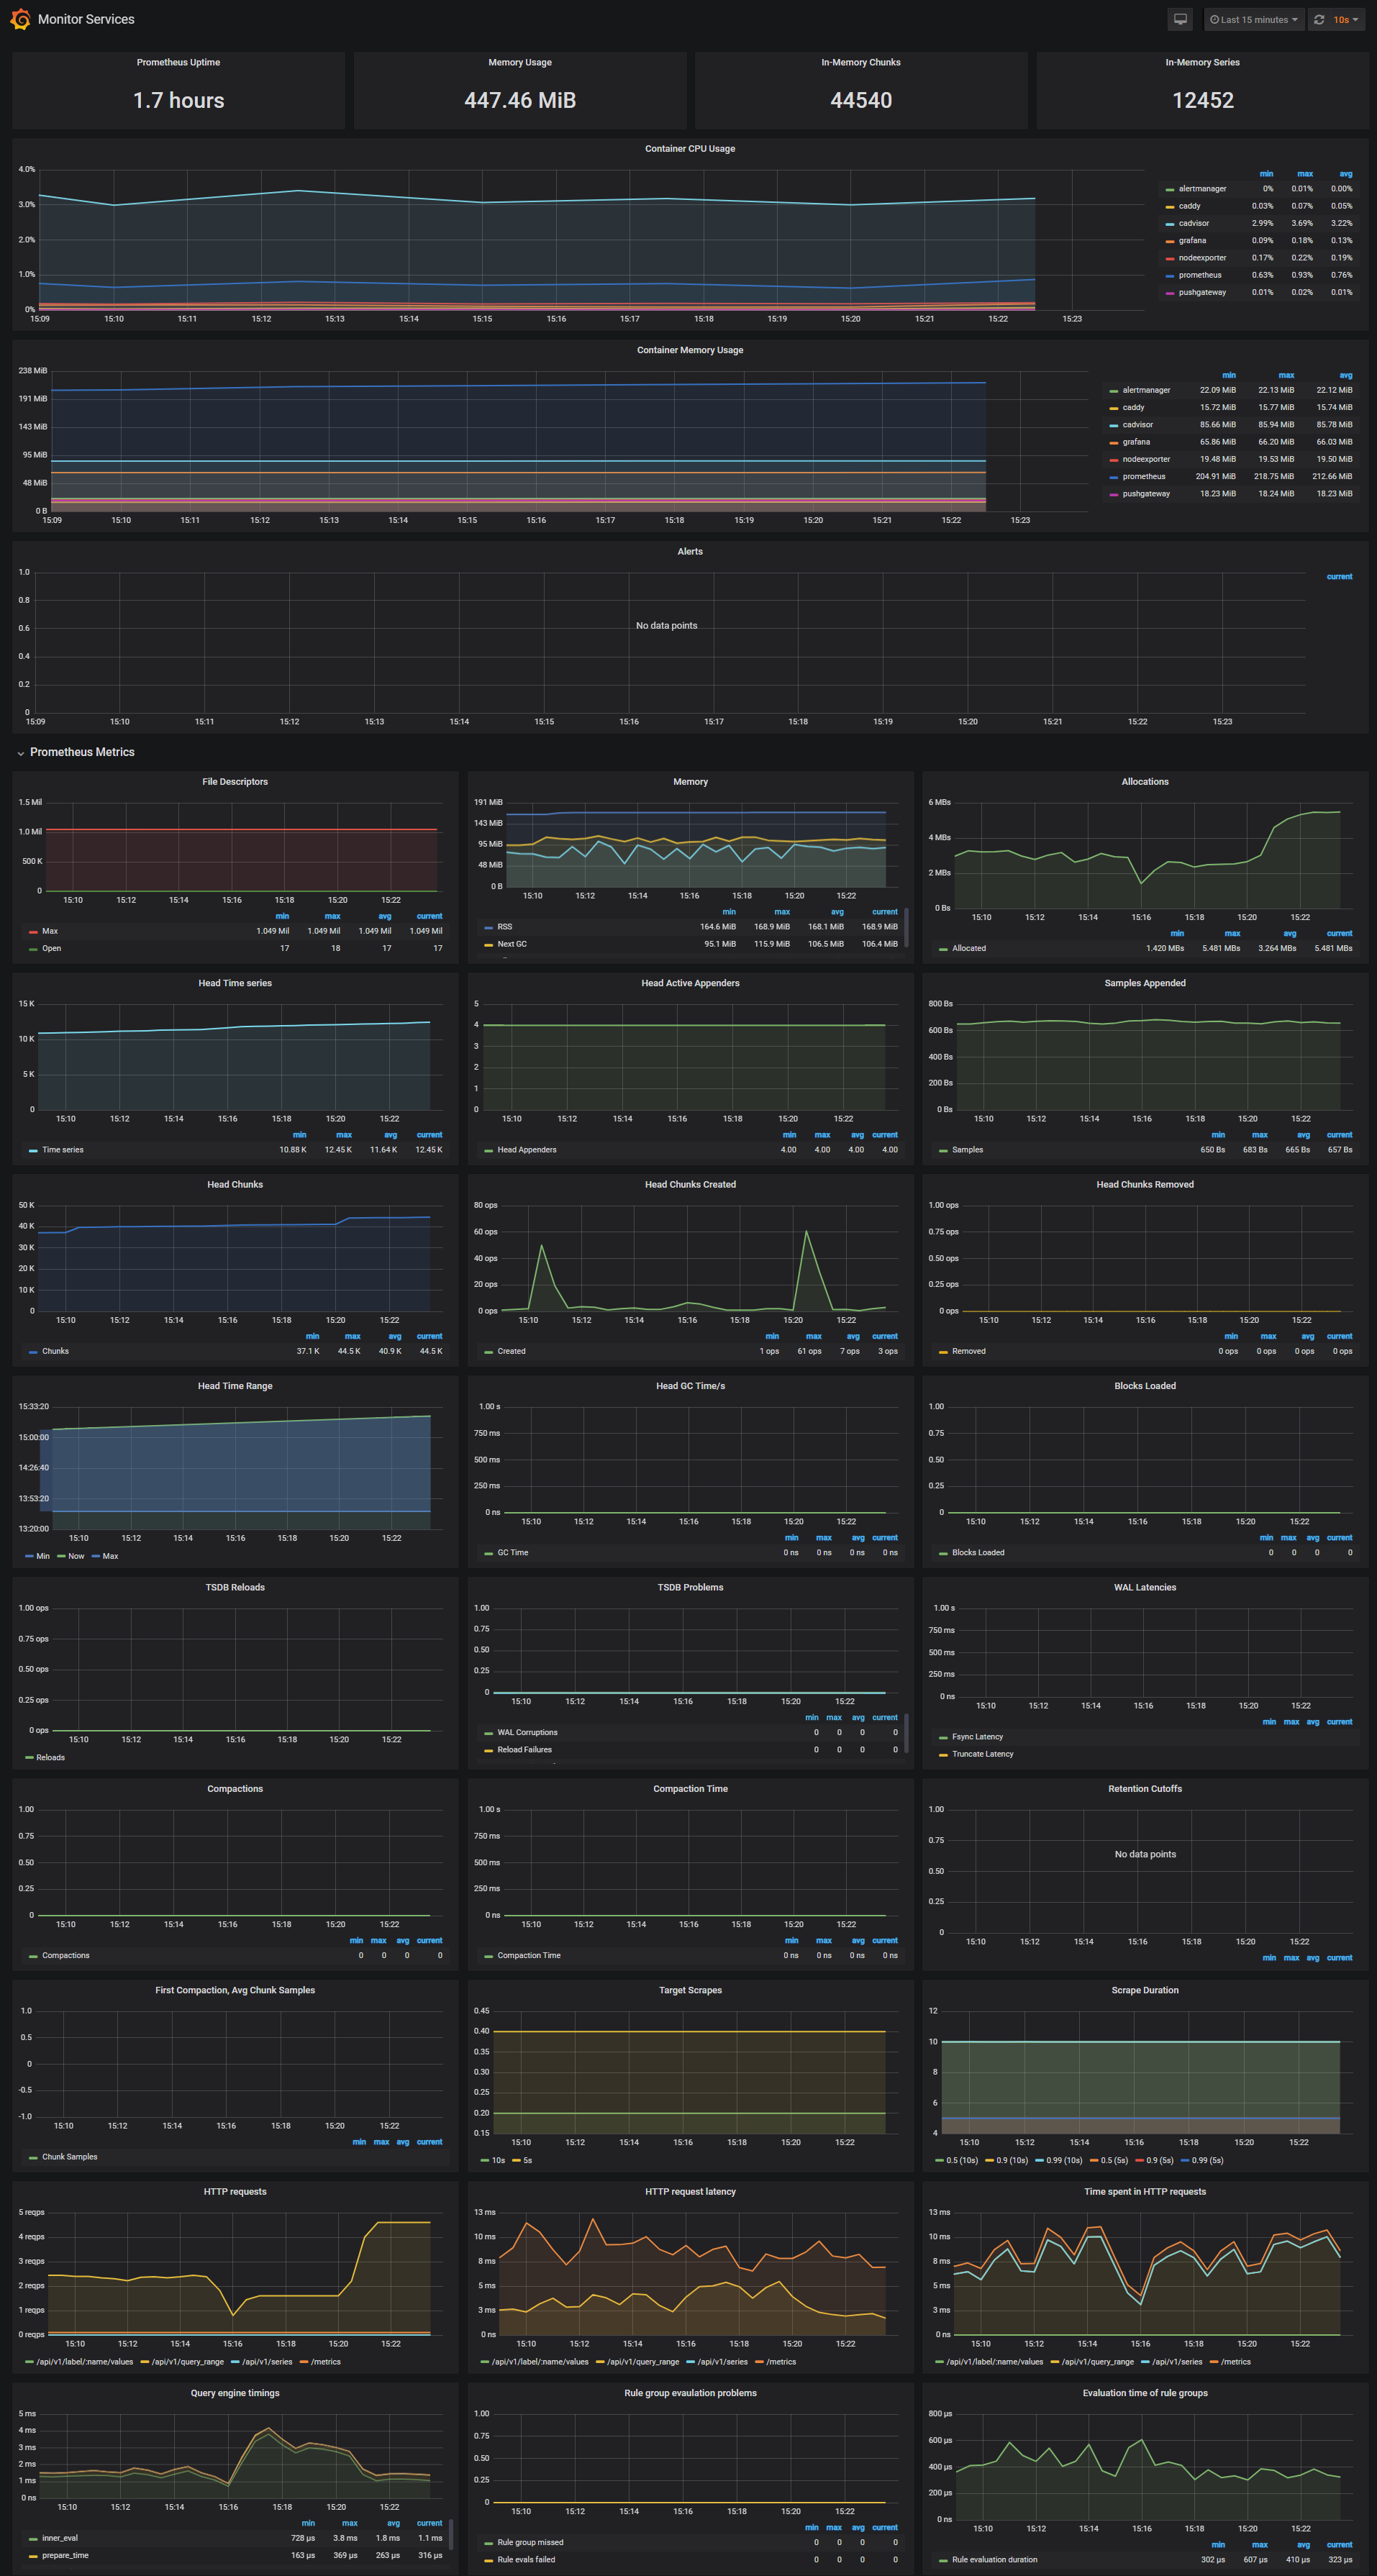
The Monitor Services Dashboard shows key metrics for monitoring the containers that make up the monitoring stack:
- Prometheus container uptime, monitoring stack total memory usage, Prometheus local storage memory chunks and series
- Container CPU usage graph
- Container memory usage graph
- Prometheus chunks to persist and persistence urgency graphs
- Prometheus chunks ops and checkpoint duration graphs
- Prometheus samples ingested rate, target scrapes and scrape duration graphs
- Prometheus HTTP requests graph
- Prometheus alerts graph
Define alerts
Three alert groups have been setup within the alert.rules configuration file:
- Monitoring services alerts targets
- Docker Host alerts host
- Docker Containers alerts containers
You can modify the alert rules and reload them by making a HTTP POST call to Prometheus:
curl -X POST http://admin:admin@<host-ip>:9090/-/reload
Monitoring services alerts
Trigger an alert if any of the monitoring targets (node-exporter and cAdvisor) are down for more than 30 seconds:
- alert: monitor_service_down
    expr: up == 0
    for: 30s
    labels:
      severity: critical
    annotations:
      summary: "Monitor service non-operational"
      description: "Service {{ $labels.instance }} is down."
Docker Host alerts
Trigger an alert if the Docker host CPU is under high load for more than 30 seconds:
- alert: high_cpu_load
    expr: node_load1 > 1.5
    for: 30s
    labels:
      severity: warning
    annotations:
      summary: "Server under high load"
      description: "Docker host is under high load, the avg load 1m is at {{ $value}}. Reported by instance {{ $labels.instance }} of job {{ $labels.job }}."
Modify the load threshold based on your CPU cores.
Trigger an alert if the Docker host memory is almost full:
- alert: high_memory_load
    expr: (sum(node_memory_MemTotal_bytes) - sum(node_memory_MemFree_bytes + node_memory_Buffers_bytes + node_memory_Cached_bytes) ) / sum(node_memory_MemTotal_bytes) * 100 > 85
    for: 30s
    labels:
      severity: warning
    annotations:
      summary: "Server memory is almost full"
      description: "Docker host memory usage is {{ humanize $value}}%. Reported by instance {{ $labels.instance }} of job {{ $labels.job }}."
Trigger an alert if the Docker host storage is almost full:
- alert: high_storage_load
    expr: (node_filesystem_size_bytes{fstype="aufs"} - node_filesystem_free_bytes{fstype="aufs"}) / node_filesystem_size_bytes{fstype="aufs"}  * 100 > 85
    for: 30s
    labels:
      severity: warning
    annotations:
      summary: "Server storage is almost full"
      description: "Docker host storage usage is {{ humanize $value}}%. Reported by instance {{ $labels.instance }} of job {{ $labels.job }}."
Docker Containers alerts
Trigger an alert if a container is down for more than 30 seconds:
- alert: jenkins_down
    expr: absent(container_memory_usage_bytes{name="jenkins"})
    for: 30s
    labels:
      severity: critical
    annotations:
      summary: "Jenkins down"
      description: "Jenkins container is down for more than 30 seconds."
Trigger an alert if a container is using more than 10% of total CPU cores for more than 30 seconds:
- alert: jenkins_high_cpu
    expr: sum(rate(container_cpu_usage_seconds_total{name="jenkins"}[1m])) / count(node_cpu_seconds_total{mode="sy