


Chartbrew is a free, open source frameworks & platforms project written in JavaScript and released under a custom open-source licence. It has 4,059 GitHub stars, 455 forks and 5 open issues, and was last pushed 15 hours ago. On this registry it ranks #19 of 28 tracked projects in Frameworks & Platforms, with 5 head-to-head comparisons available. It gained 1 stars over the last 6 tracked days.

What is Chartbrew?

What it is

Chartbrew is an open-source web application for building and sharing live data dashboards. It sits in the JavaScript developer-tools ecosystem and connects directly to APIs, SQL databases, and NoSQL databases so users can turn query results and request responses into charts. The project provides a chart builder, editable dashboards, embeddable charts, a query and request editor, team capabilities, scheduling, and an AI assistant.

The concrete problem it solves is the gap between raw data sources and presentable reporting. Teams often need to combine API responses, MySQL or PostgreSQL data, MongoDB or Firestore data, and other sources into a shared view without building a custom dashboard from scratch. Chartbrew gives those teams a self-hostable or hosted platform for creating, arranging, and sharing visualizations from connected sources.

Key capabilities

  • Chartbrew connects to databases and APIs, including MySQL, PostgreSQL, MongoDB, Firestore, Firebase, and API endpoints listed in the project topics and description.
  • The chart builder creates charts, and the chartjs topic indicates Chart.js-based visualization support.
  • Editable dashboards can be arranged and shared as live reporting views.
  • Embeddable charts can be placed into other pages or applications.
  • The query and requests editor lets users edit database queries and API requests.
  • Team capabilities support collaborative use.
  • The GitHub description lists scheduling and an AI assistant.

Who uses it and how

  • Developers and analysts use Chartbrew to create dashboards from APIs and databases instead of writing a custom reporting interface.
  • Teams use the platform to share live dashboards internally or embed charts into existing products.
  • Self-hosters run Chartbrew locally with NodeJS v22 or newer, a MySQL 5 or PostgreSQL 12.5 database, and Redis v6 or newer for development or deployment.
  • Operators deploy Chartbrew with Docker using the razvanilin/chartbrew image or on DigitalOcean through a 1-click droplet.
  • Users who prefer a managed option can use Chartbrew as a service.

Getting started

Typical local setup uses git clone, npm run setup, required environment variables in chartbrew/.env, and separate frontend and backend commands, with the app available at http://localhost:4018. Docker deployment pulls razvanilin/chartbrew and requires a running MySQL server, an empty database, a 32-byte AES encryption key, and Redis configuration; a hosted service and DigitalOcean droplet are also mentioned.

When to use it — and when not to

Chartbrew fits teams that want an open-source dashboard platform for APIs and databases and are willing to operate the required infrastructure. It is less suitable for users who want a fully managed tool without handling MySQL or PostgreSQL, Redis, environment variables, encryption keys, and BullMQ admin credentials. The facts also list the license as NOASSERTION, so prospective users should verify the license terms before adoption.

project readme (upstream, from github) — read inline

ChartBrew logo

Docker Pulls CI Status

Chartbrew is an open-source web application that can connect directly to databases and APIs and use the data to create beautiful charts. It features a chart builder, editable dashboards, embedable charts, query & requests editor, and team capabilities.

Chartbrew as a service is available here
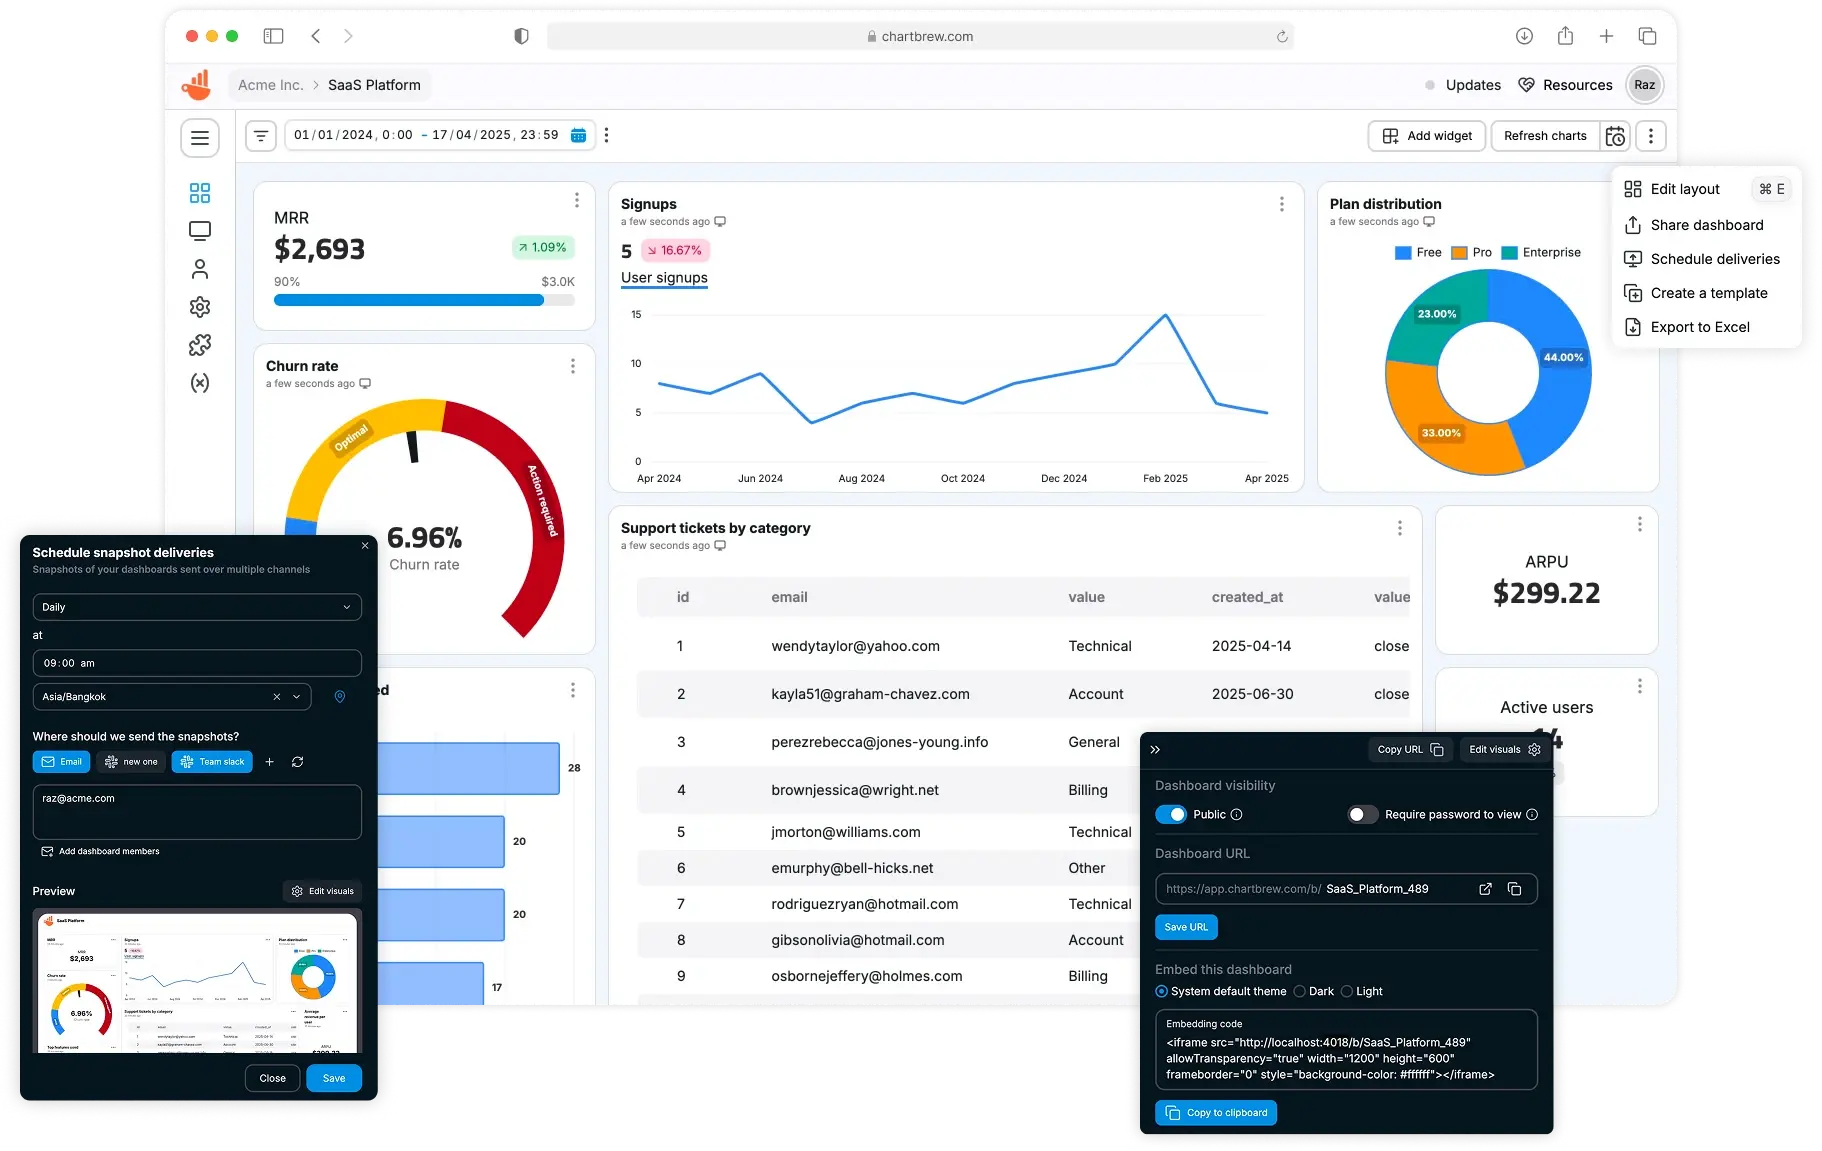

ChartBrew dashboard


📚 Read the full docs here

💡 Have any ideas or discussion topics?

💬 Join our Discord

Data sources

Check Chartbrew's website for the latest list of supported data sources

Prerequisites

  • NodeJS v22+
  • MySQL (5+) or PostgreSQL (12.5+)
  • Redis (v6+)

Start

It is recommended you head over to the more detailed documentation to find out how to set up Chartbrew

📚 You can find it here

Set up Chartbrew locally

Create a new database

Chartbrew can run on MySQL or PostgreSQL. Create an empty database that Chartbrew can use.

Clone and setup

git clone https://github.com/chartbrew/chartbrew.git
cd chartbrew && npm run setup

Complete the required environmental variables in chartbrew/.env. Check out which need to be set here.

Run the project in Development

Open two terminals, one for front-end and the other for back-end.

# frontend
cd client/
npm run start

# backend
cd server/
npm run start-dev

Head over to http://localhost:4018 to see the app running and create your first user account.

Deploy Chartbrew on DigitalOcean

Chartbrew can be deployed on DigitalOcean using the 1-click droplet from the marketplace. This allows you to quickly set up and run Chartbrew with minimal configuration.

Deploy to DigitalOcean

Run with Docker

Check the full guide in the docs.

Quickstart

A Chartbrew docker image is built whenever a new version is released.

Before running the commands below, make sure you have a MySQL server already running and an empty database that Chartbrew can use. The database name should match the value of the CB_DB_NAME variable.

You will need a 32 bytes AES encryption key for the CB_ENCRYPTION_KEY variable. Run the following command to generate one:

node -e "console.log(require('crypto').randomBytes(32).toString('hex'))"

The BullMQ admin dashboard at /apps/queues is protected with HTTP Basic Auth. Set CB_BULLMQ_USERNAME and CB_BULLMQ_PASSWORD; for local .env installations, Chartbrew defaults the username to chartbrew and generates a random password on first startup.

docker pull razvanilin/chartbrew

docker run -p 4019:4019 -p 4018:4018 \
  -e CB_ENCRYPTION_KEY=your_32_bytes_key \
  -e CB_BULLMQ_USERNAME=chartbrew \
  -e CB_BULLMQ_PASSWORD=your_strong_random_password \
  -e CB_API_HOST=0.0.0.0 \
  -e CB_API_PORT=4019 \
  -e CB_DB_HOST=host.docker.internal \
  -e CB_DB_PORT=3306 \
  -e CB_DB_NAME=chartbrew \
  -e CB_DB_USERNAME=root \
  -e CB_DB_PASSWORD=password \
  -e CB_REDIS_HOST=host.docker.internal \
  -e CB_REDIS_PORT=6379 \
  -e CB_REDIS_PASSWORD=password \
  -e VITE_APP_CLIENT_HOST=http://localhost:4018 \
  -e VITE_APP_CLIENT_PORT=4018 \
  -e VITE_APP_API_HOST=http://localhost:4019 \
  razvanilin/chartbrew

Acknowledgements

Many thanks to everybody that contributed to this open-source project 🙏

Start here if you want to become a contributor

Frequently asked questions

Is Chartbrew free to use?

Chartbrew is open source. There is no licence fee and no seat count — you can self-host it or, where the project offers one, pay a vendor for a managed version instead.

What does Chartbrew do?

Create stunning data visualizations with ease

What is Chartbrew written in?

Chartbrew is primarily written in JavaScript. Its source is publicly available at https://github.com/chartbrew/chartbrew, and it has 4,059 GitHub stars.