XCharts is a free, open source business intelligence & reporting project written in C# and released under MIT. It has 3,801 GitHub stars, 596 forks and 8 open issues, and was last pushed 4 months ago. On this registry it ranks #33 of 79 tracked projects in Business Intelligence & Reporting, with 5 head-to-head comparisons available. It gained 11 stars over the last 30 tracked days.

What is XCharts?

XCharts is a free, MIT-licensed charting and data visualization library for Unity that renders line, bar, pie, radar, scatter, heatmap, candlestick, polar and parallel-coordinate charts entirely in code on top of UGUI, aimed at Unity developers who need in-engine dashboards, analytics views or data-driven UI without shipping extra textures or shaders.

What it is

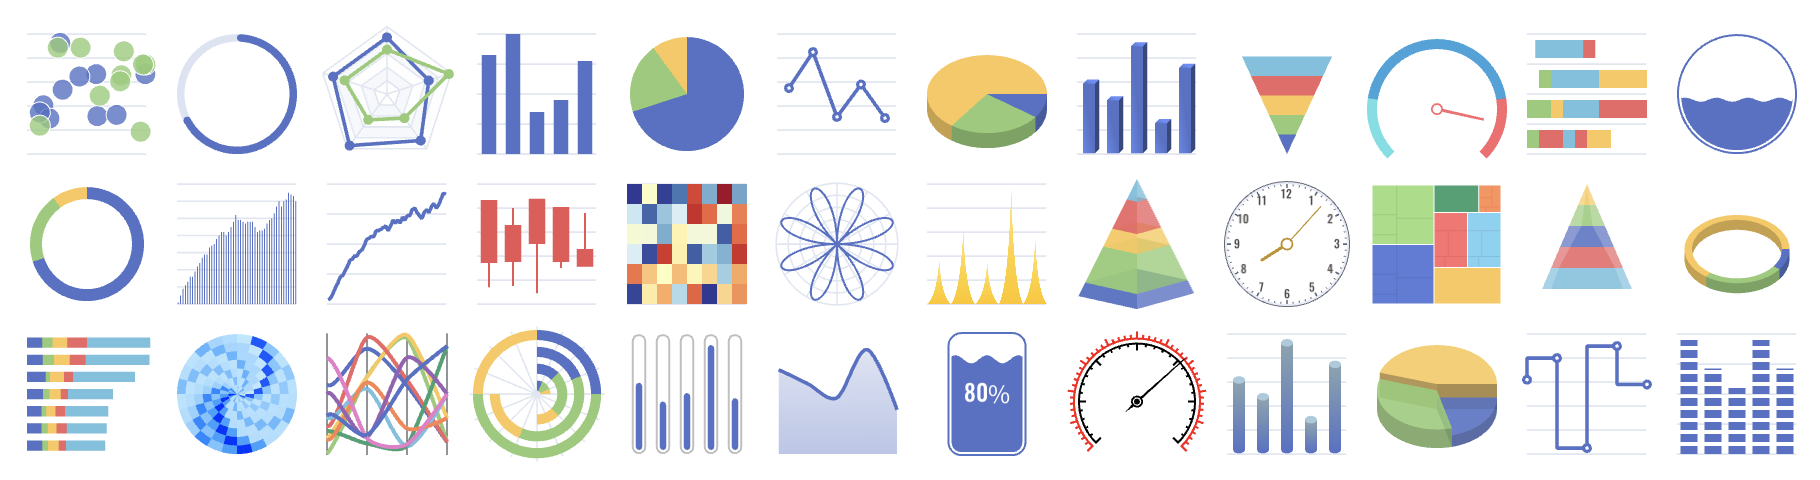
XCharts lives in the Unity ecosystem as a package that plugs into the UGUI (Unity GUI) system and draws charts programmatically. It is written in C# and distributed as a unitypackage or as raw source, and it is imported directly into a Unity project rather than installed through a separate runtime. The library provides both built-in chart types, such as line, bar, pie, radar, scatter, heatmap, ring, candlestick, polar and parallel coordinates, and a set of extended charts covering 3D pie, 3D bar, 3D pyramid, funnel, gauge, liquid fill, pictorial bar, Gantt, treemap, Sankey, 3D line and relation graphs.

The concrete problem it solves is charting inside Unity without hand-rolling mesh generation or relying on external rendering stacks. Charts are generated fully in code, so no extra textures or Shader assets are required, which keeps builds lightweight. Configuration can be authored visually in the Inspector and previewed live in the Game view, then changed at runtime through code. It replaces the need for bespoke drawing code or third-party web charting embedded into a Unity application, though data sources such as Excel files or databases must still be parsed by the developer before being pushed into the chart through the XCharts API.

Key capabilities

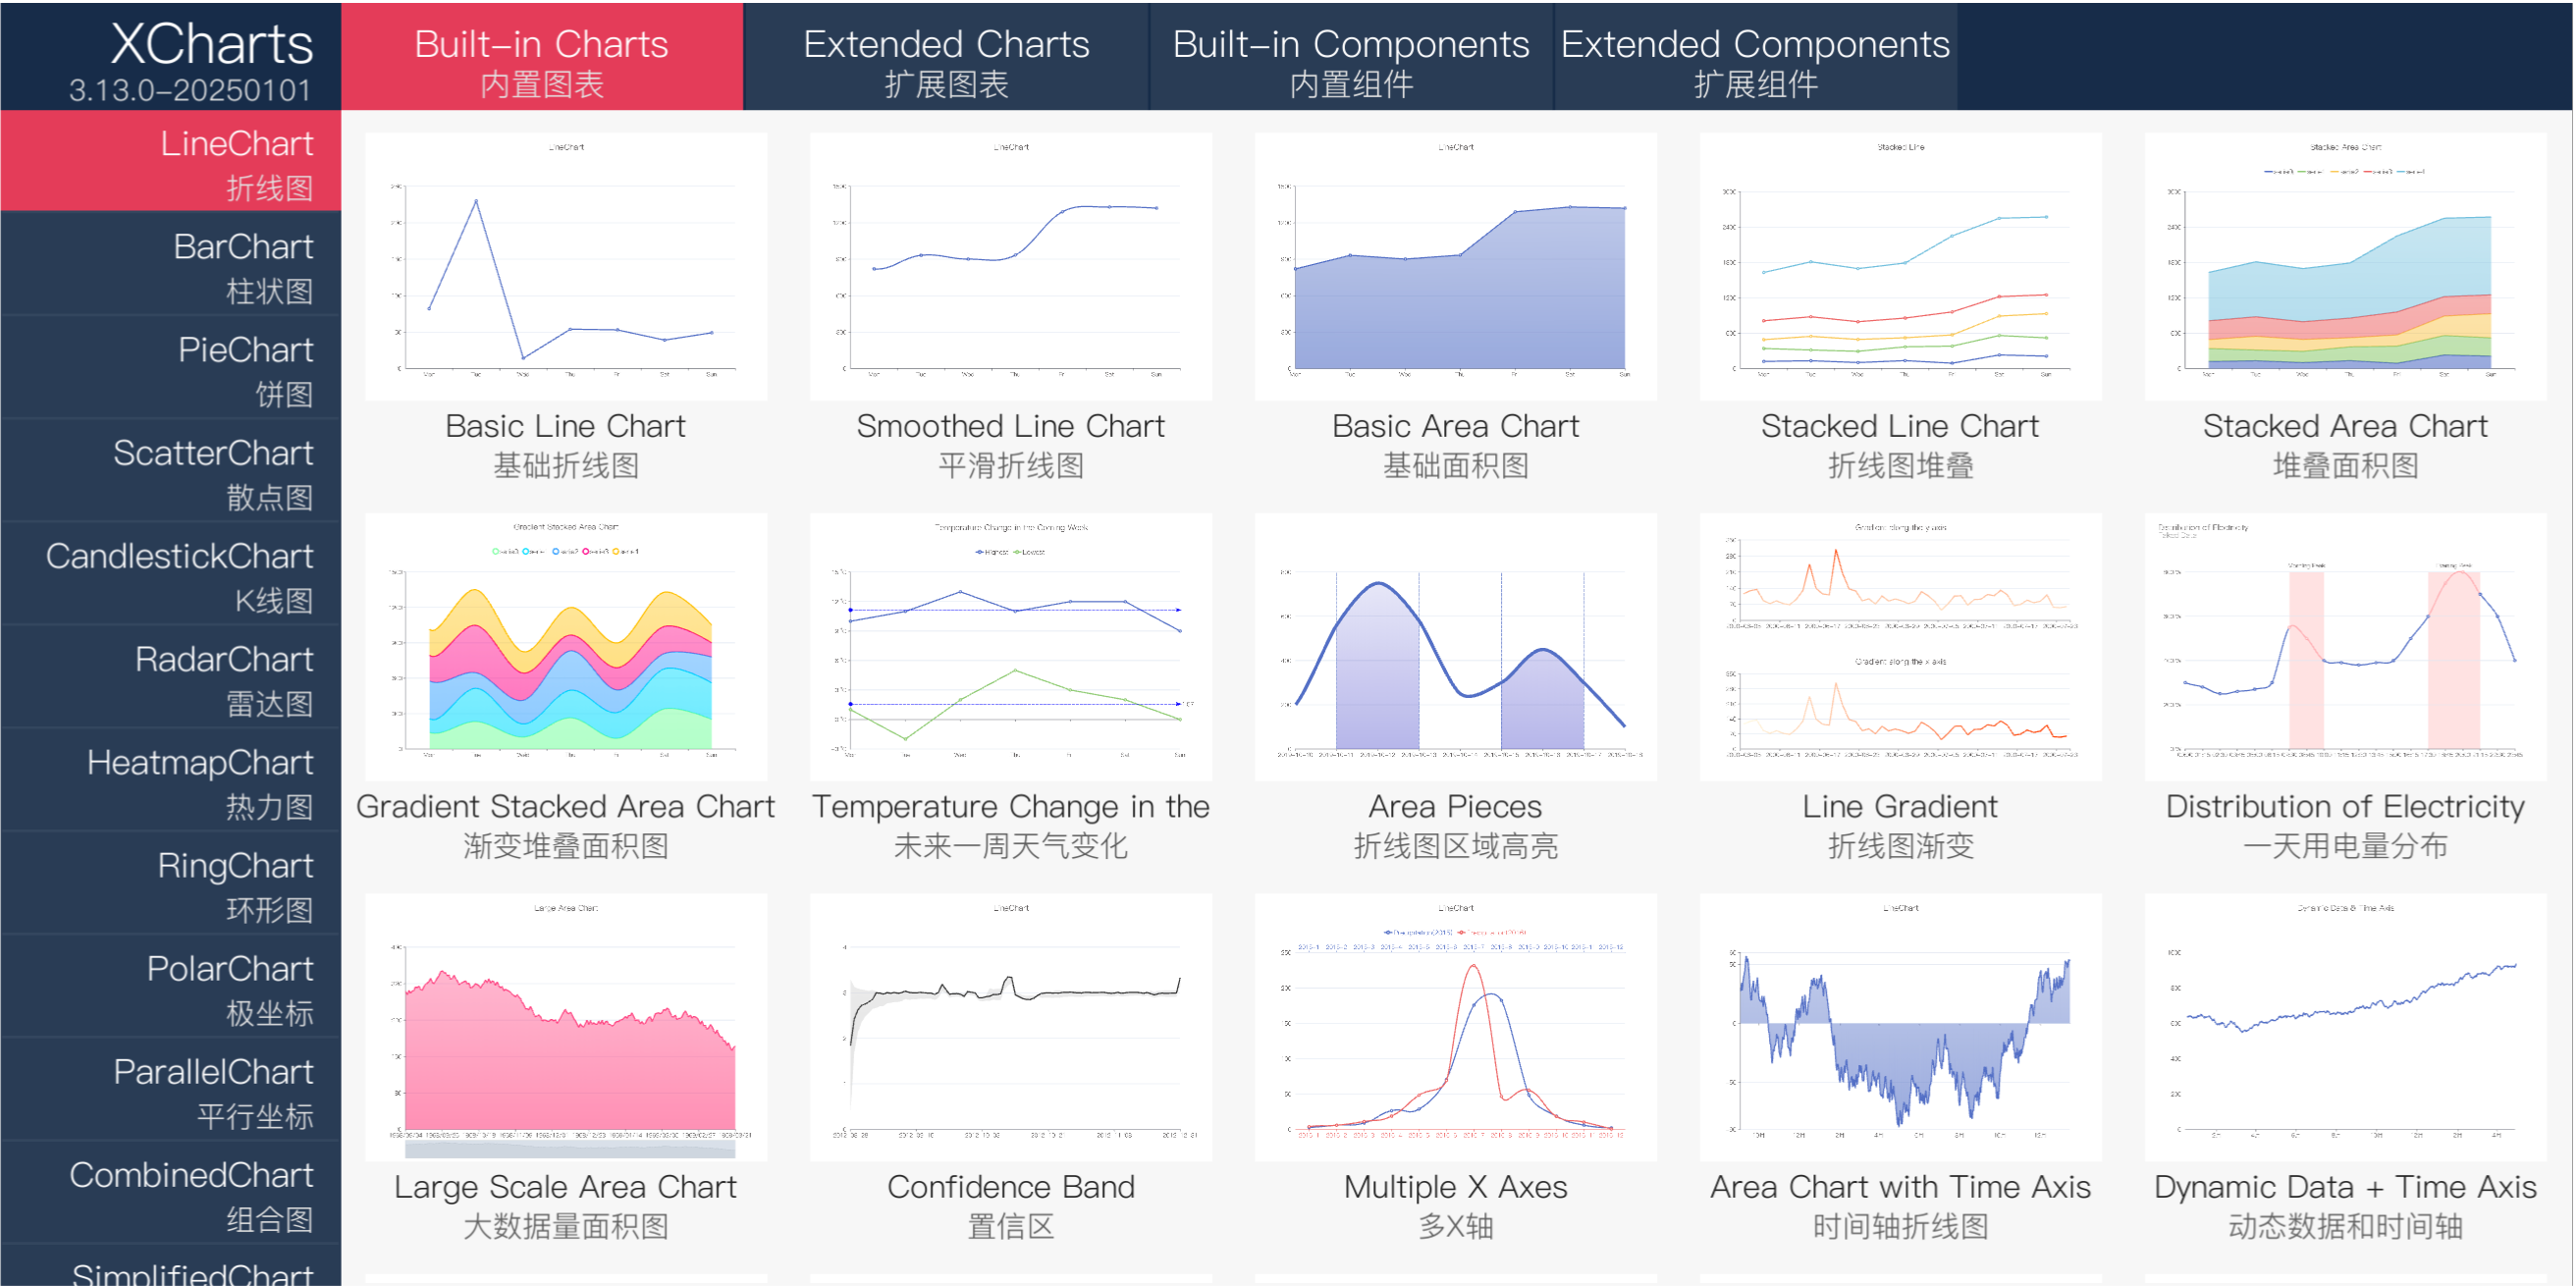
  • Built-in charts include line, bar, pie, radar, scatter, heatmap, ring, candlestick, polar and parallel coordinates.
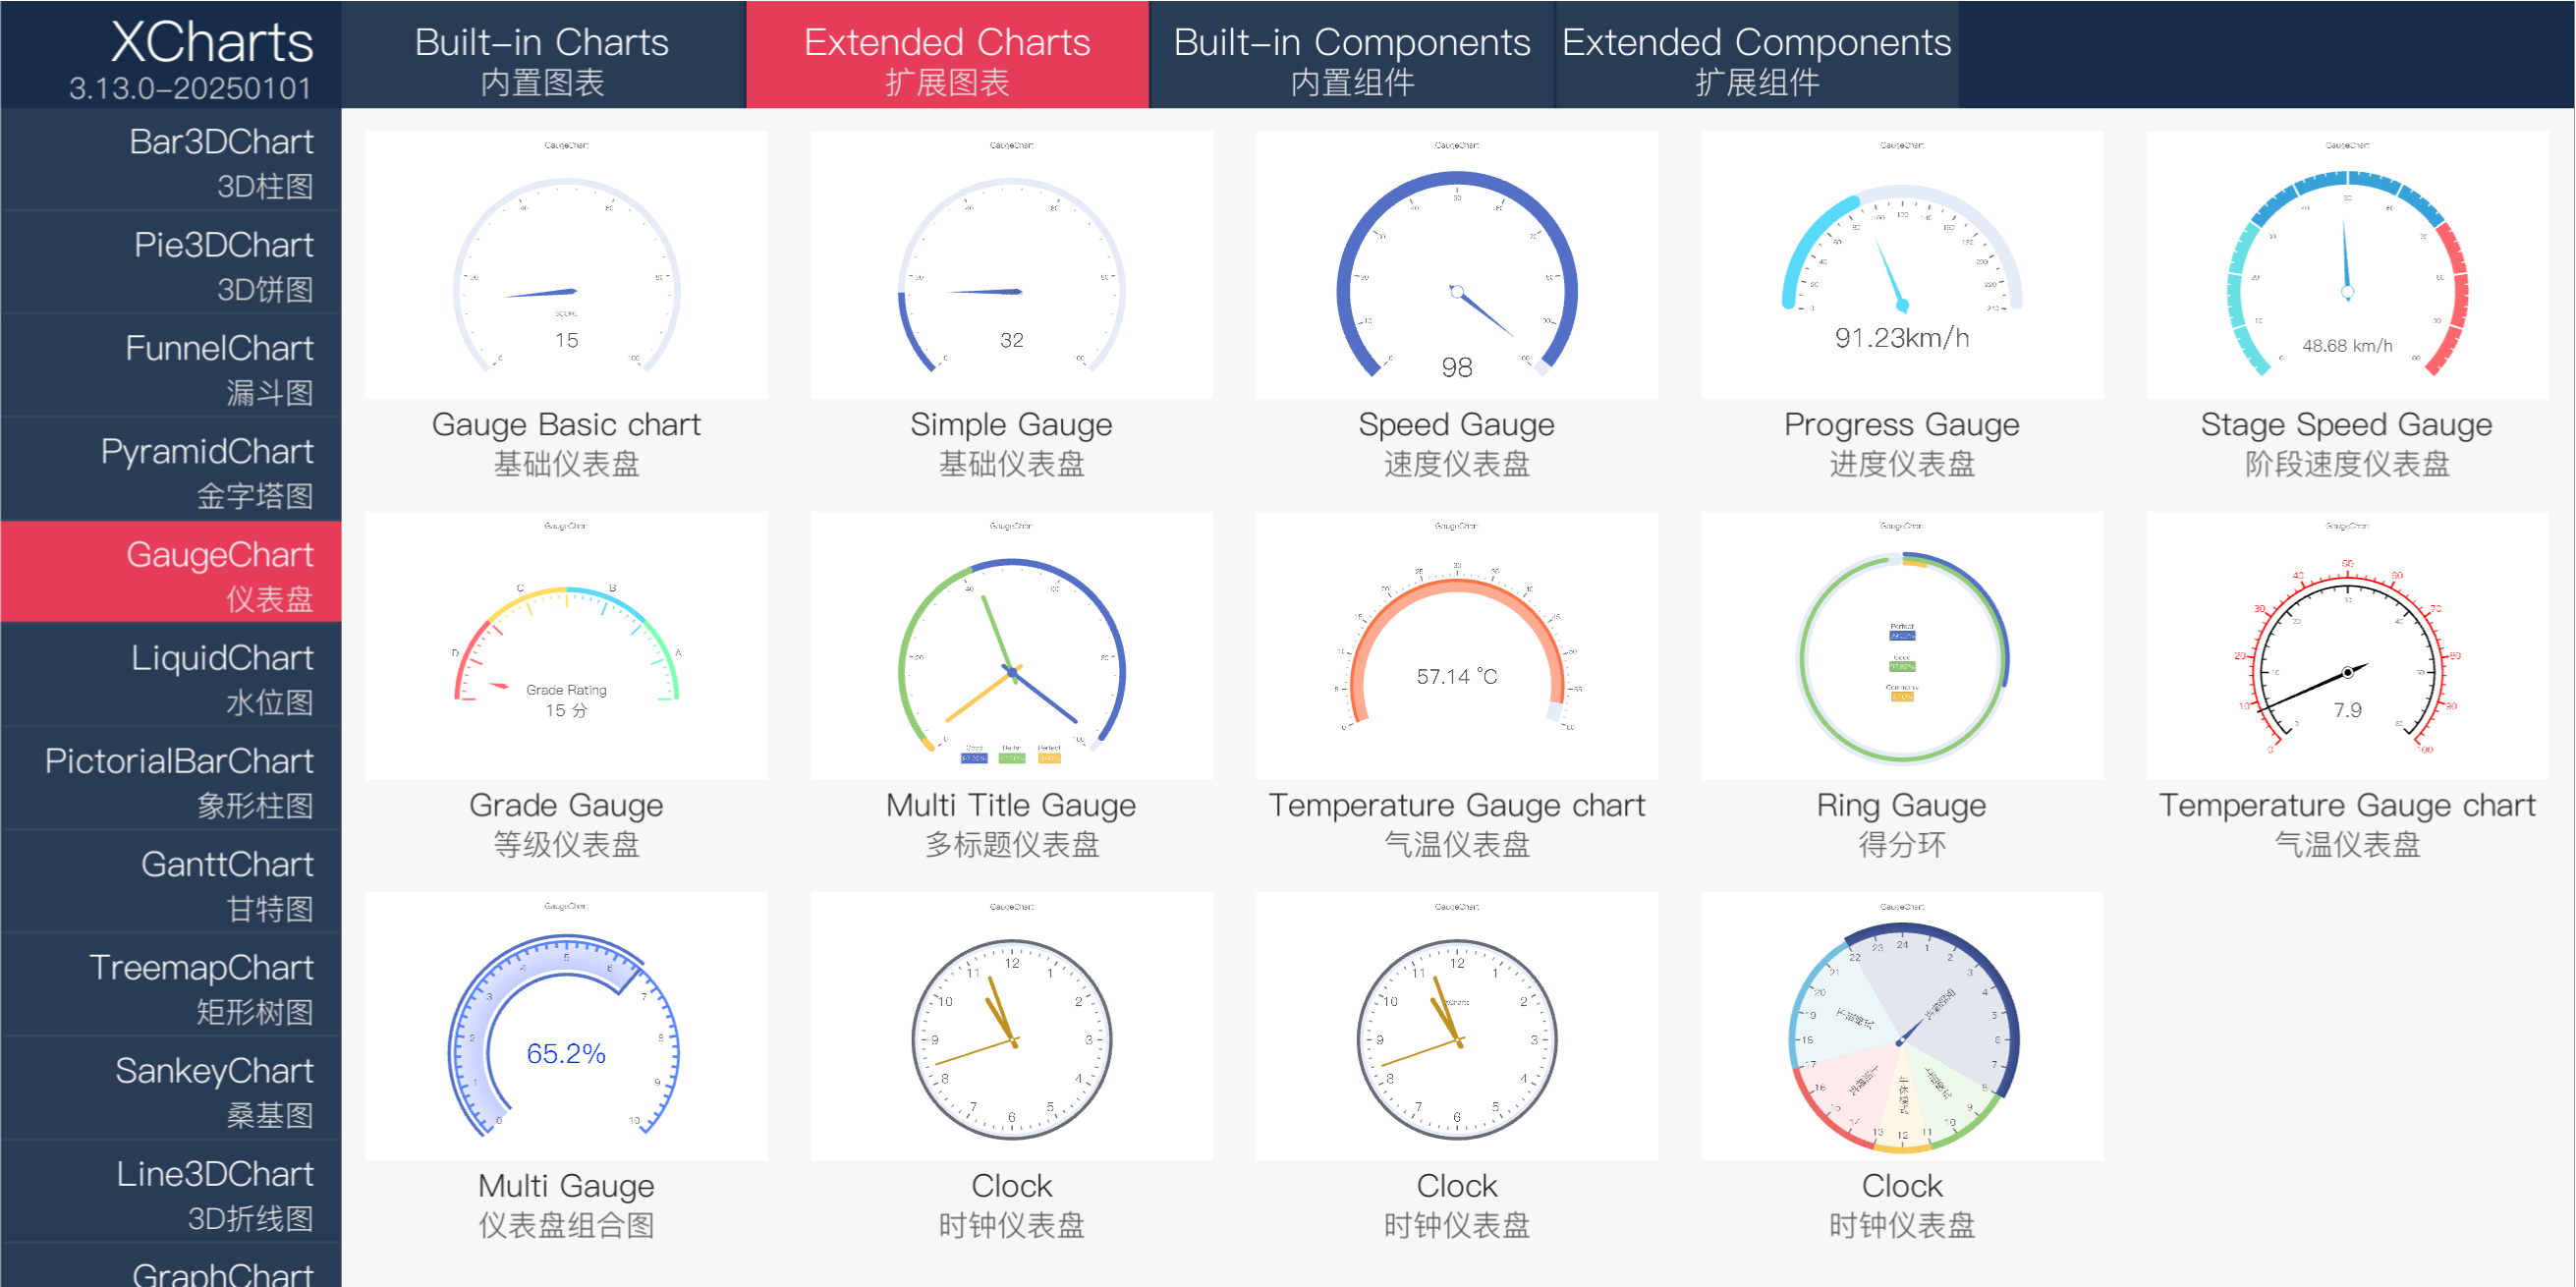
  • Extended charts include 3D pie, 3D bar, 3D pyramid, funnel, gauge, liquid fill, pictorial bar, Gantt, treemap, Sankey, 3D line and relation graphs.
  • Pure code rendering with no external textures or Shader assets required.
  • Visual configuration through the Add Serie and Add Main Component buttons in the Inspector, with live preview and runtime modification of configuration and data.
  • Multiple coordinate systems, including rectangular, polar and single-axis.
  • Components such as title, legend, tooltip, mark line, mark area, data area zoom and visual mapping.
  • Line styles covering straight, curved, dashed, area and step lines; bar styles covering grouped, stacked, stacked-percentage, zebra and capsule bars; pie styles covering ring, rose and ring-rose.
  • Large data support of roughly 20,000 points on a single line chart, with sampling available to push further at higher CPU cost.
  • Themes with light and dark defaults, plus theme import and export.
  • Animation and interaction, including fade-in, fade-out, change and add animations, data filtering, view zoom and detail display.
  • Integration with TextMeshPro and the New Input System.
  • Compatibility with Unity 5.6 and above, and all platforms that support UGUI.

Who uses it and how

  • Unity developers building in-engine dashboards, analytics panels or reporting views who need charts that render inside the game or application rather than in an external browser.
  • Teams targeting multiple platforms, since the library is designed to run wherever Unity runs and supports Unity 5.6 and above.
  • Projects that need custom drawing work, using the drawing API to add points, lines and surfaces, or to override drawing logic and callbacks.
  • Applications combining several chart types in one view, since multiple charts of the same or different types can be composed inside a single chart.
  • Scenes needing interactive data exploration, using built-in data filtering, view zoom and detail display, plus animation for transitions.

Getting started

Import the XCharts unitypackage or the source into the project, and it is recommended to also import the XCharts-Daemon companion. After import, right-click in the Hierarchy view and choose XCharts->LineChart to create a default line chart, then add series and components from the Inspector.

How it compares

The facts do not name any similar tools or direct competitors, so XCharts stands alone in this registry. Its core is MIT-licensed and completely free, while some extended charts and UI components are distributed separately as paid VIP or SVIP products such as XCharts-Pro, XCharts-UI, XCharts-Bar3DChart, XCharts-FunnelChart, XCharts-GanttChart, XCharts-GaugeChart, XCharts-LiquidChart and XCharts-PictorialBarChart.

When to use it — and when not to

XCharts targets Unity only, so it is the wrong choice for Winforms, WPF or any non-Unity environment. Because it is built on UGUI, the usual UGUI constraints apply: aliasing artifacts and Mesh vertex count limits can appear, and the practical ceiling is around 20,000 points per line chart before sampling is required at additional CPU cost. Data loading is also the developer's responsibility, since Excel and database sources must be parsed before being passed to the XCharts API, and teams wanting the full set of extended charts and UI components must budget for a VIP or SVIP subscription.

project readme (upstream, from github) — read inline

XCharts

A powerful, easy-to-use, configurable charting and data visualization library for Unity.
Unity数据可视化图表插件。
English README

XCharts

XCharts 是一款基于 UGUI 的功能强大、简单易用的 Unity 数据可视化图表插件。它提供了丰富的图表类型和灵活的配置选项,帮助开发者快速实现专业级的数据可视化效果。支持折线图、柱状图、饼图、雷达图、散点图、热力图、环形图、K线图、极坐标、平行坐标等十多种常用的内置图表。提供3D饼图、3D柱图、3D金字塔、漏斗图、仪表盘、水位图、象形柱图、甘特图、矩形树图、桑基图、3D折线图、关系图等十多种高级扩展图表。

XCharts 官方主页
XCharts 在线示例

XCharts 教程:5分钟上手 XCharts
XCharts API文档
XCharts 常见问题
XCharts 配置项手册
XCharts 更新日志
XCharts 订阅服务

特性

  • 纯代码绘制:图表完全通过代码生成,无需额外贴图或 Shader 资源,轻量高效。
  • 可视化配置:提供直观的参数配置界面,支持实时预览效果,并可在运行时动态修改配置和数据。
  • 高度定制化:支持从主题、组件到数据项的全面参数设置,同时允许通过代码自定义绘制逻辑、回调函数及图表实现。
  • 多内置图表:支持线图、柱状图、饼图、雷达图、散点图、热力图、环形图、K线图、极坐标、平行坐标等多种常用的内置图表。
  • 多扩展图表:支持3D柱图、3D饼图、漏斗图、金字塔、仪表盘、水位图、象形柱图、甘特图、矩形树图、桑基图、3D折线图、关系图等多种高级扩展图表,满足复杂数据可视化需求。
  • 多扩展组件:支持多种实用 UI 组件,如表格、统计数值、滑动条、进度条等,增强图表交互性。
  • 多图表组合:支持在同一图表中组合显示多个相同或不同类型的图表,满足复杂场景需求。
  • 多种坐标系:支持直角坐标系、极坐标系、单轴等多种坐标系,适应不同数据展示需求。
  • 丰富的组件:提供标题、图例、提示框、标线、标域、数据区域缩放、视觉映射等常用组件,提升图表可读性。
  • 多样式线图:支持直线、曲线、虚线、面积图、阶梯线图等多种线图样式,满足不同数据趋势展示需求。
  • 多样式柱图:支持并列柱图、堆叠柱图、堆积百分比柱图、斑马柱图、胶囊柱图等多种柱状图样式。
  • 多样式饼图:支持环形图、玫瑰图、环形玫瑰图等多种饼图样式,直观展示数据占比。
  • 自定义绘制:提供强大的绘图 API,支持自定义绘制点、线、面等图形,满足个性化需求。
  • 大数据绘制:支持万级数据量绘制,优化性能表现;支持采样绘制,进一步提升大数据场景下的性能。
  • 自定义主题:支持主题定制、导入和导出,内置明暗两种默认主题,轻松适配不同应用场景。
  • 动画和交互:支持渐入、渐出、变更、新增等多种动画效果,以及数据筛选、视图缩放、细节展示等交互操作,提升用户体验。
  • 第三方扩展:无缝集成TexMeshPro和New Input System,扩展功能兼容性。
  • 版本和兼容:支持 Unity 5.6 及以上版本,兼容全平台运行。

截图

内置图表

扩展图表

使用

  • 导入XCharts的unitypackage或者源码到项目。建议也导入XCharts守护程序 XCharts-Daemon。
  • 在Hierarchy视图下右键选择XCharts->LineChart,即可创建一个默认的折线图。
  • 用Inspector视图下的Add Serie和Add Main Component按钮可以添加Serie和组件。
  • 在Inspector视图下可以调整各个组件的参数,Game视图可看到实时效果。
  • 更多细节,请看【XCharts教程:5分钟上手教程】。
  • 首次使用,建议先认真看一遍教程。

常见问题 (FAQ)

  • XCharts 可以免费使用吗?
    XCharts 基于 MIT 协议,核心功能完全免费。您也可以订阅 VIP 服务,享受更多高级功能和专属技术支持。

  • XCharts 支持代码动态添加和修改数据吗?
    是的,XCharts 提供了丰富的数据操作接口,支持代码动态修改配置和数据。但数据来源(如 Excel 或数据库)需要您自行解析后调用 XCharts 接口添加到图表中。

  • XCharts 支持哪些平台?
    XCharts 专为 Unity 平台设计,支持 Unity 5.6 及以上版本。理论上,任何支持 UGUI 的 Unity 版本均可运行 XCharts。目前不支持 Winform 或 WPF 等其他平台。

  • 如何解决锯齿问题?XCharts 支持多大的数据量?
    XCharts 基于 UGUI 实现,因此 UGUI 的常见问题(如锯齿、Mesh 顶点数限制)在 XCharts 中也会存在。

    • 锯齿问题:可通过调整抗锯齿设置或使用更高分辨率解决。
    • 数据量限制:单条折线图(Line)支持约 2 万数据点,开启采样后可支持更多数据,但会消耗更多 CPU 资源。
      更多解决方案请参考 问答 16 和 问答 27。
  • 哪里可以查看 Demo?
    本仓库仅包含 XCharts 源码,Demo 示例请访问 XCharts-Demo 仓库。您也可以在浏览器中查看 在线 Demo。

日志

扩展

许可

  • MIT License:XCharts 核心库基于 MIT 协议,允许免费商用和二次开发。

  • 扩展功能授权:扩展图表和高级功能需订阅 VIP 或 SVIP 服务获得使用许可。

订阅

  • 核心功能免费:XCharts 核心库基于 MIT 协议完全开源,可免费使用。
  • 增值服务:为满足多样化需求,我们提供多种订阅服务,详情请查看 订阅详情。
  • 灵活选择:订阅非强制,不影响核心功能使用。
  • 按年付费:订阅服务按年计费,到期后可选择续订。中断订阅后,将无法享受更新和技术支持服务。

其他

  • 邮箱:monitor1394@gmail.com
  • QQ群:XCharts交流群(202030963)
  • VIP群:XCharts VIP群(867291970)
  • 支持与合作:订阅与支持

Frequently asked questions

Is XCharts free to use?

XCharts is open source under the MIT licence. There is no licence fee and no seat count — you can self-host it or, where the project offers one, pay a vendor for a managed version instead.

What does XCharts do?

A charting and data visualization library for Unity. Unity数据可视化图表插件。

What is XCharts written in?

XCharts is primarily written in C#. Its source is publicly available at https://github.com/XCharts-Team/XCharts, and it has 3,801 GitHub stars.