
vizzu-lib is a free, open source business intelligence & reporting project written in JavaScript and released under Apache-2.0. It has 2,035 GitHub stars, 87 forks and 3 open issues, and was last pushed 5 months ago. On this registry it ranks #47 of 77 tracked projects in Business Intelligence & Reporting, with 5 head-to-head comparisons available.

What is vizzu-lib?

Vizzu is a free, open-source JavaScript and C++ library that renders animated data visualizations and data stories, and it is aimed at developers who build charts, dashboards, and interactive data explorers for the web.

What it is

Vizzu lives in the JavaScript data visualization ecosystem and is distributed as the npm package vizzu, as well as through a CDN build at https://cdn.jsdelivr.net/npm/vizzu@latest/dist/vizzu.min.js. Underneath, it is a generic dataviz engine written in C++ and compiled to WebAssembly, and it renders through HTML5 canvas. The project is released under the Apache 2.0 licence and is dependency-free, meaning it can be dropped into a page without pulling a chain of supporting packages. It generates many types of charts and animates seamlessly between them, so the same dataset can be shown as a bar chart, a scatter plot, or another geometry without a page reload.

The concrete problem it solves is that of the static chart. A conventional chart renders one view of the data and stops there, which forces a viewer to mentally reconstruct the relationship between one perspective and the next. Vizzu is designed with animation in focus, so a transition from one view to another is itself the explanation: the viewer watches the change and can follow it. It also applies automatic data aggregation and data filtering, and its defaults are based on data visualization guidelines, which reduces the amount of manual configuration needed to produce a readable result. It can still be used to create static charts, but its purpose is animated data stories and interactive explorers.

Key capabilities

  • chart.animate() transitions a live chart between configurations, for example from { x: 'Foo', y: 'Bar' } to { color: 'Foo', x: 'Baz', geometry: 'circle' } to turn a bar chart into a scatter plot.
  • A generic dataviz engine that generates many chart types from the same data series rather than requiring a separate component per chart.
  • Written in C++ and compiled to WebAssembly, with HTML5 canvas rendering.
  • Dependency-free, shipping as a single distributable file at dist/vizzu.min.js.
  • Automatic data aggregation and data filtering.
  • Defaults based on data visualization guidelines, applied without manual tuning.
  • Data supplied as a series array of named entries with name and values fields.

Who uses it and how

  • Developers building dashboards and interactive data explorers, both of which the topic list names directly.
  • Data storytellers who need animated chart sequences rather than fixed images, matching the storytelling and animation topics.
  • Teams embedding charts into an existing JavaScript application through the npm package, then instantiating a chart against a placeholder element such as new Vizzu('myVizzu', { data }).
  • People evaluating the library quickly through the linked JSFiddle example before committing to an integration.
  • Community members who coordinate through the vizzu-community.slack.com Slack workspace and follow the project's roadmap and external projects lists.

Getting started

Install it with npm install vizzu, or import the library directly from the CDN with import Vizzu from 'https://cdn.jsdelivr.net/npm/vizzu@latest/dist/vizzu.min.js'. After creating a placeholder element and a data object, a chart is created with new Vizzu('myVizzu', { data }) and animated with chart.animate().

How it compares

No paid products are listed among the facts, and no similar tools are named there either, so this entry stands alone in this registry and no like-for-like comparison can be drawn from the supplied material.

When to use it — and when not to

Vizzu is a client-side library and not a hosted platform, so a self-hoster operates nothing server-side: there is no database, no SMTP, and no backend service to run, but there is also no ready-made management console beyond the documentation, FAQ, roadmap wiki, and Slack community. Teams that need server-rendered static charts, or that want a full business intelligence product with storage and reporting built in, should not pick it, because it is a rendering engine that must be integrated into their own application. The main gap evident in the supplied facts is that the comparison and deployment guidance is spread across several external sites rather than gathered in the repository itself.

project readme (upstream, from github) — read inline

Vizzu

Vizzu - Library for animated data visualizations and data stories.

Documentation · Examples · Code reference · Repository · Blog

npm version install size Tweet

Vizzu

About The Project

Vizzu is a free, open-source Javascript/C++ library utilizing a generic dataviz engine that generates many types of charts and seamlessly animates between them. It can be used to create static charts but more importantly, it is designed for building animated data stories and interactive explorers as Vizzu enables showing different perspectives of the data that the viewers can easily follow due to the animation.

Main features:

  • Designed with animation in focus;
  • Defaults based on data visualization guidelines;
  • Automatic data aggregation & data filtering;
  • HTML5 canvas rendering;
  • Written in C++ compiled to WebAssembly;
  • Dependency-free.

Installation

Install via npm:

npm install vizzu

Or use it from CDN:

<html>
 <head>
  <script type="module">
   import Vizzu from 'https://cdn.jsdelivr.net/npm/vizzu@latest/dist/vizzu.min.js';
  </script>
 </head>
</html>

Usage

Create a placeholder element that will contain the rendered chart:

<html>
 <body>
  <div id="myVizzu" style="width:800px; height:480px;">
  </div>
 </body>
</html>

Create a simple bar chart:

import Vizzu from 'https://cdn.jsdelivr.net/npm/vizzu@latest/dist/vizzu.min.js';

let data = {
    series: [{
        name: 'Foo',
        values: ['Alice', 'Bob', 'Ted']
    }, {
        name: 'Bar',
        values: [15, 32, 12]
    }, {
        name: 'Baz',
        values: [5, 3, 2]
    }]
};

let chart = new Vizzu('myVizzu', {
    data
});
chart.animate({
    x: 'Foo',
    y: 'Bar'
});

Then turn it into a scatter plot:

chart.animate({
    color: 'Foo',
    x: 'Baz',
    geometry: 'circle'
});
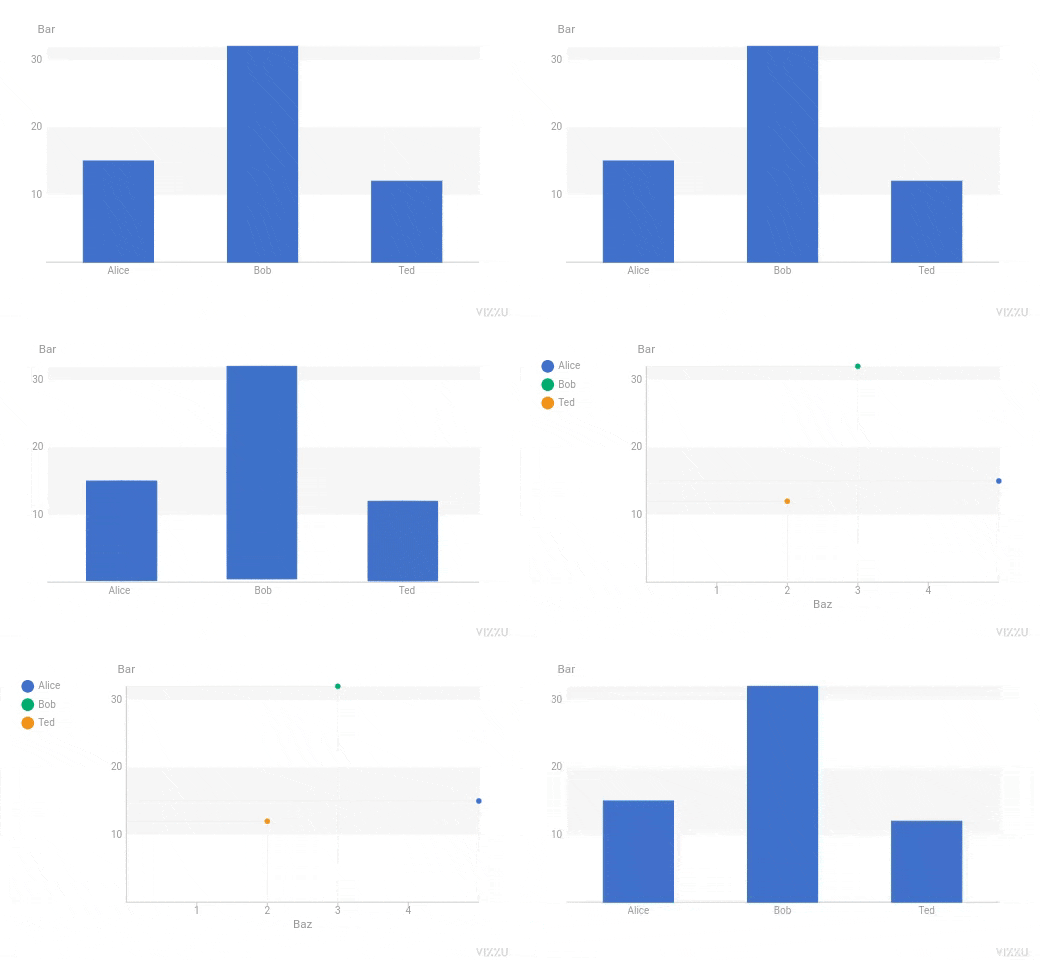
Try it!

Example chart

FAQ

You can find answers to the most frequently asked questions about using the library in our FAQ.

Projects

List of external projects (extensions, bindings, templates, etc) for Vizzu: Projects.

Roadmap

We have a comprehensive list of features we plan to implement, on our Roadmap.

Contributing

We welcome contributions to the project, visit our contributing guide for further info.

Contact

License

Copyright © 2021-2025 Vizzu Inc.

Released under the Apache 2.0 License.

Frequently asked questions

Is vizzu-lib free to use?

vizzu-lib is open source under the Apache-2.0 licence. There is no licence fee and no seat count — you can self-host it or, where the project offers one, pay a vendor for a managed version instead.

What does vizzu-lib do?

Library for animated data visualizations and data stories.

What is vizzu-lib written in?

vizzu-lib is primarily written in JavaScript. Its source is publicly available at https://github.com/vizzuhq/vizzu-lib, and it has 2,035 GitHub stars.