
Vizro is a low-code toolkit for building high-quality data visualization apps



What is Vizro?
Vizro is an open-source Python-based toolkit.
Use it to build beautiful and powerful data visualization apps quickly and easily, without needing advanced engineering or visual design expertise.
Then customize and deploy your app to production at scale.
In just a few lines of simple low-code configuration, with in-built visual design best practices, you can quickly assemble high-quality, multi-page prototypes, that are production-ready.
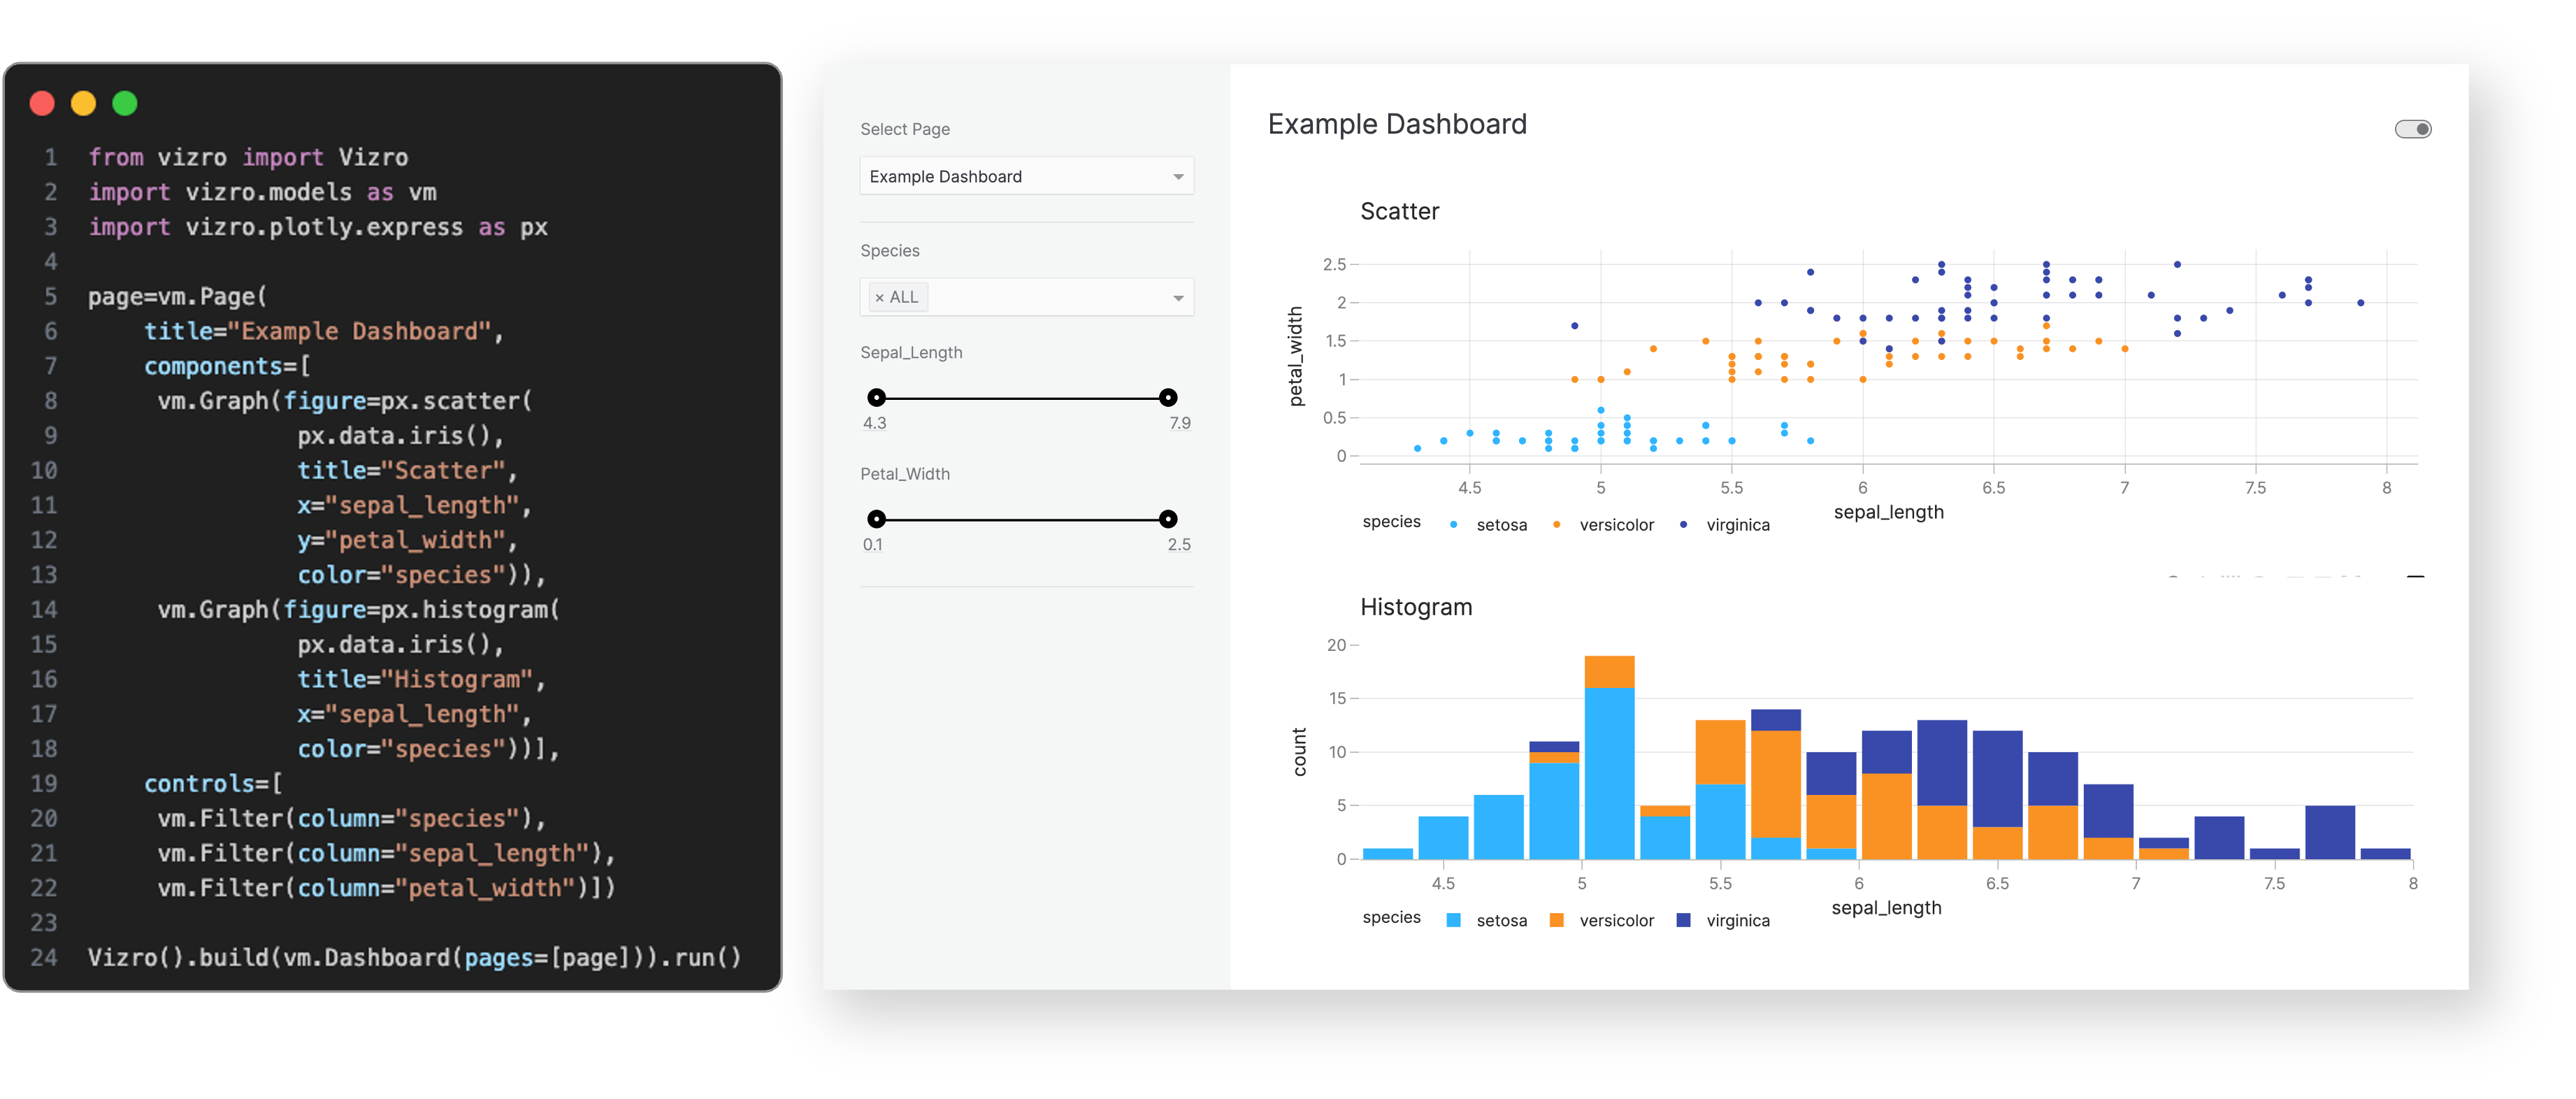
Every Vizro app is defined by a simple configuration, using these high-level categories:
- Components: charts, tables, cards, KPI indicators, forms and more.
- Controls: filters and parameters, using a range of selectors such as drop-down menus and sliders.
- Actions: interactions between components, drill-throughs, export functionality and more.
- Layouts: grid layouts or flexible containers, with a range of pre-set styles.
- Navigation: a range of app layout and navigation settings, including nested page hierarchies.
Configuration can be written in multiple formats including Pydantic models, JSON, YAML or Python dictionaries for added flexibility of implementation.
Optional high-code extensions enable almost infinite customization in a modular way, combining the best of low-code and high-code - including bespoke visual formatting and custom components.
Visit the "How-to guides" for a more detailed explanation of Vizro features.
Why use Vizro?
The benefits of the Vizro toolkit include:
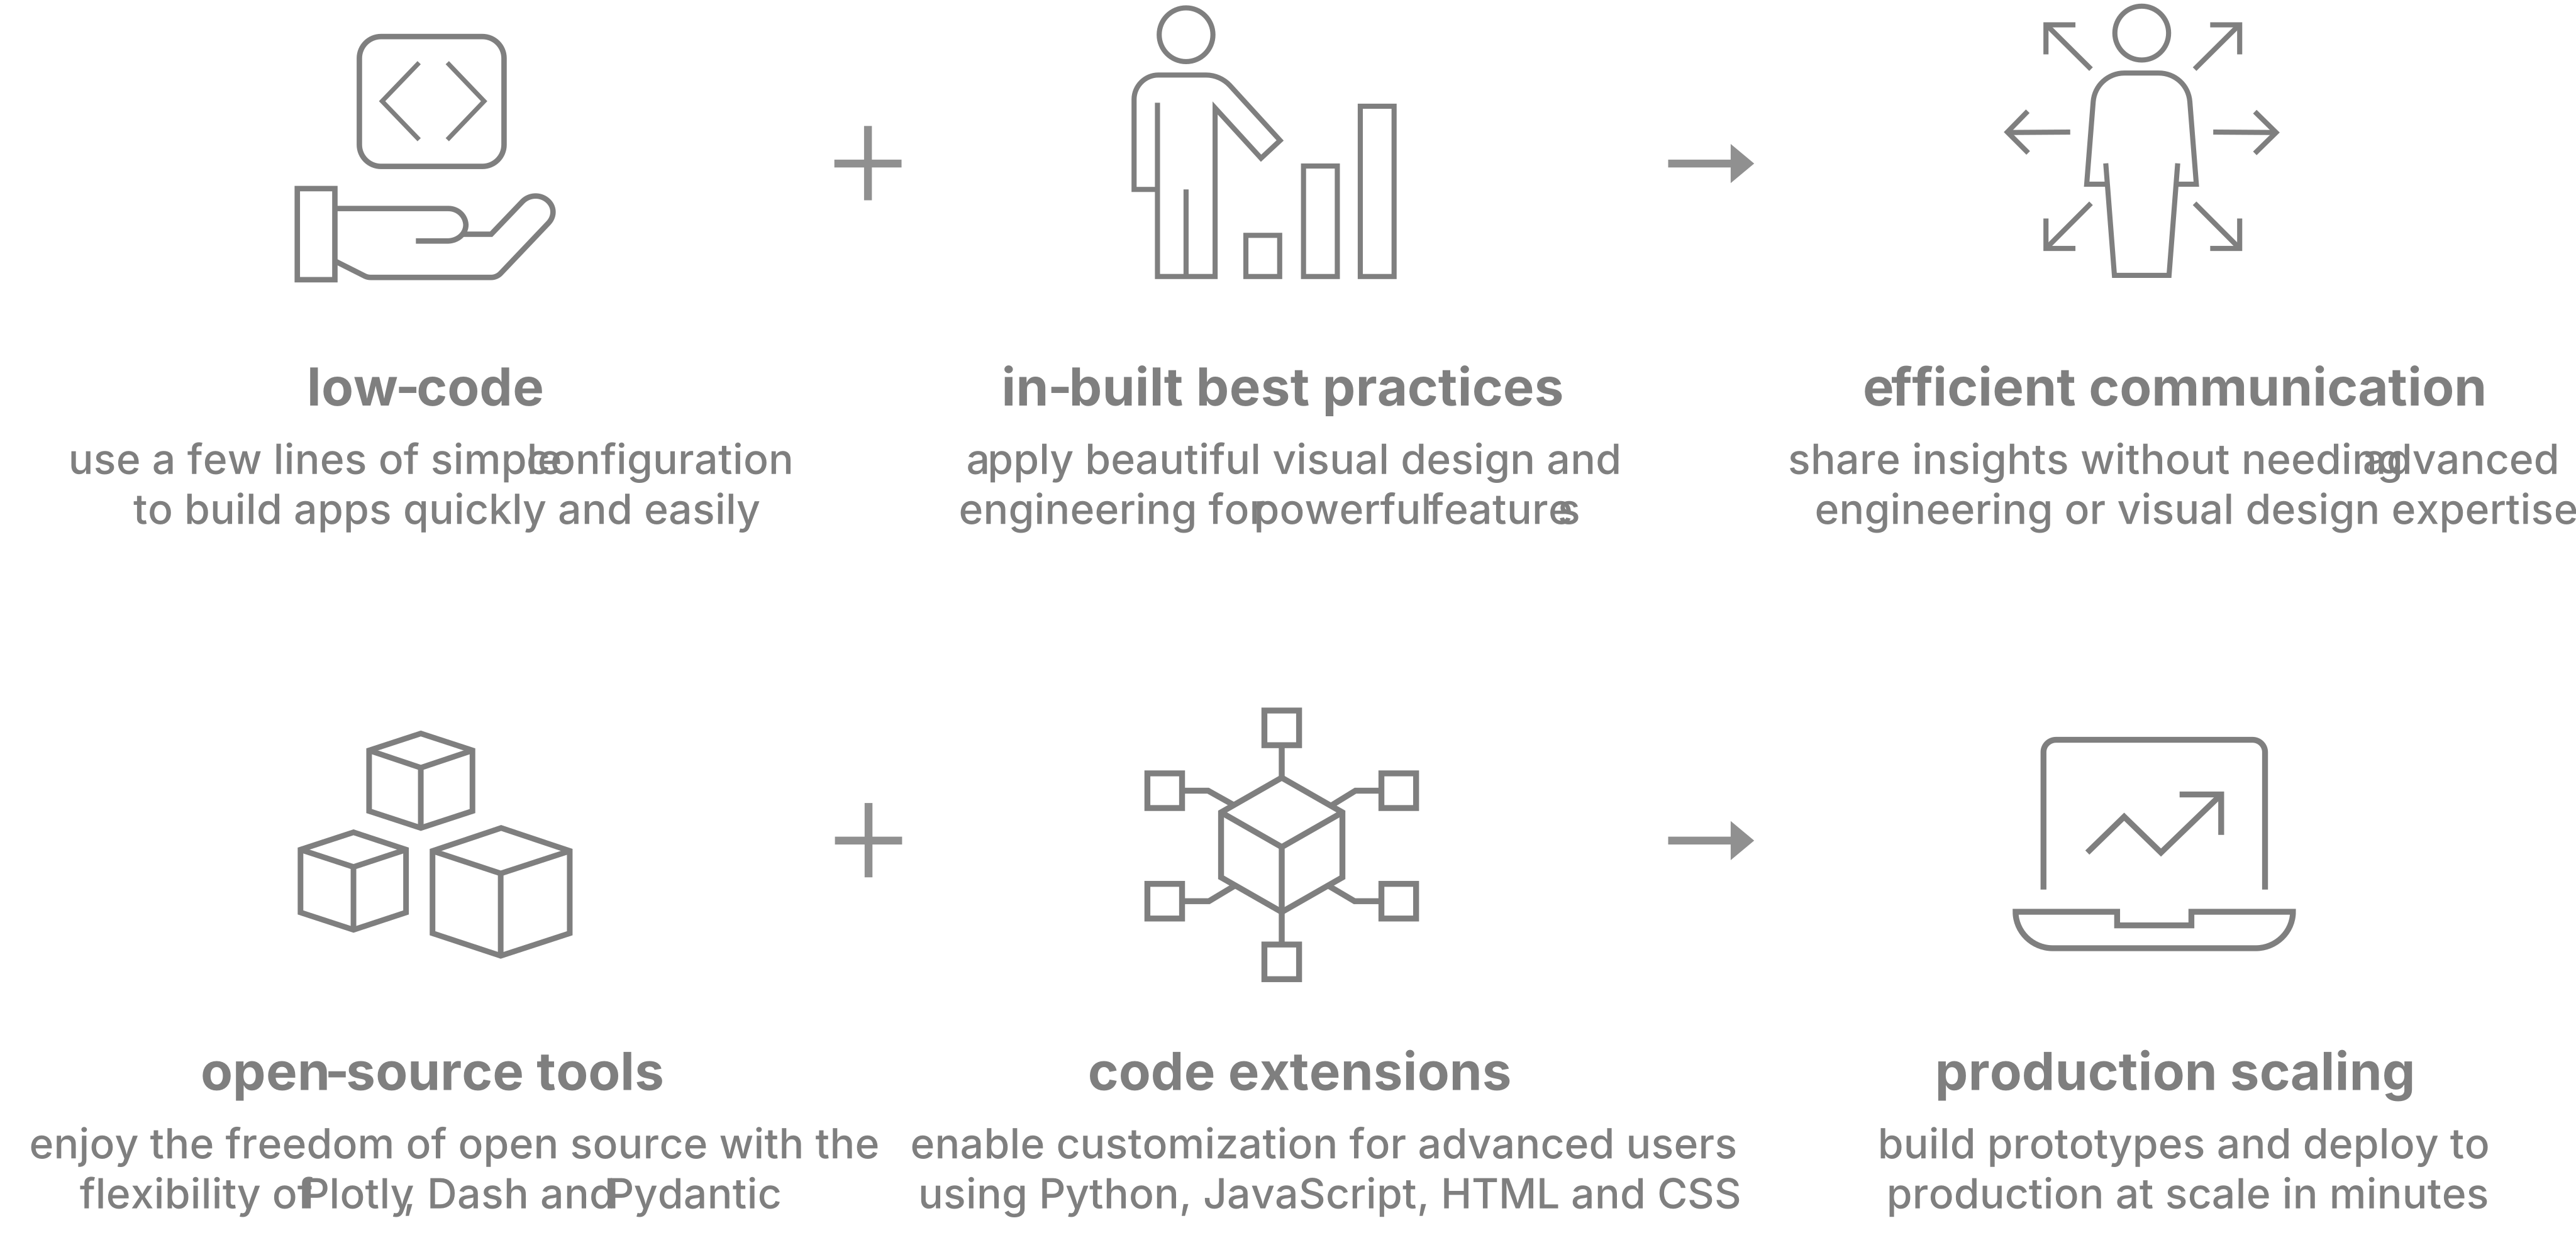
Vizro helps you to build data visualization apps that are:
Quick and easy
Build apps in minutes. Use a few lines of simple configuration (via Pydantic models, JSON, YAML, or Python dictionaries) in place of thousands of lines of code.
Beautiful and powerful
Build high-quality multi-page apps without needing advanced engineering or visual design expertise. Use powerful features of production-grade BI tools, with in-built visual design best practices.
Flexible
Benefit from the capabilities and flexibility of open-source packages. Use the trusted dependencies of Plotly, Dash, and Pydantic.
Customizable
Almost infinite control for advanced users. Use Python, JavaScript, HTML and CSS code extensions.
Scalable
Rapidly prototype and deploy to production. Use the in-built production-grade capabilities of Plotly, Dash and Pydantic.
Visit "Why should I use Vizro?" for a more detailed explanation of Vizro use cases.
When to use Vizro?
Use Vizro when you need to combine the speed and ease of low-code Python tools, with production capabilities of JavaScript and BI tools, and the freedom of open source:
- Have an app that looks beautiful and professional by default.
- Enjoy the simplicity of low-code, plus the option to customize with code almost infinitely.
- Rapidly create prototypes which are production-ready and easy to deploy at scale.
How to use Vizro?
Explore a few live demos to see different Vizro dashboards in action:
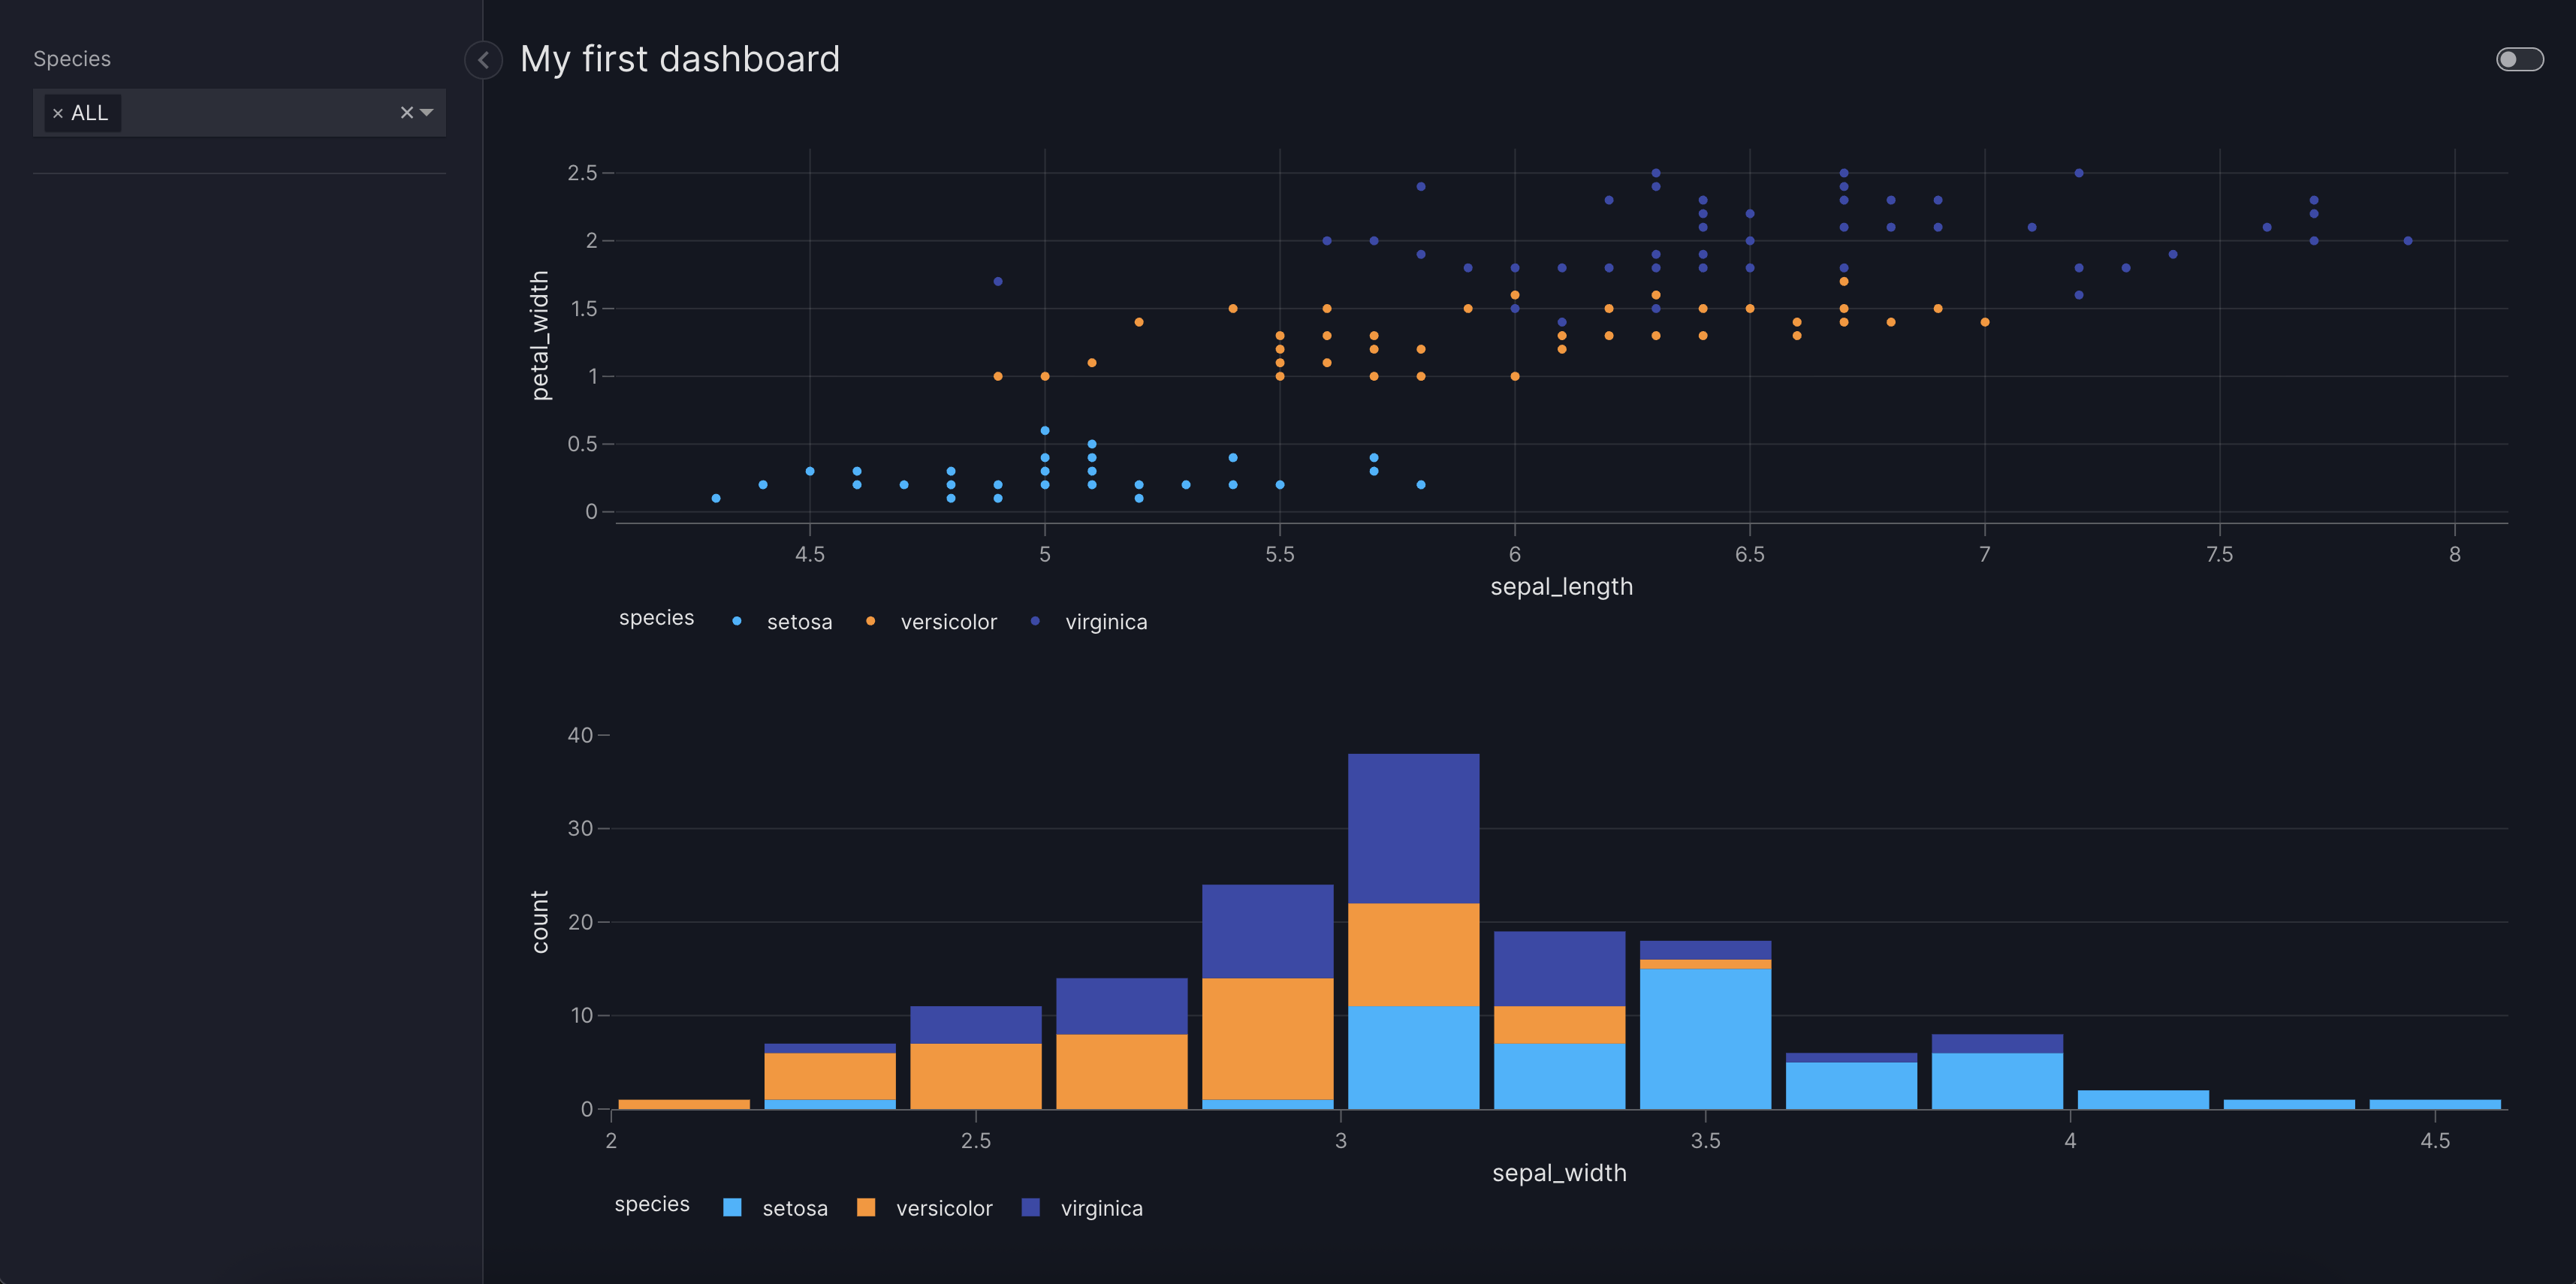
Basic Dashboard Try it live |

Visual Vocabulary Try it live |
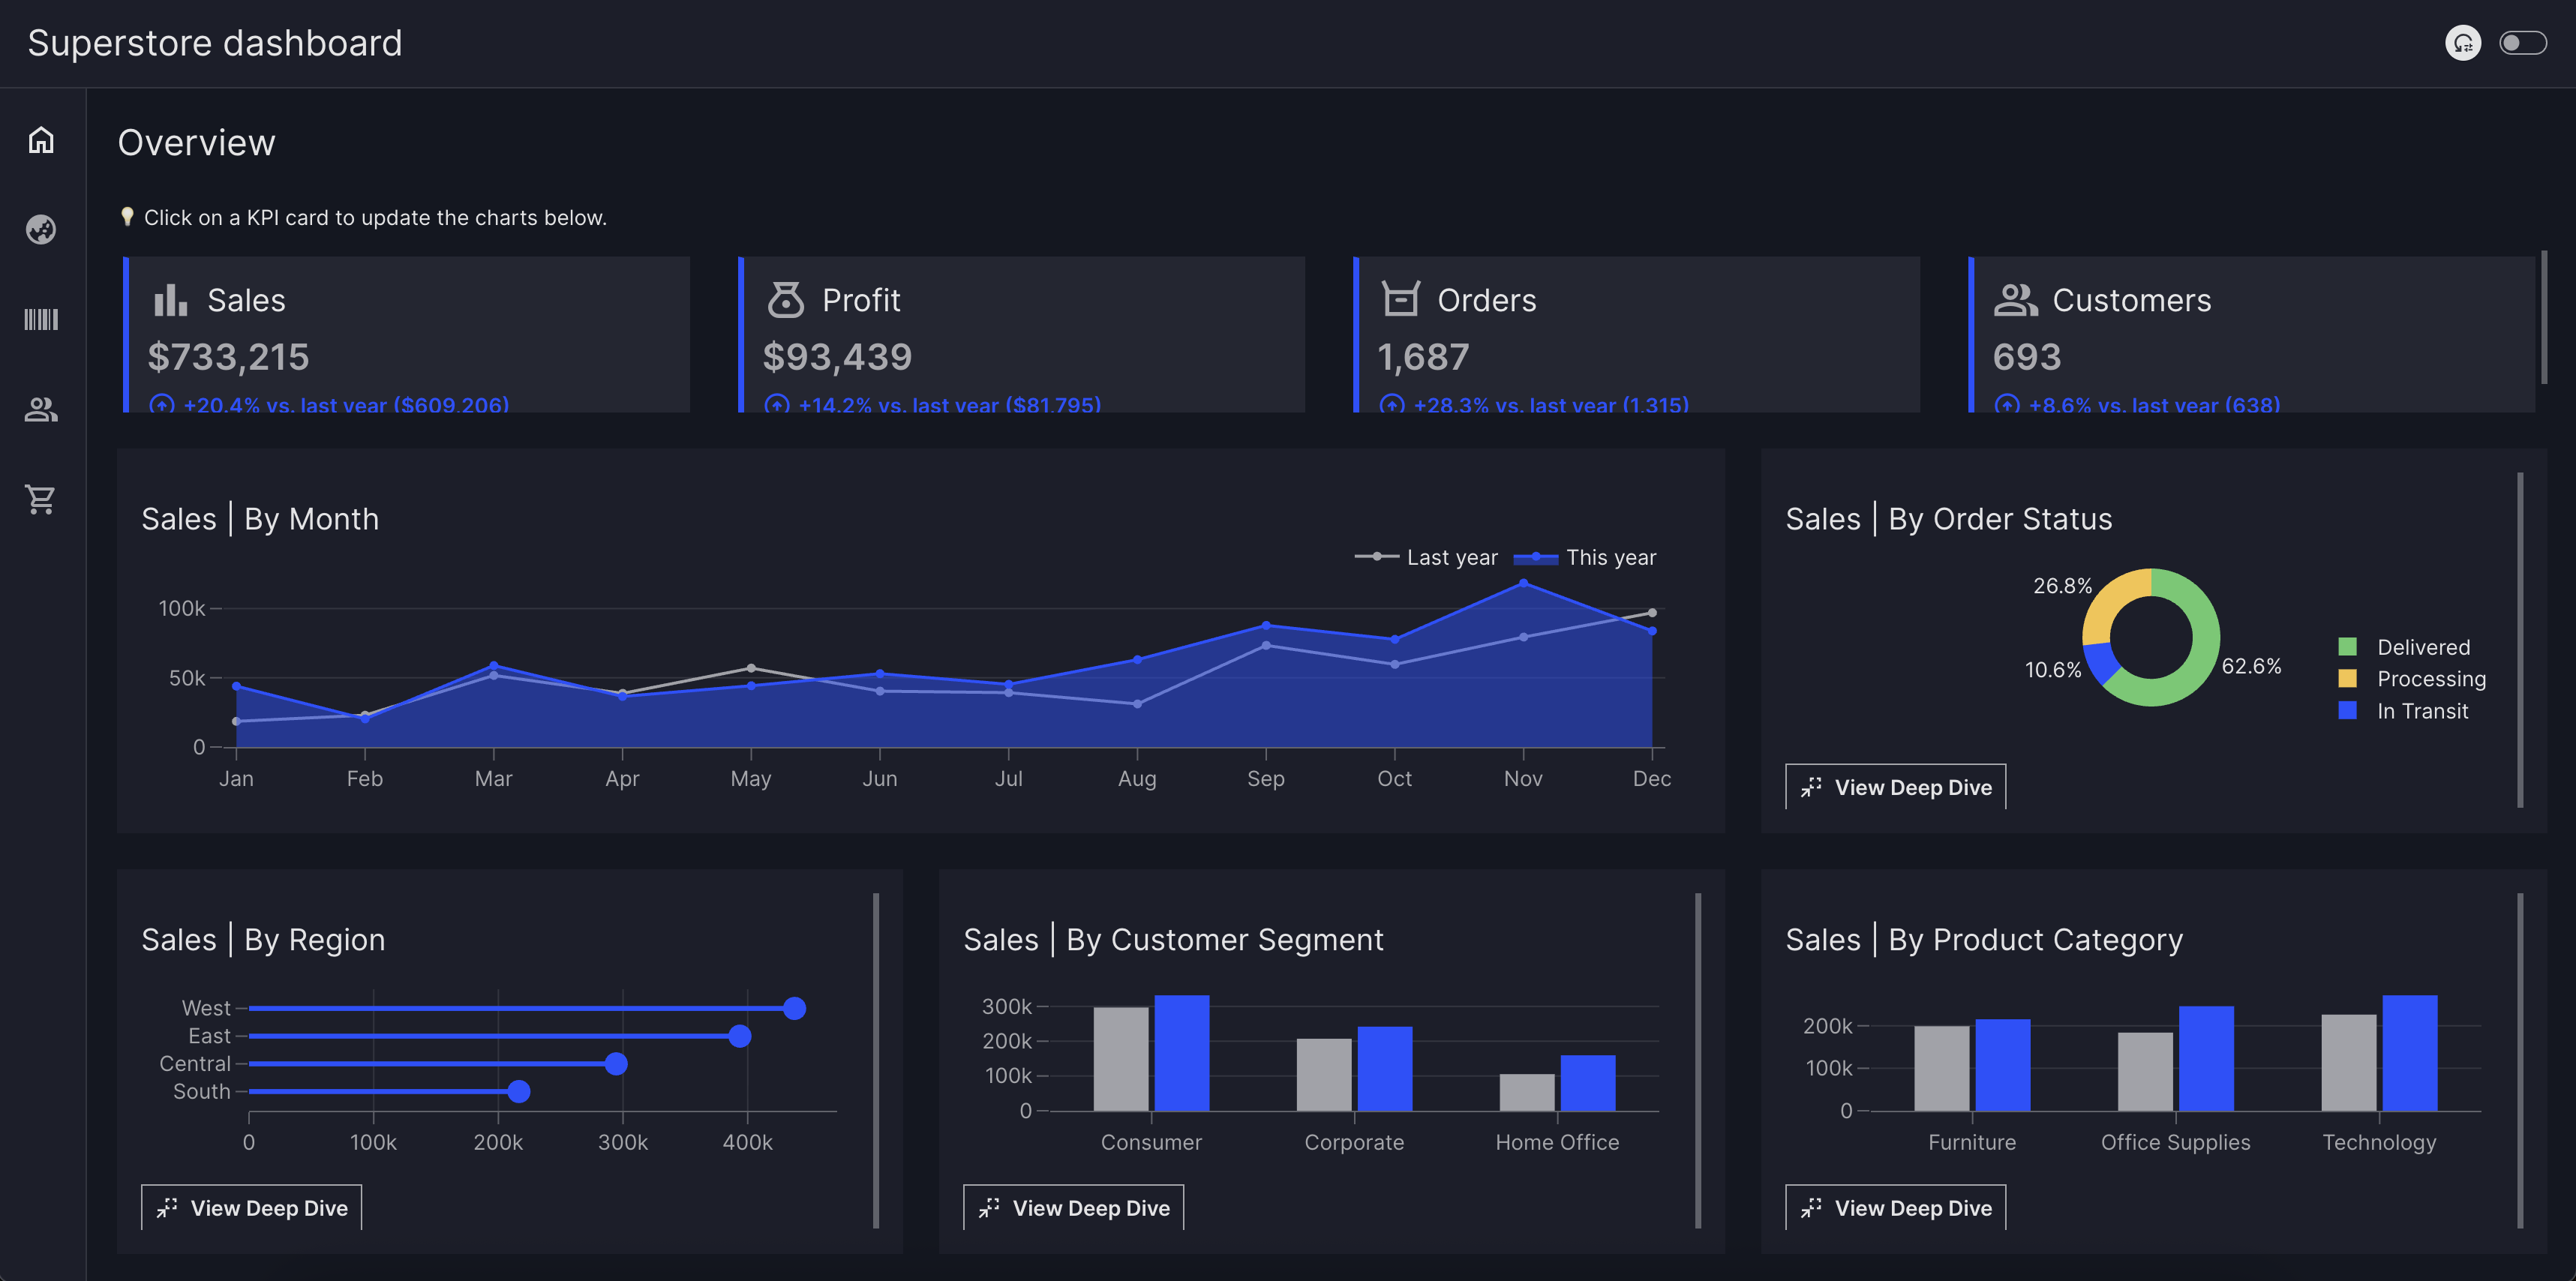
BI Dashboard Try it live |
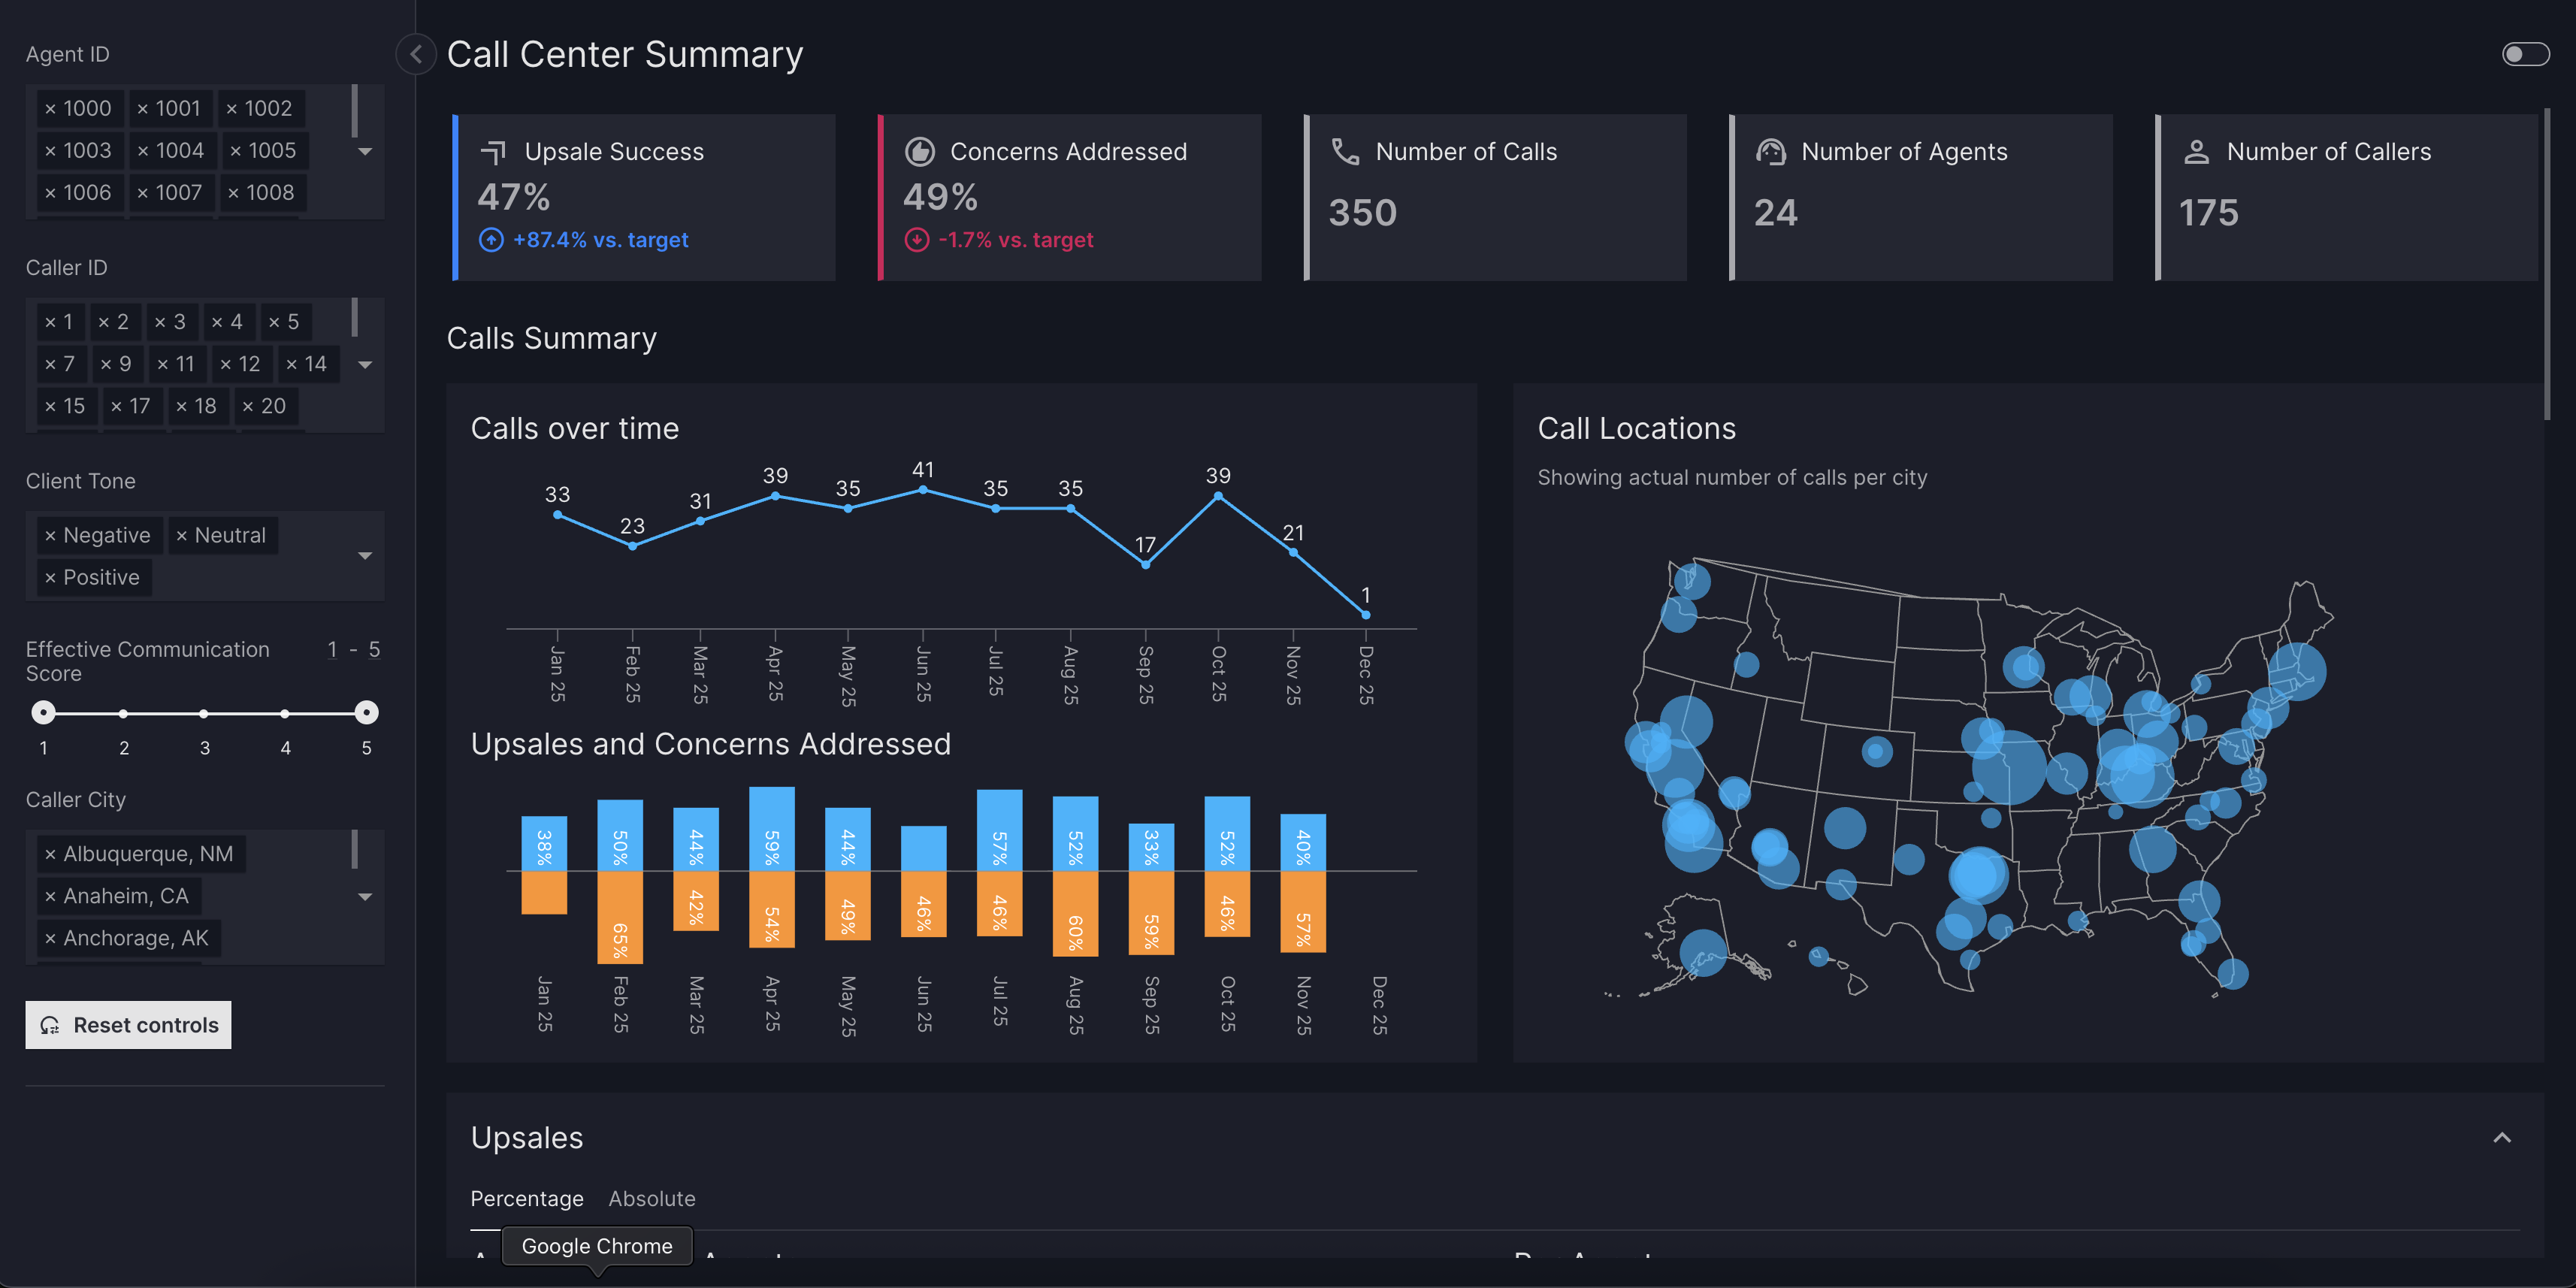
Call Center Dashboard Try it live |
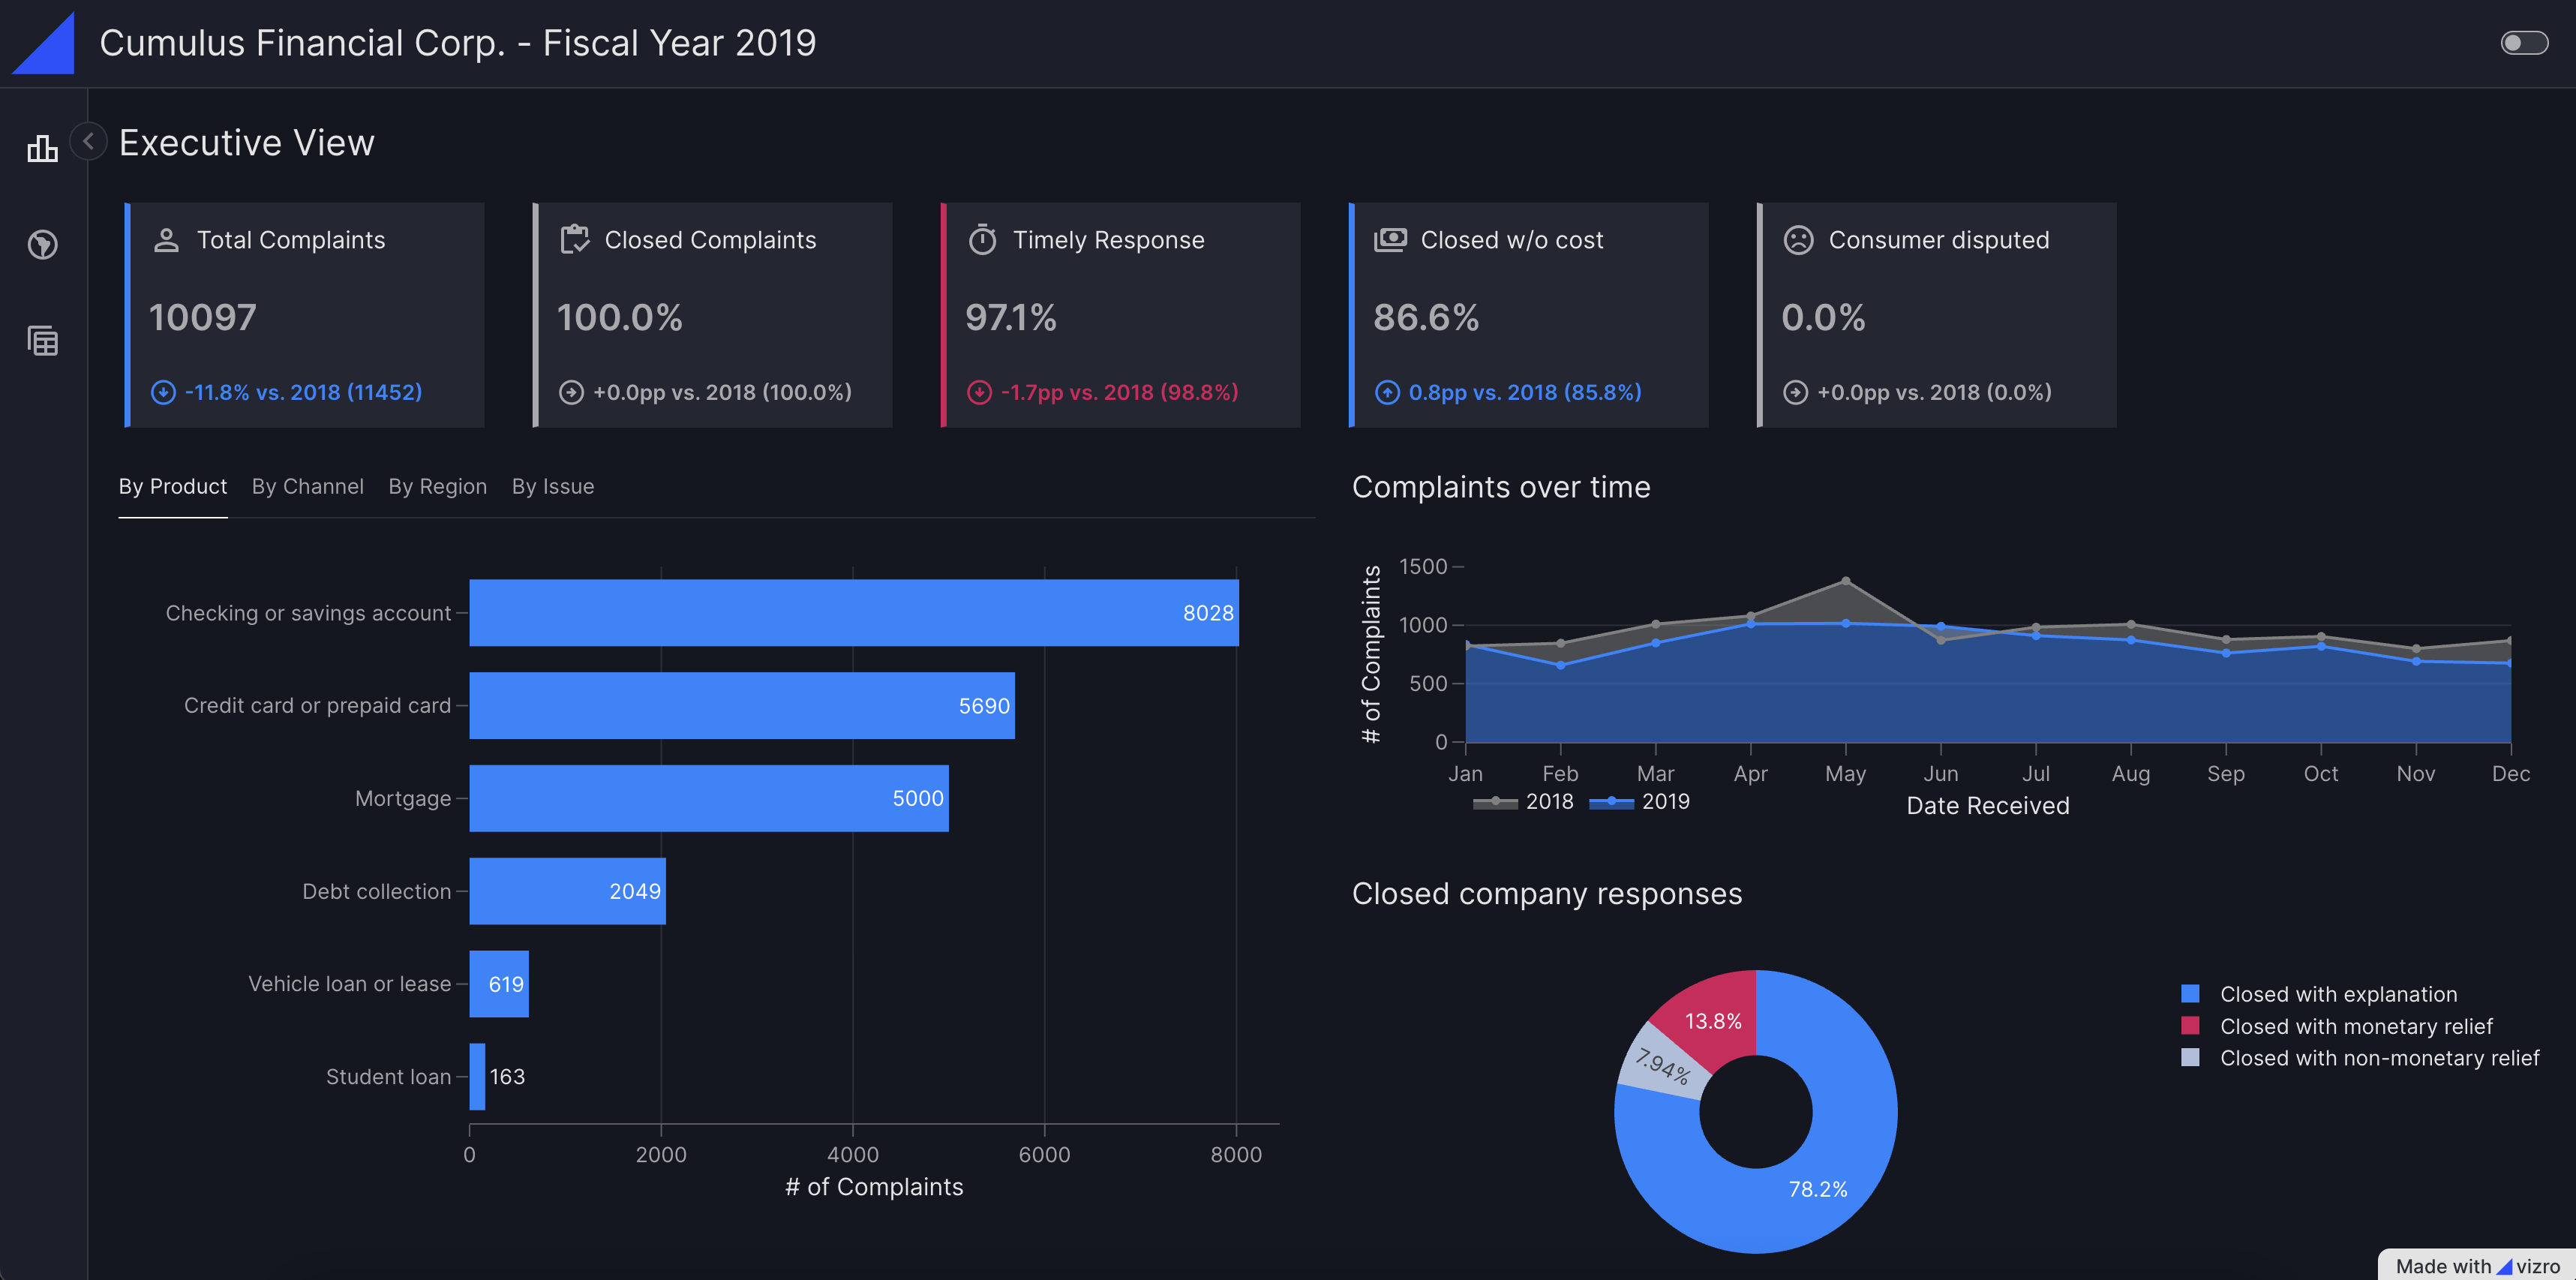
KPI Dashboard Try it live |
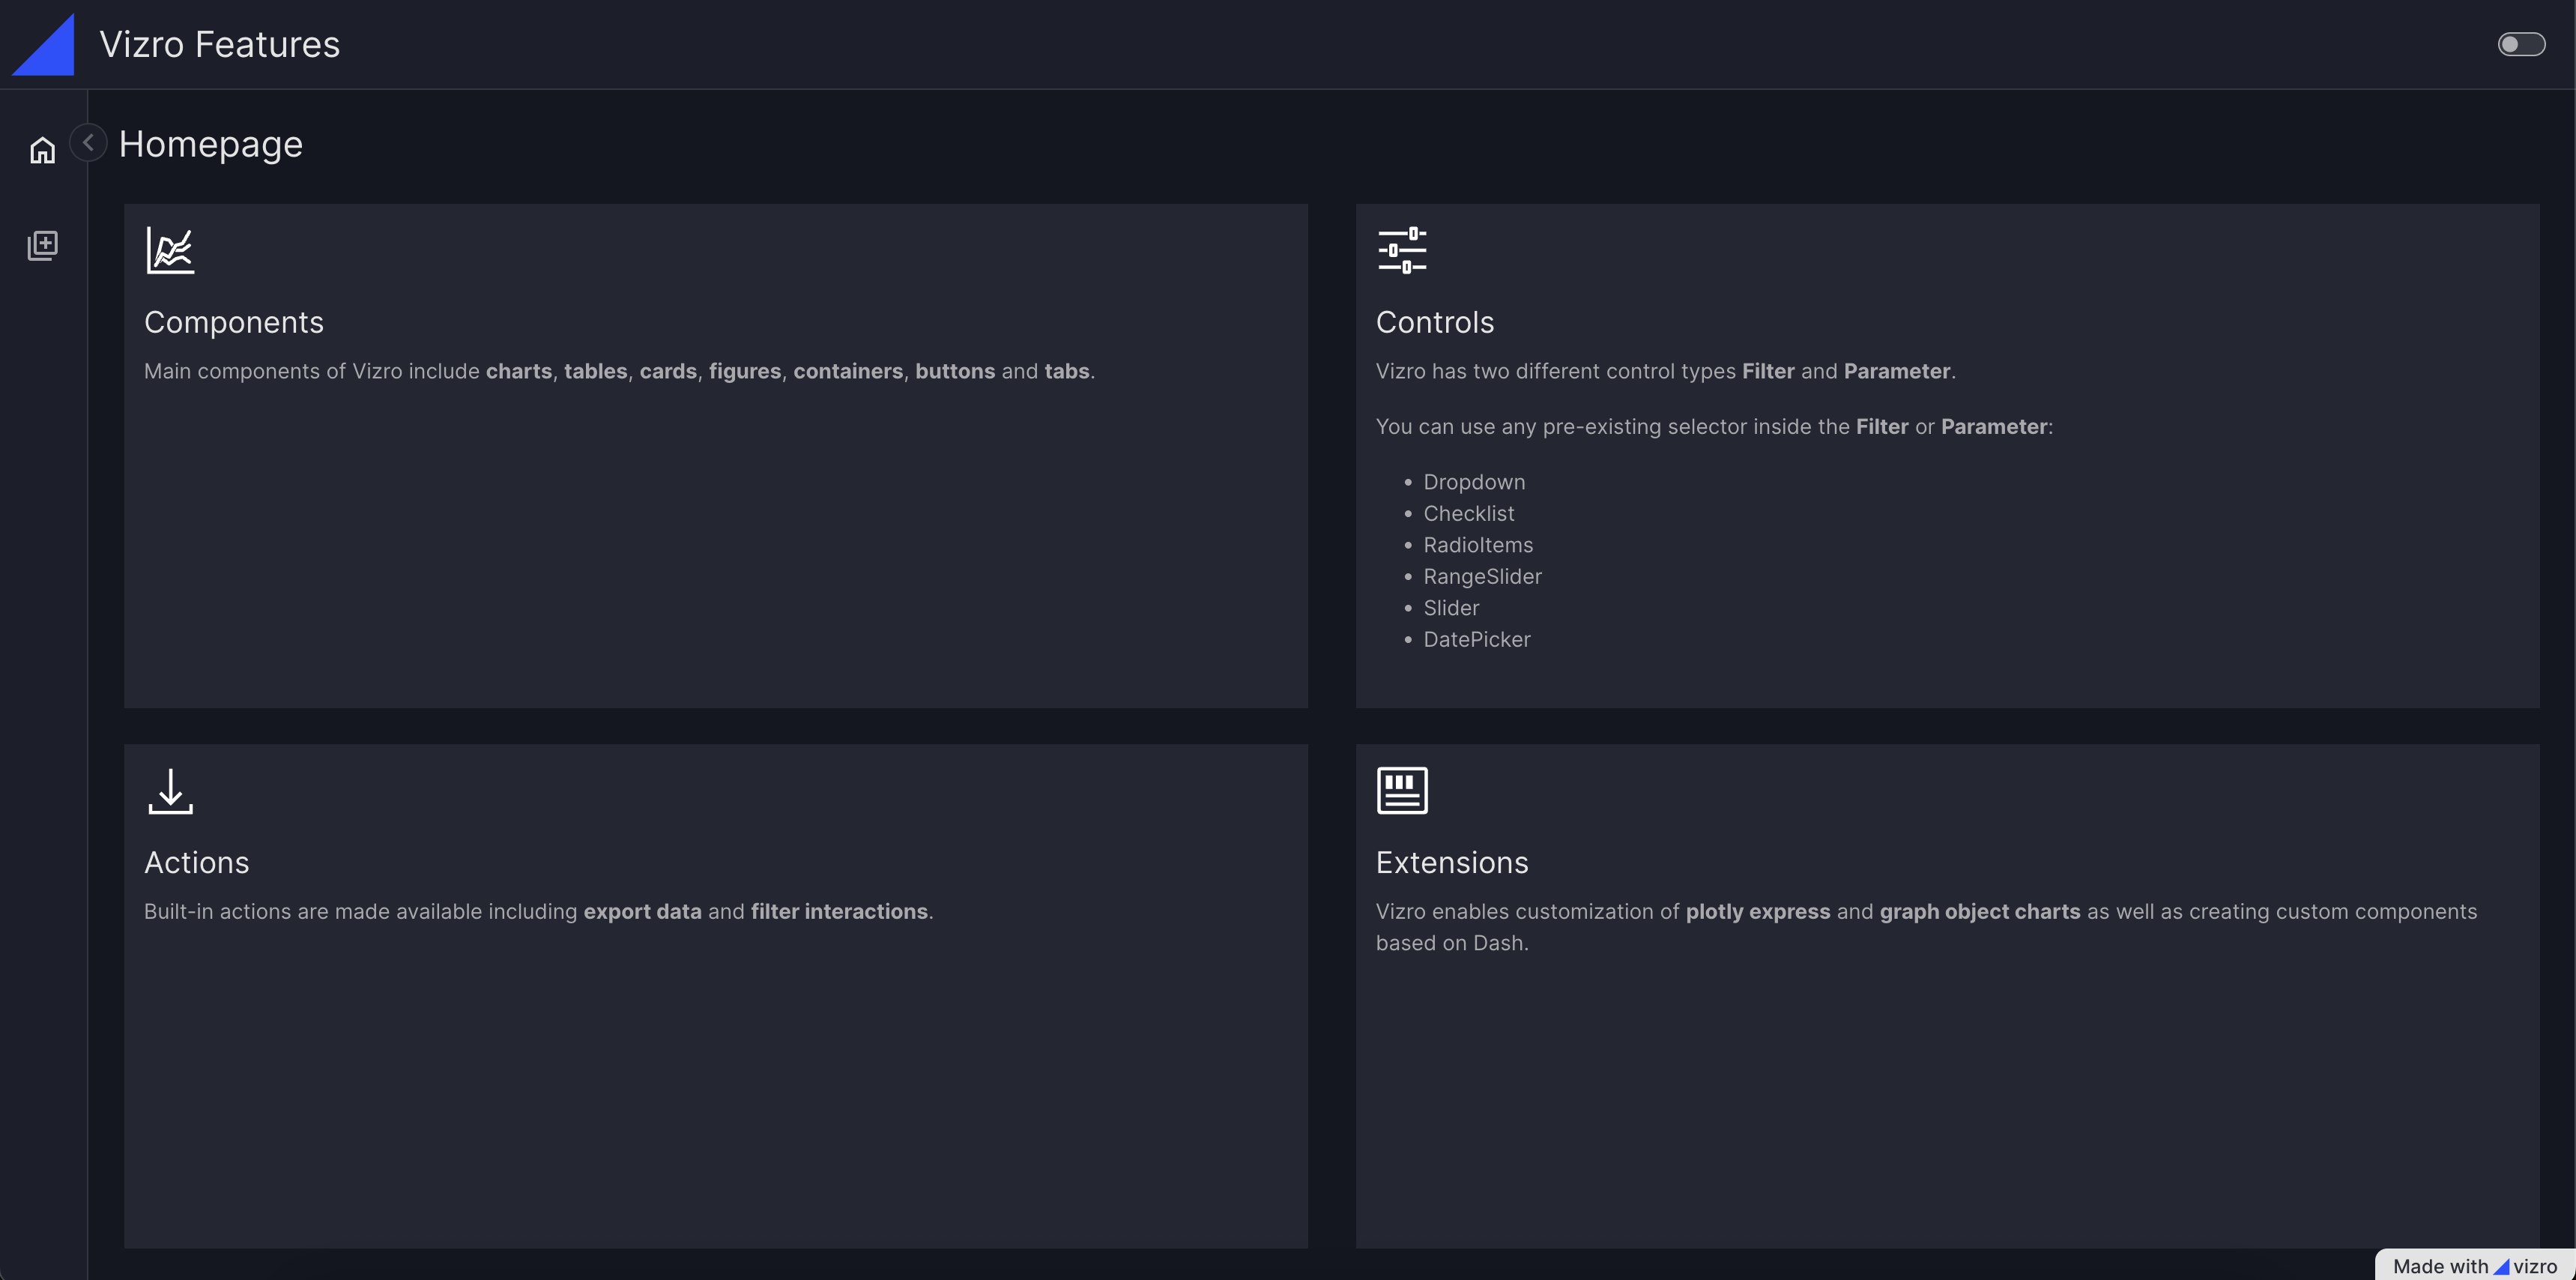
Features Dashboard Try it live |
Browse the full [Vizro Gallery](h