What it is
Uptrace is open source APM platform for modern applications. It sits in Infrastructure & Operations / Monitoring & Observability ecosystem. It supports OpenTelemetry traces, metrics, logs. It gives one interface for application monitoring, distributed tracing, performance monitoring, and log inspection. README says it comes with query builder, rich dashboards, alerting rules, notifications, and integrations for most languages and frameworks. It is written in Go and licensed AGPL-3.0.
Problem it solves: teams need see traces, metrics, logs in one place. Paid APM tools cost high. Uptrace lets teams collect OpenTelemetry data, store it in ClickHouse, query spans/metrics/logs, build dashboards, set alerts, troubleshoot issues. It also requires PostgreSQL database for metadata such as metric names and alerts. It can process billions of spans and metrics on single server. It positions as open alternative to Datadog.
Key capabilities
- Single UI for traces, metrics, logs, with query builder and rich dashboards.
- 50+ pre-built dashboards auto-created once metrics start coming in.
- Service graph and chart annotations.
- Monitoring for spans, logs, metrics with notifications via Email, Slack, WebHook, AlertManager.
- SQL-like query language to aggregate spans; PromQL-like language to aggregate metrics.
- Data ingestion via OpenTelemetry, Prometheus, Vector, FluentBit, CloudWatch, and more; integrations for most languages and frameworks.
- Grafana compatibility as Tempo/Prometheus datasource; user/project management via YAML; SSO via OpenID Connect with Keycloak, Google Cloud, Cloudflare.
Who uses it and how
- Application teams monitor services and troubleshoot issues with traces, metrics, logs.
- Self-hosted deployments collect OpenTelemetry data, store spans/metrics in ClickHouse, metadata in PostgreSQL.
- Operators build dashboards, service graphs, annotations, alert rules for performance monitoring.
- Grafana users query Uptrace as Tempo/Prometheus datasource.
- Organizations manage users/projects via YAML and use OpenID Connect SSO.
Getting started
Try Uptrace in cloud demo at app.uptrace.dev/play without login, or run locally with Docker using example/docker. Then follow getting started guide.
When to use it — and when not to
Use Uptrace when you want self-hosted OpenTelemetry APM and can operate ClickHouse plus PostgreSQL. It positions as open alternative to Datadog; README claims 10x lower cost, more than 10K spans/second on single core, 1KB span compressed to ~40 bytes. Avoid it when you want zero-ops hosted monitoring, or when repo facts matter: 0 contributors, 0 years repo age, 52 open issues, 4284 stars, 215 forks, last push 2026-08-13T14:47:22Z, AGPL-3.0 license.
project readme (upstream, from github) — read inline
Languages: English | 简体中文
Open source APM: OpenTelemetry traces, metrics, and logs



Uptrace is an open source APM
that supports distributed tracing, metrics, and logs. You can use it to monitor
applications and troubleshoot issues.
Uptrace comes with an intuitive query builder, rich dashboards, alerting rules,
notifications, and integrations for most languages and frameworks.
Uptrace can process billions of spans and metrics on a single server and allows
you to monitor your applications at 10x lower cost.
Uptrace uses OpenTelemetry framework to collect data and ClickHouse database to
store it. It also requires PostgreSQL database to store metadata such as metric
names and alerts.
Features:
- Single UI for traces, metrics, and logs.
- 50+ pre-built dashboards that are automatically created once metrics start
coming in.
- Service graph and
chart annotations.
- Spans/logs/metrics monitoring with
notifications via Email, Slack, WebHook, and AlertManager.
- SQL-like query language to
aggregate spans.
- Promql-like language to
aggregate metrics.
- Data ingestion using
OpenTelemetry,
Prometheus,
Vector,
FluentBit,
CloudWatch, and more.
- Grafana compatibility. You can
configure Grafana to use Uptrace as a Tempo/Prometheus datasource.
- Managing users/projects via YAML config.
- Single sign-on (SSO) using OpenID Connect:
Keycloak,
Google Cloud, and
Cloudflare.
- Efficient processing: more than 10K spans / second on a single core.
- Excellent on-disk compression: 1KB span can be compressed down to ~40 bytes.
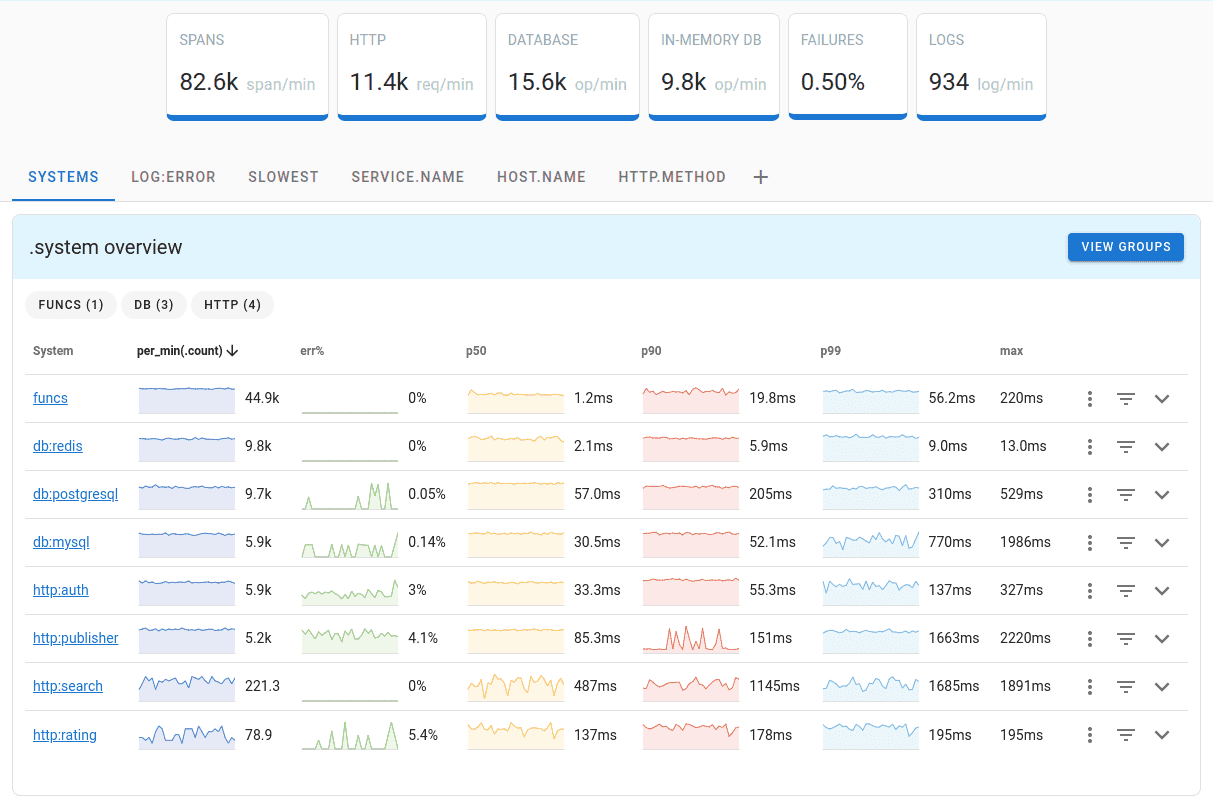
System overview
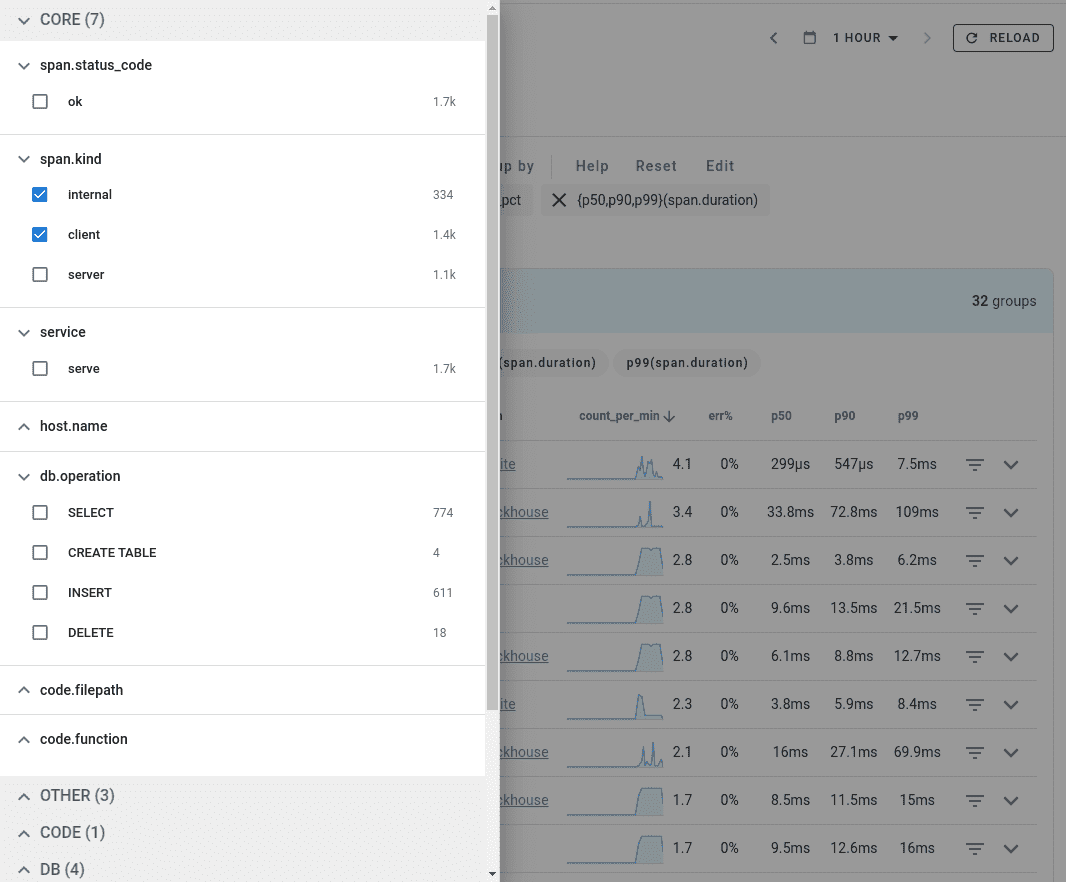
Faceted filters
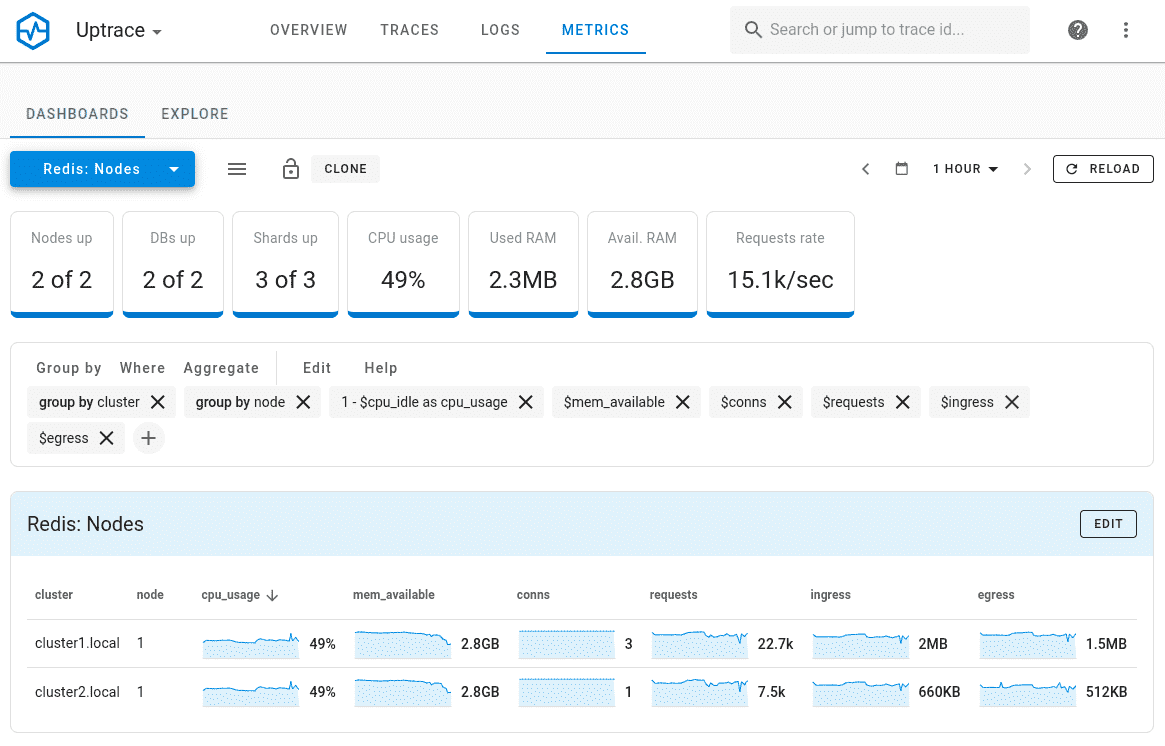
Metrics
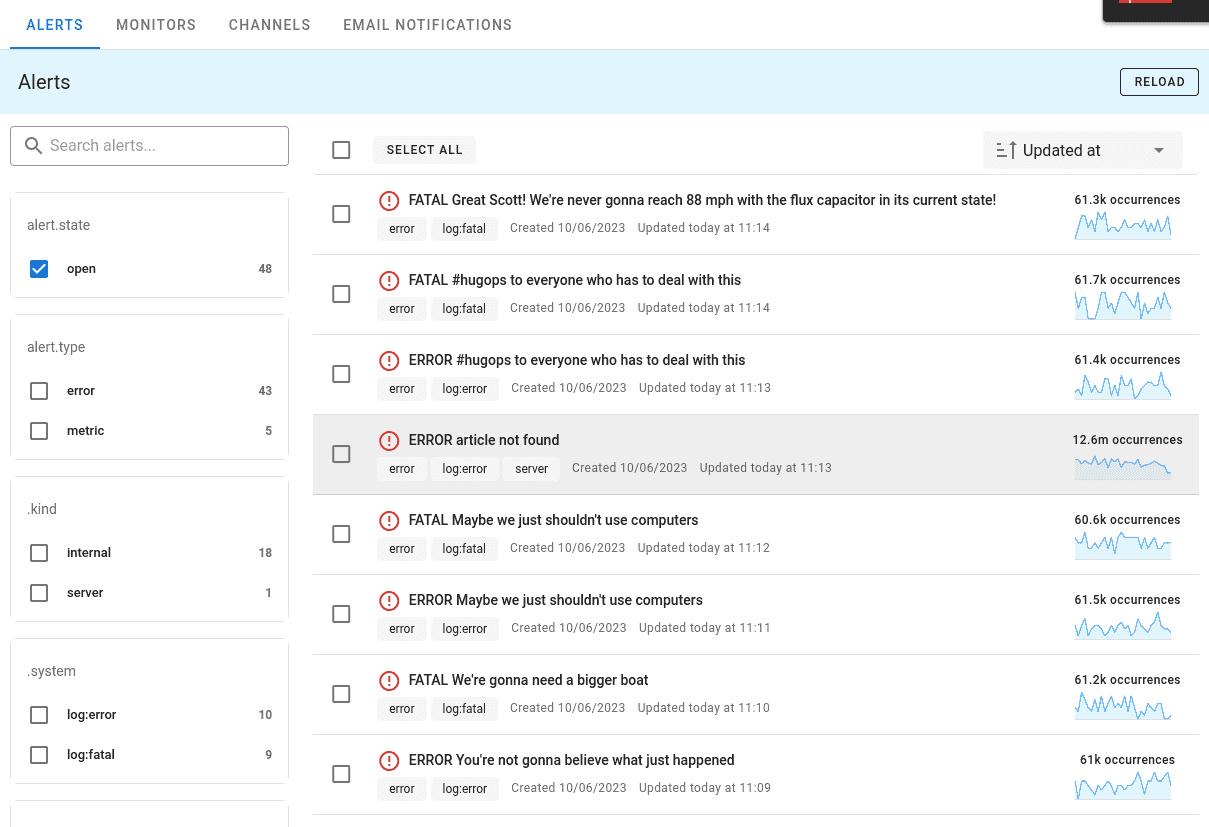
Alerts
Quickstart
You can try Uptrace in just a few minutes by visiting the
cloud demo (no login required) or by
running it
locally with Docker.
Then follow the getting started guide.
Help
Have questions? Get help via Telegram,
Slack,
or start a discussion on
GitHub.
Contributing