Unovis is a modular, tree-shakable data visualization framework for React, Angular, Svelte, Vue, Solid and vanilla TypeScript or JavaScript, built for front-end developers who need charts, maps and network graphs rendered inside their own applications.
What it is
Unovis is an open-source TypeScript library that provides data visualization components, distributed as a core package plus framework-specific bindings. The repository ships @unovis/ts as the core TypeScript package, alongside @unovis/react, @unovis/angular, @unovis/svelte, @unovis/vue and @unovis/solid for the individual front-end frameworks. It covers charts, maps and network graphs, not just line and bar charts, and it is licensed under Apache-2.0.
The concrete problem it solves is bundle weight and framework lock-in in the JavaScript visualization ecosystem. Because the library is tree-shakable and supports individual component imports, a project can pull in only the parts it renders instead of shipping a monolithic charting bundle. Because the same core powers bindings for five frameworks, a team that maintains interfaces in more than one stack does not have to adopt a separate charting library per framework. Customization is handled through CSS variables rather than a proprietary theming API.
Key capabilities
- Framework bindings for React, Angular, Svelte, Vue and Solid, plus a vanilla TypeScript or JavaScript core in
@unovis/ts.
- Charts, maps and network graphs from a single library rather than separate dependencies per visualization type.
- Tree-shakable architecture with support for individual component imports to reduce bundle size.
- CSS variables for styling, so themes are expressed in standard CSS rather than a custom theming layer.
- Component primitives such as
VisXYContainer, VisLine and VisAxis, shown in the README's line chart example.
@unovis/ssr for server-side rendering that outputs charts to SVG or PNG in Node.@unovis/mcp, an MCP server that generates charts as SVG.
Who uses it and how
- Product teams embedding dashboards directly in a React, Angular, Svelte, Vue or Solid application, importing only the components each view renders.
- Teams standardizing visualization across multiple front-end frameworks, since the same core backs every binding.
- Node services and build pipelines that need chart images without a browser, using
@unovis/ssr to emit SVG or PNG.
- Tooling and agent workflows that request charts as SVG through the
@unovis/mcp server.
- Developers starting from the documentation at unovis.dev or copying runnable code from the gallery, which also offers live StackBlitz examples.
Getting started
Install the core package together with the binding for the framework in use, for example npm install -P @unovis/ts @unovis/react, then import components such as VisXYContainer, VisLine and VisAxis.
How it compares
The facts provided do not name any paid product that Unovis replaces, and they do not name comparable visualization libraries. On the evidence available, it stands alone in this registry.
When to use it — and when not to
Unovis is a library, not a service, so a self-hoster operates no database, storage or mail server, but also gets no hosted backend, query layer or drag-and-drop dashboard builder; teams wanting a turnkey analytics product should look elsewhere. Adoption means bundling the components into an existing application and managing their CSS variables. The project is actively maintained, with the last push in September 2026 and 2,852 stars against 70 forks, though 100 open issues indicate a healthy but not idle backlog.
project readme (upstream, from github) — read inline
https://user-images.githubusercontent.com/755708/205744216-5e9efd10-794b-4ce1-9aca-580c34fad193.mp4
🟨 Unovis is a modular data visualization framework for React, Angular, Svelte, Vue, Solid and vanilla TypeScript or
- 📈 🗺 It has charts, maps, network graphs, and more!
- 🌳 Tree-shakable and supports individual component imports to reduce your bundle size;
- 🎨 Highly customizable, thanks to the CSS-variables support.
Learn more about Unovis on unovis.dev
Quick Start
You can install the core of the library @unovis/ts and framework-specific packages (if you use React, Angular, Svelte, Vue or Solid) from NPM:
npm install -P @unovis/ts @unovis/<react|angular|svelte|vue|solid>
Now you can import components and create your first chart! Here's how to build a simple line chart uising Unovis and React:
import React, { useCallback } from 'react'
import { VisXYContainer, VisLine, VisAxis } from '@unovis/react'

type DataRecord = { x: number; y: number }
const data: DataRecord[] = [
  { x: 0, y: 0 },
  { x: 1, y: 2 },
  { x: 2, y: 1 },
]

export function BasicLineChart (): JSX.Element {
  return (
    <VisXYContainer data={data}>
      <VisLine<DataRecord>
        x={useCallback(d => d.x, [])}
        y={useCallback(d => d.y, [])}
      ></VisLine>
      <VisAxis type="x"></VisAxis>
      <VisAxis type="y"></VisAxis>
    </VisXYContainer>
  )
}
Looking for Angular, Svelte, Vue, Solid or TypeScript examples? Check out the Quick Start page on our website.
Examples and Documentation
📖 Unovis has an extensive documentation with code snippets for React, Angular,
Svelte and TypeScript.
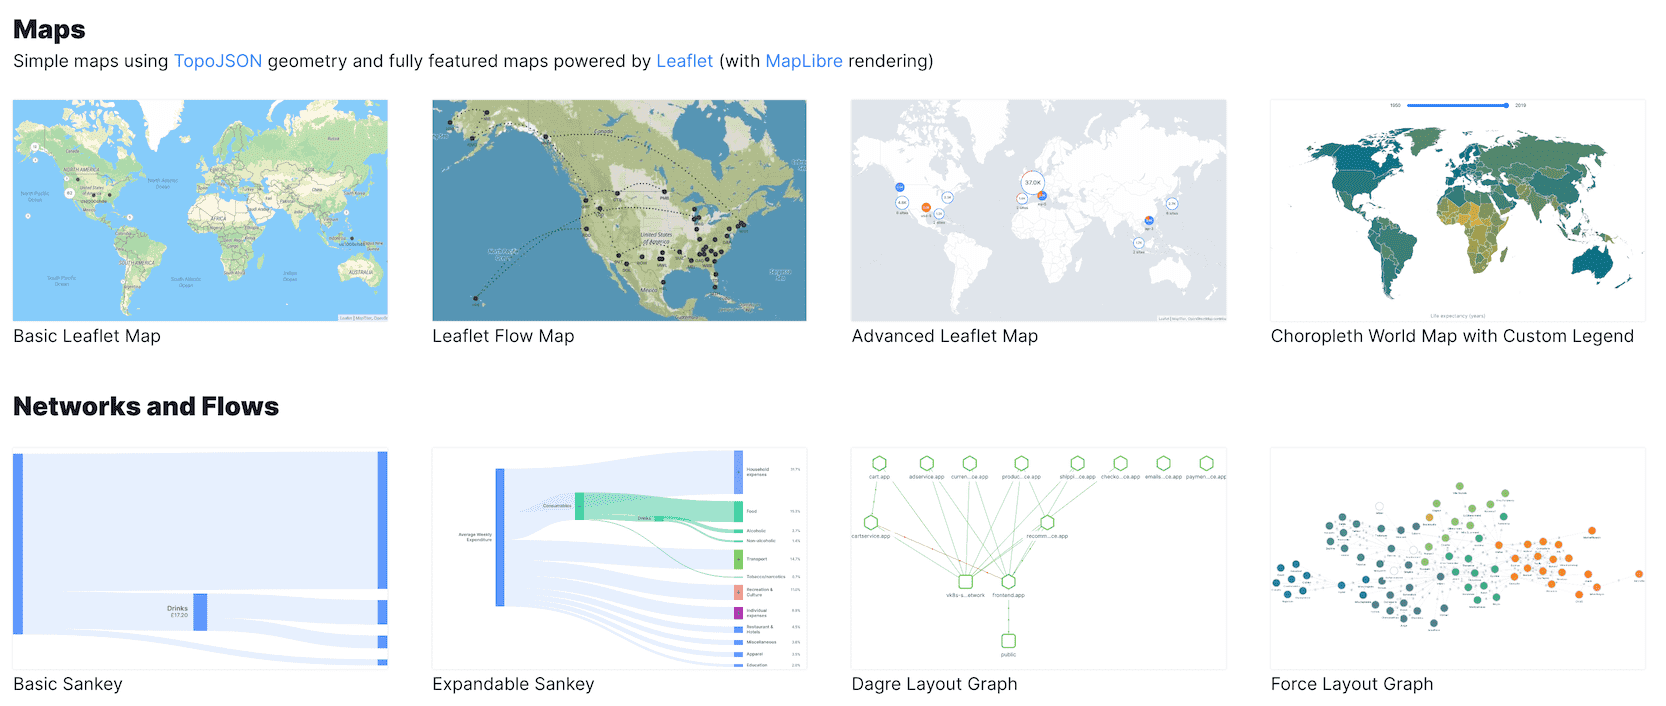
🖼 Also there's a growing gallery of examples, from where you can copy the code over to your project or try it live on StackBlitz.
Repository structure

Contributing
Pull requests are welcome. For major changes, please open an issue
first to discuss what you would like to change. For more information, please
read CONTRIBUTING.
Maintainers


Contributors


License
Unovis is licensed under Apache-2.0