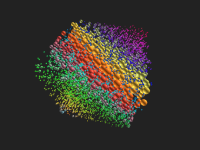
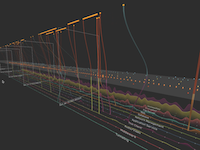
Troika is a collection of JavaScript tools for building interactive 2D and 3D graphics in the browser, aimed at developers who need WebGL-powered data visualization and are working with, or willing to adopt, Three.js.
What it is
Troika is a JavaScript framework and toolkit for interactive graphics in the browser, focused on 3D and WebGL and optimized for data visualization use cases. It ships in two parts: the Troika Framework, a fully featured framework for managing entire scenes with rich interactivity and high performance, and a growing set of other tools for Three.js that do not depend on that framework at all. It lives in the JavaScript ecosystem and spans canvas, WebGL, and WebXR rendering, as reflected in its repository topics.
The concrete problem it solves is the repeated plumbing that interactive graphics work always needs but that is hard to manage yourself. Instead of assembling scene management, interactivity handling, text rendering, and instancing by hand, developers get those pieces as reusable tools. The project's stated goal is to take the aspects of developing interactive graphics that you almost always need, but that are difficult to manage yourself, and make them as easy as possible. The specific thing it replaces is bespoke glue code written directly on top of a raw Three.js scene, and for teams adopting the full framework, a hand-rolled application layer for scene and interaction management.
Key capabilities
- The Troika Framework for managing entire scenes with rich interactivity and high performance.
- Standalone tools for Three.js that work without the framework.
- 3D text rendering, demonstrated in the project's example set.
- GPU instancing, shown through the instancing example.
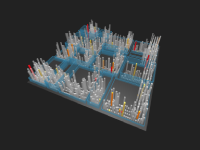
- A 3D bar chart and city grid example for volumetric data.
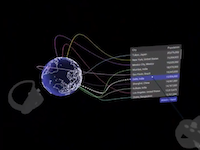
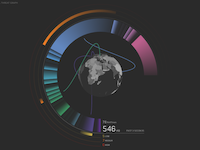
- A layered timeline example and a globe connections example for temporal and geospatial data.
- A protocol threat graph example, plus canvas, WebGL, and WebXR rendering support.
Who uses it and how
- Data visualization teams building 3D charts, such as the 3D bar chart and city grid demo, on top of Three.js.
- Security and network analysts rendering relationship graphs, as in the Protocol Threat Graph demo.
- Developers building layered timelines and globe connection views for temporal and geospatial data.
- Teams that need to draw many objects efficiently, using GPU instancing rather than per-object draw calls.
- Existing Three.js users who want individual Troika tools without adopting the whole framework.
Getting started
The README points readers to the Troika documentation at https://protectwise.github.io/troika, with live demos hosted at https://troika-examples.netlify.app, which is also published at troika-examples.netlify.com and covers text, instancing, city grid, and globe connections.
How it compares
The facts name Three.js as the neighbouring tool: Troika sits alongside and on top of it rather than replacing it, and a subset of Troika's tools is explicitly designed to be used without the framework, directly inside a Three.js project. The framework portion adds scene and interactivity management that plain Three.js leaves to the developer. The project is MIT licensed, so there is no per-seat or hosted cost model to weigh and nothing to license before use.
When to use it — and when not to
The README excerpt does not spell out install commands, so plan on reading the documentation site before integrating. It is a poor fit for static 2D charting, where canvas or SVG libraries are simpler, because Troika targets interactive 3D and WebGL first. The repository also carries 92 open issues, a maintenance queue worth reviewing before committing.