
Tracely
Production failures become regression tests.
Trace-native CI/CD for AI agents. Tracely grades every agent trace as it lands, clusters the failures into issues, freezes the bad runs into hermetic replayable cases, blocks the pull request that would ship them again — and tells you the moment any of it happens.
production trace → failure detection → regression test → CI gate → alert
Website · Docs · Product guide · Agent skill · Guided tour · 2-min demo · Design dossier






Self-host the whole stack in one click — API, worker, UI, Postgres, ClickHouse, Redis and MinIO:

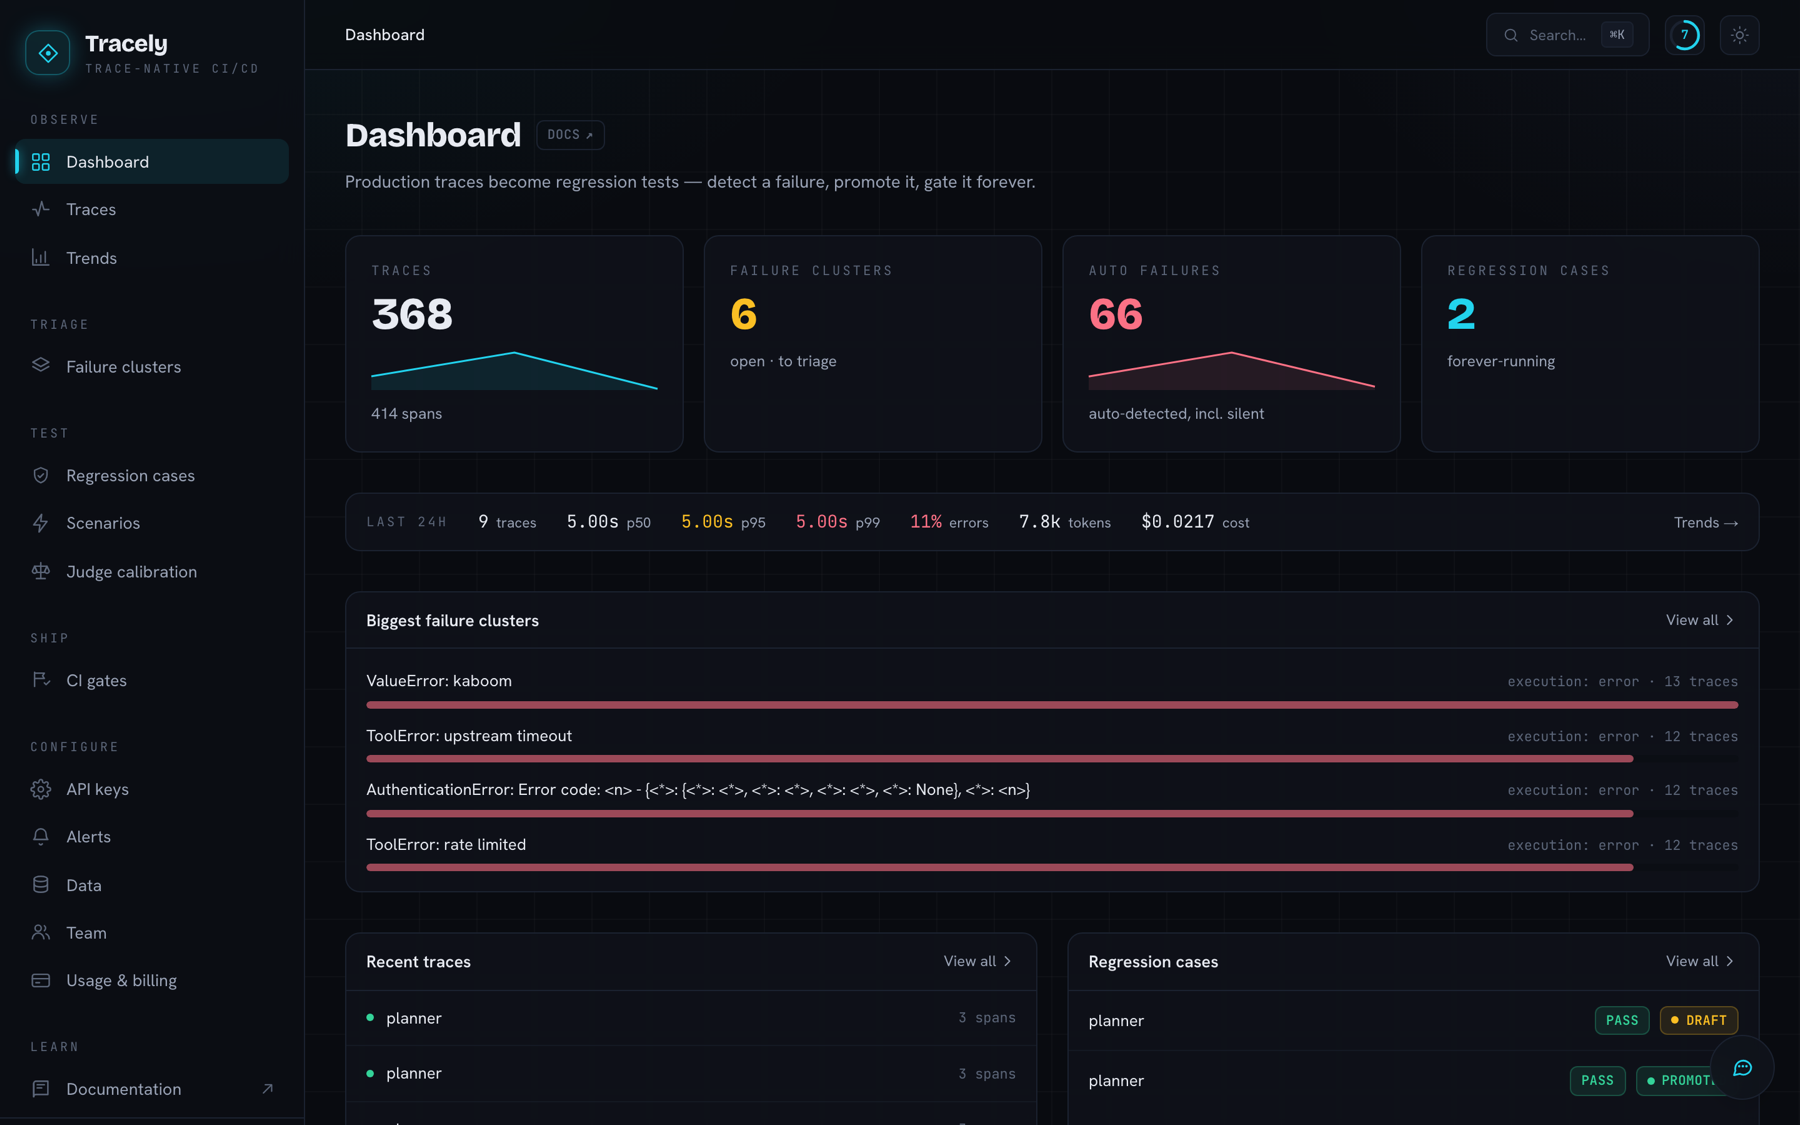
One workspace: what ran, what broke, what is already pinned as a test.
Why another agent-observability tool?
Because observability stops at the dashboard. You can see that your agent broke — then what?
Every eval tool asks you to hand-author a dataset: sit down, invent questions, write ideal answers, keep them current as the product changes. That dataset is a guess about what might break.
Production already handed you the real thing: a trace of the exact run that failed, with the exact input, the exact tool calls, the exact model responses.
The recorded run is the test. Tracely freezes that trace into a hermetic regression case and replays it on every PR. Everything else — quality scores, failure clusters, suggested fixes, CI verdicts, trends, alerts — is derived from the trace. There are no hand-authored datasets.
| Dataset-first tools | Tracely | |
|---|---|---|
| Where tests come from | You write them | Promoted from real failing traces |
| Fidelity to production | A guess | The exact failing run, byte for byte |
| Cost to replay in CI | Live model calls | $0 — recorded tool/LLM fixtures |
| What happens on regression | A dashboard number moves | The PR is blocked |
| How you find out | You go and look | It comes to you — Slack, email, your own webhook |
The loop
Five steps, five pages in the app.
1 · Observe — every run, hierarchically
Traces arrive over plain OTLP. Agent semantics (agent.id, conversation.id, turn, step) are
promoted to first-class indexed columns, so runs group into conversation threads instead of a flat
span soup. The waterfall shows agent → thinking → skill → generation → hand-off, with the failing
span in red and its I/O beside it.
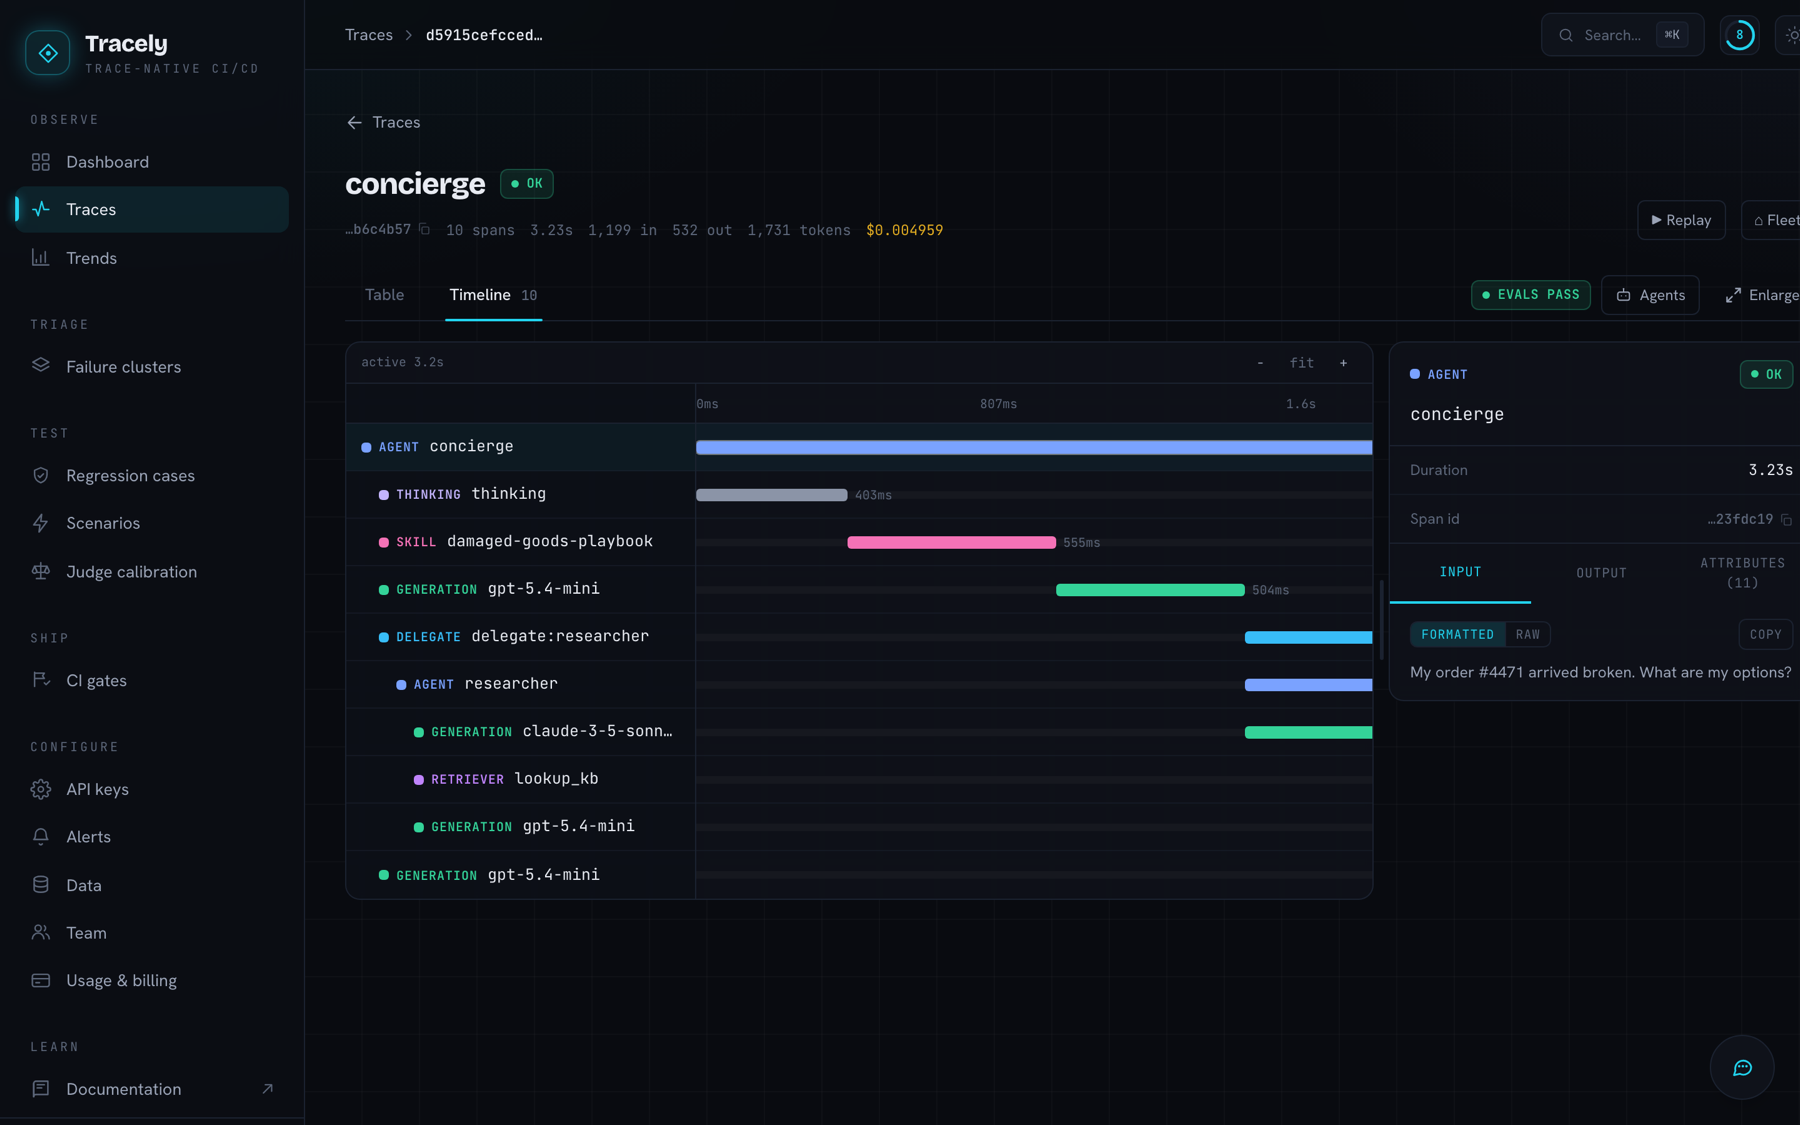
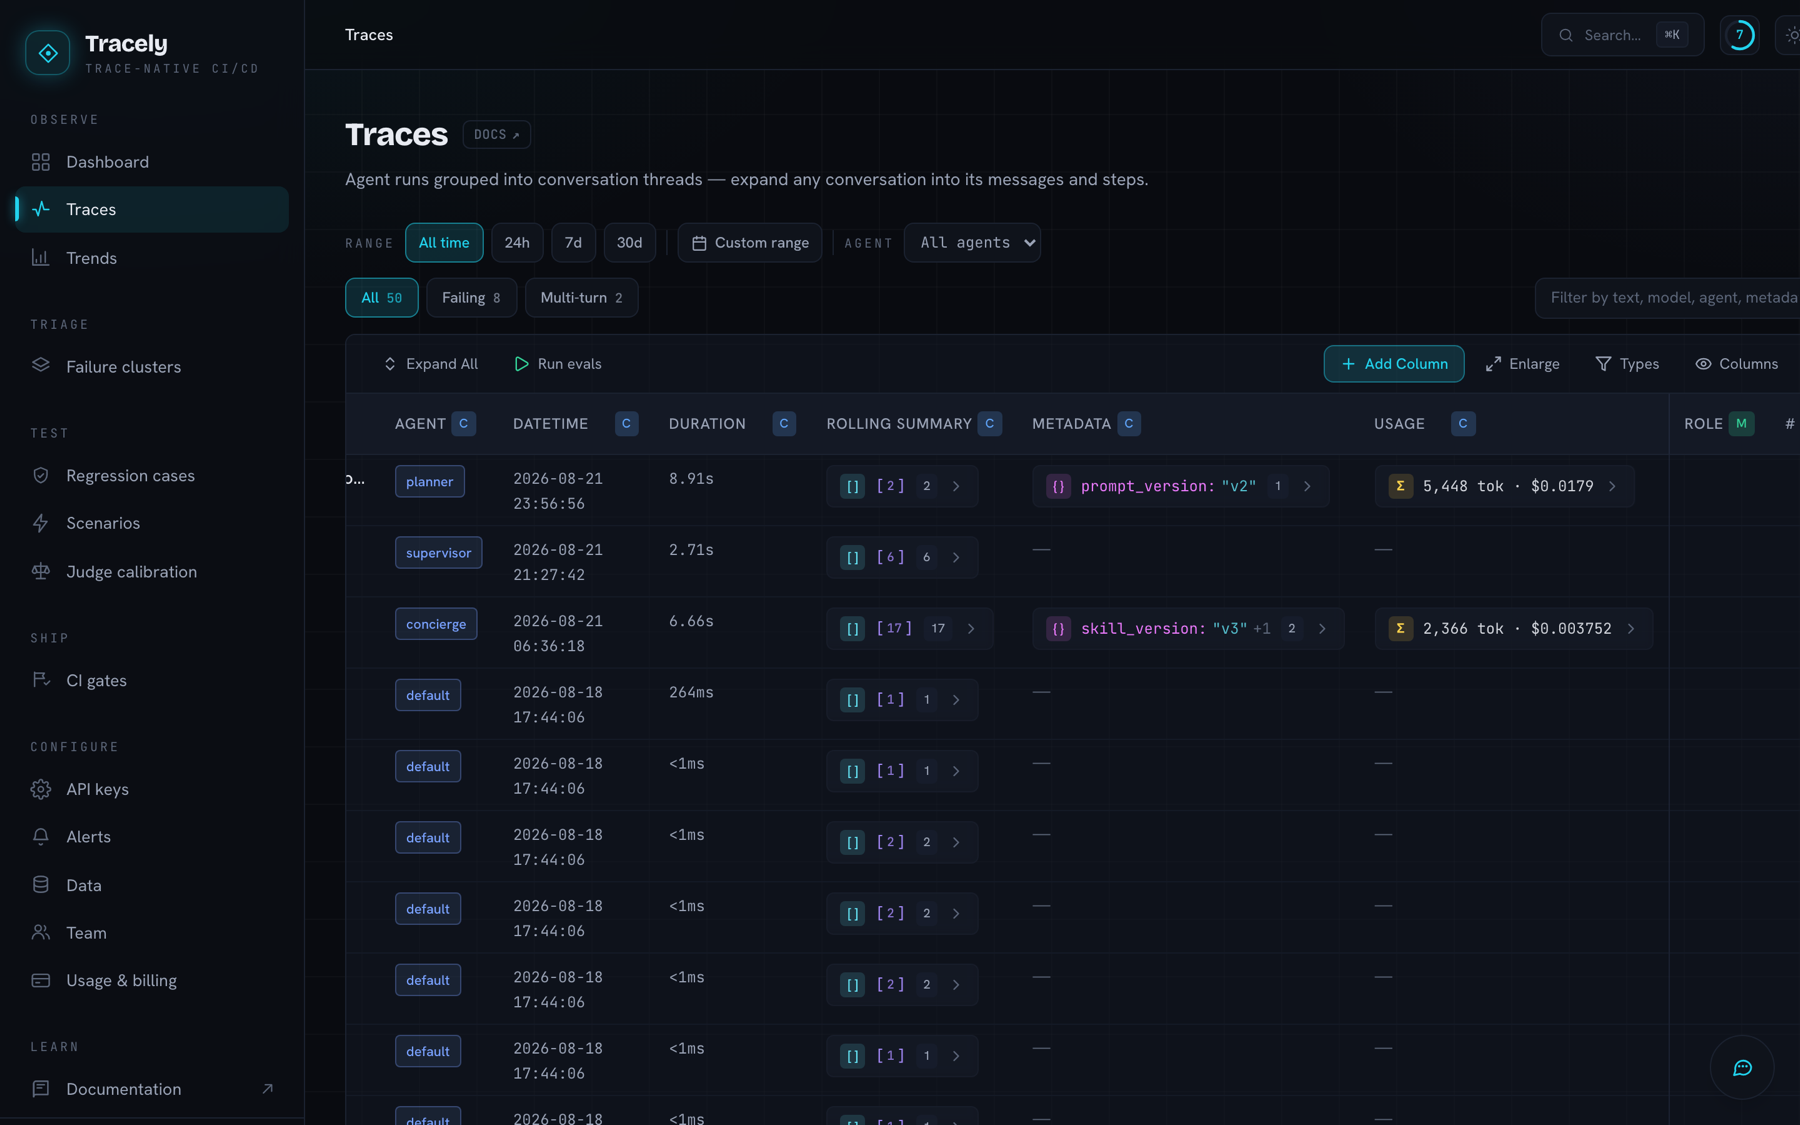
Evaluators are columns on the trace table, not a separate tab — each one grades at conversation, run or span level and writes its verdict into the grid. Scores stream in live over SSE as judges finish, so you watch a run get graded in place. Tokens, cost, latency, metadata and the rolling per-turn summary are columns too.
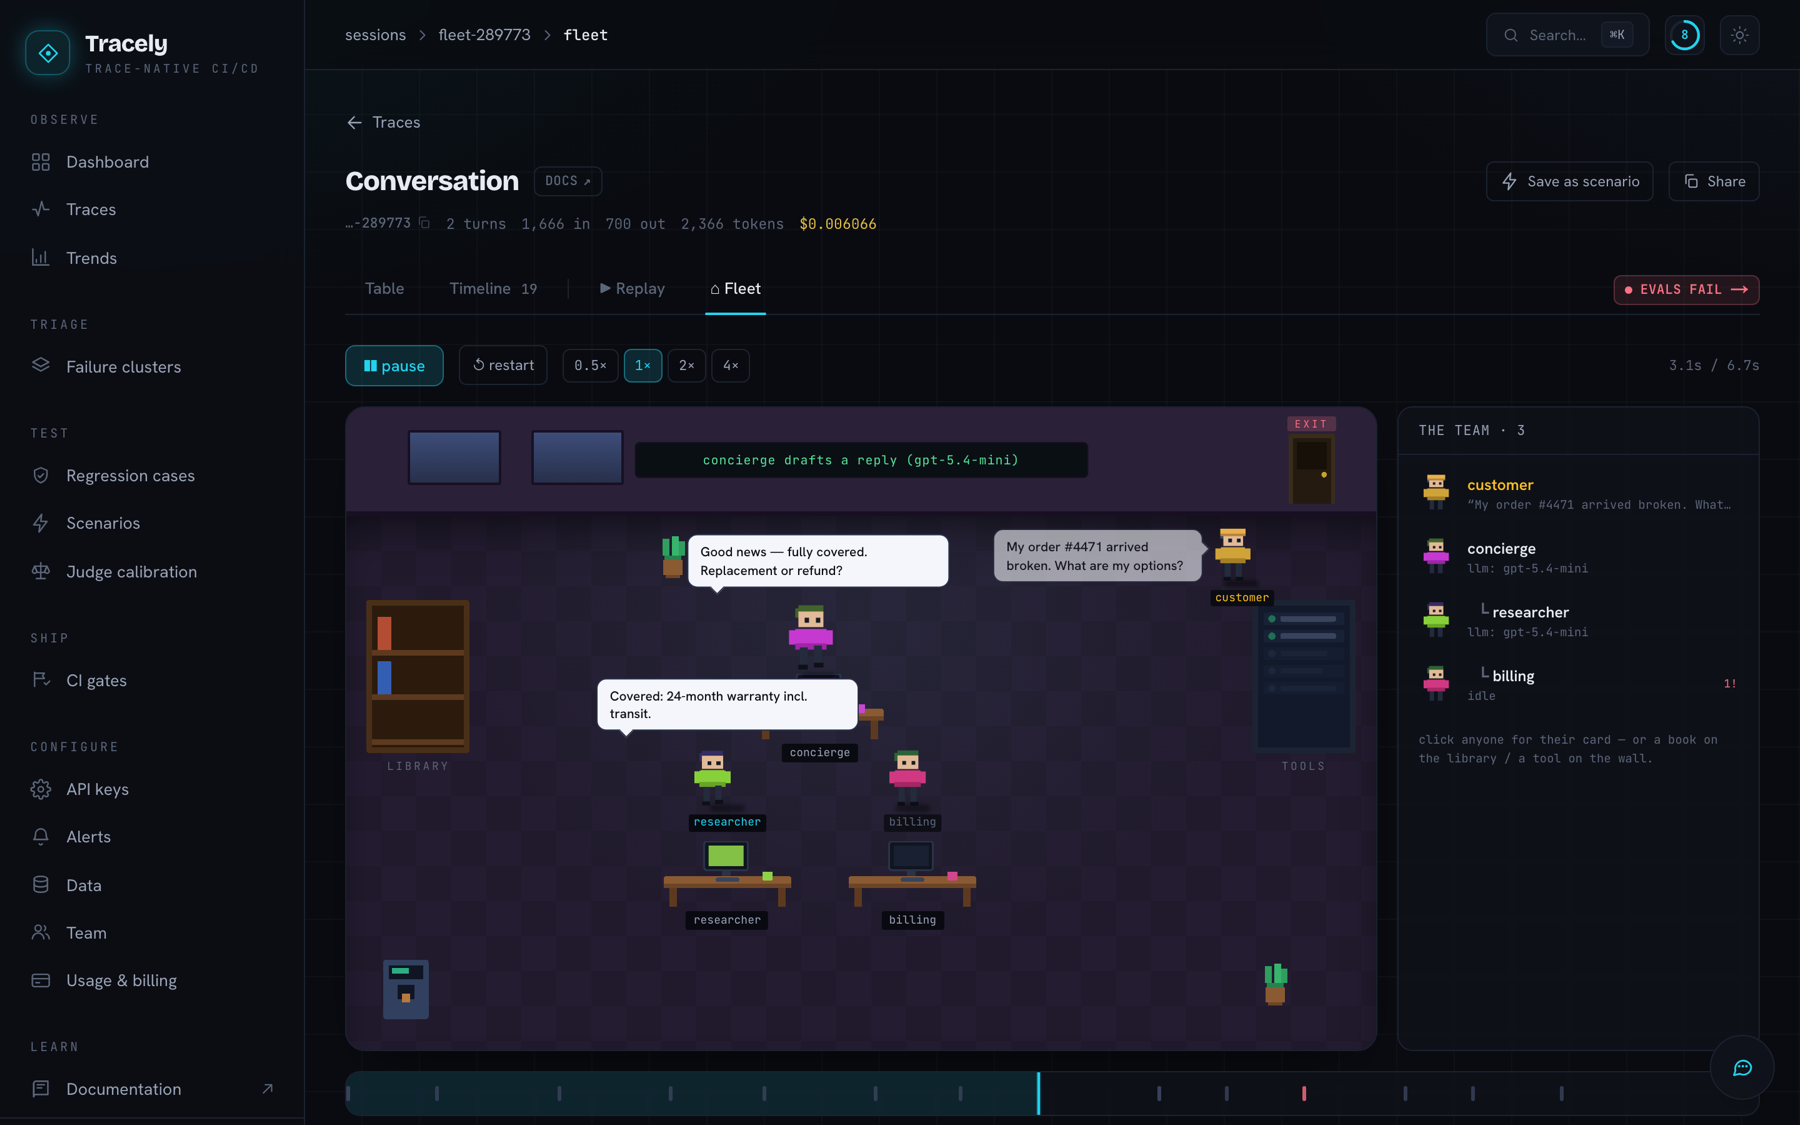
Two extra ways to read one conversation — a step-by-step replay, and a pixel-art office
Replay walks the conversation event by event on a timeline. Fleet renders the same conversation as a room: each agent is a character, hand-offs are walks across the floor, tools are objects on the wall — which turns out to be the fastest way to explain a multi-agent system to someone who doesn't read waterfalls.
2 · Detect & triage — failures group into issues
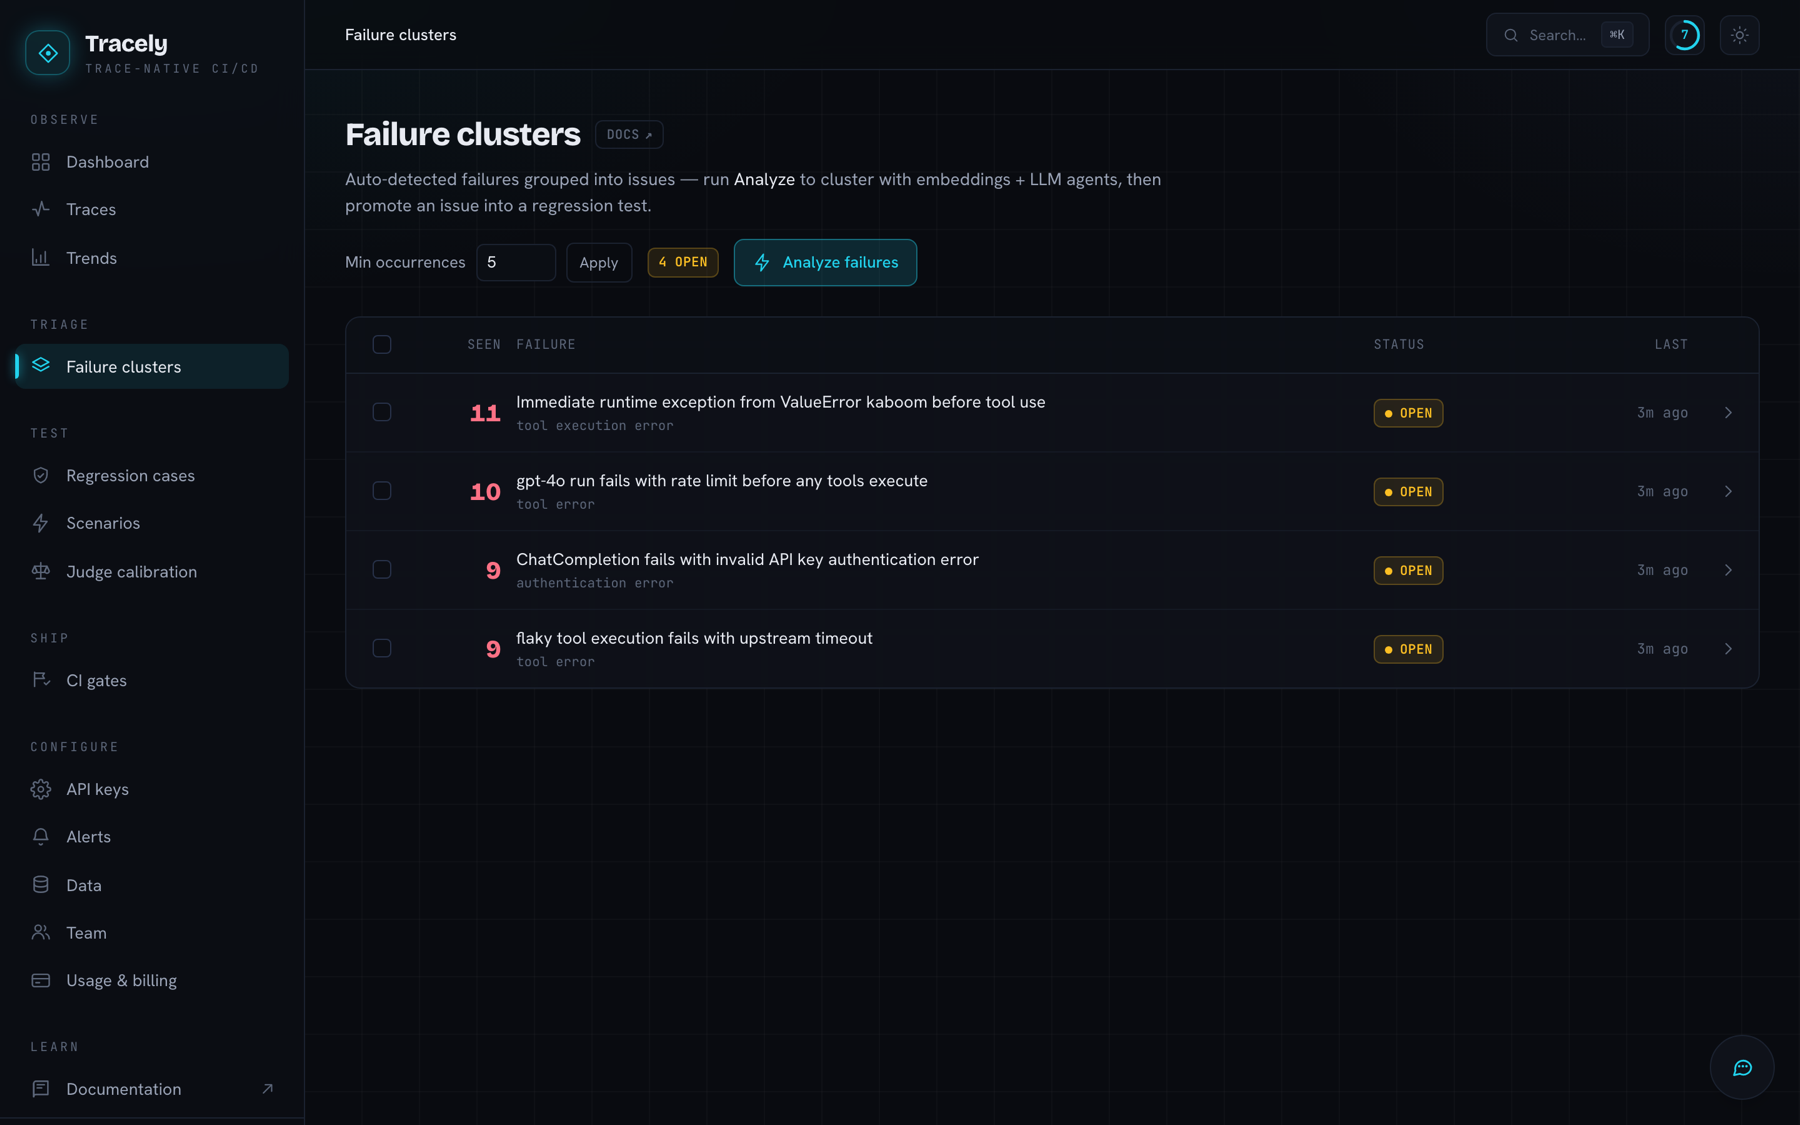
Online evaluators grade every run as it lands (LLM-as-judge at conversation / run / span level, plus structural checks that need no model at all). Failures then cluster — structurally and semantically — so 31 broken runs become one issue with a count, not 31 rows to read. Each cluster can suggest the evaluator that would have caught it.
3 · Test — freeze the failure
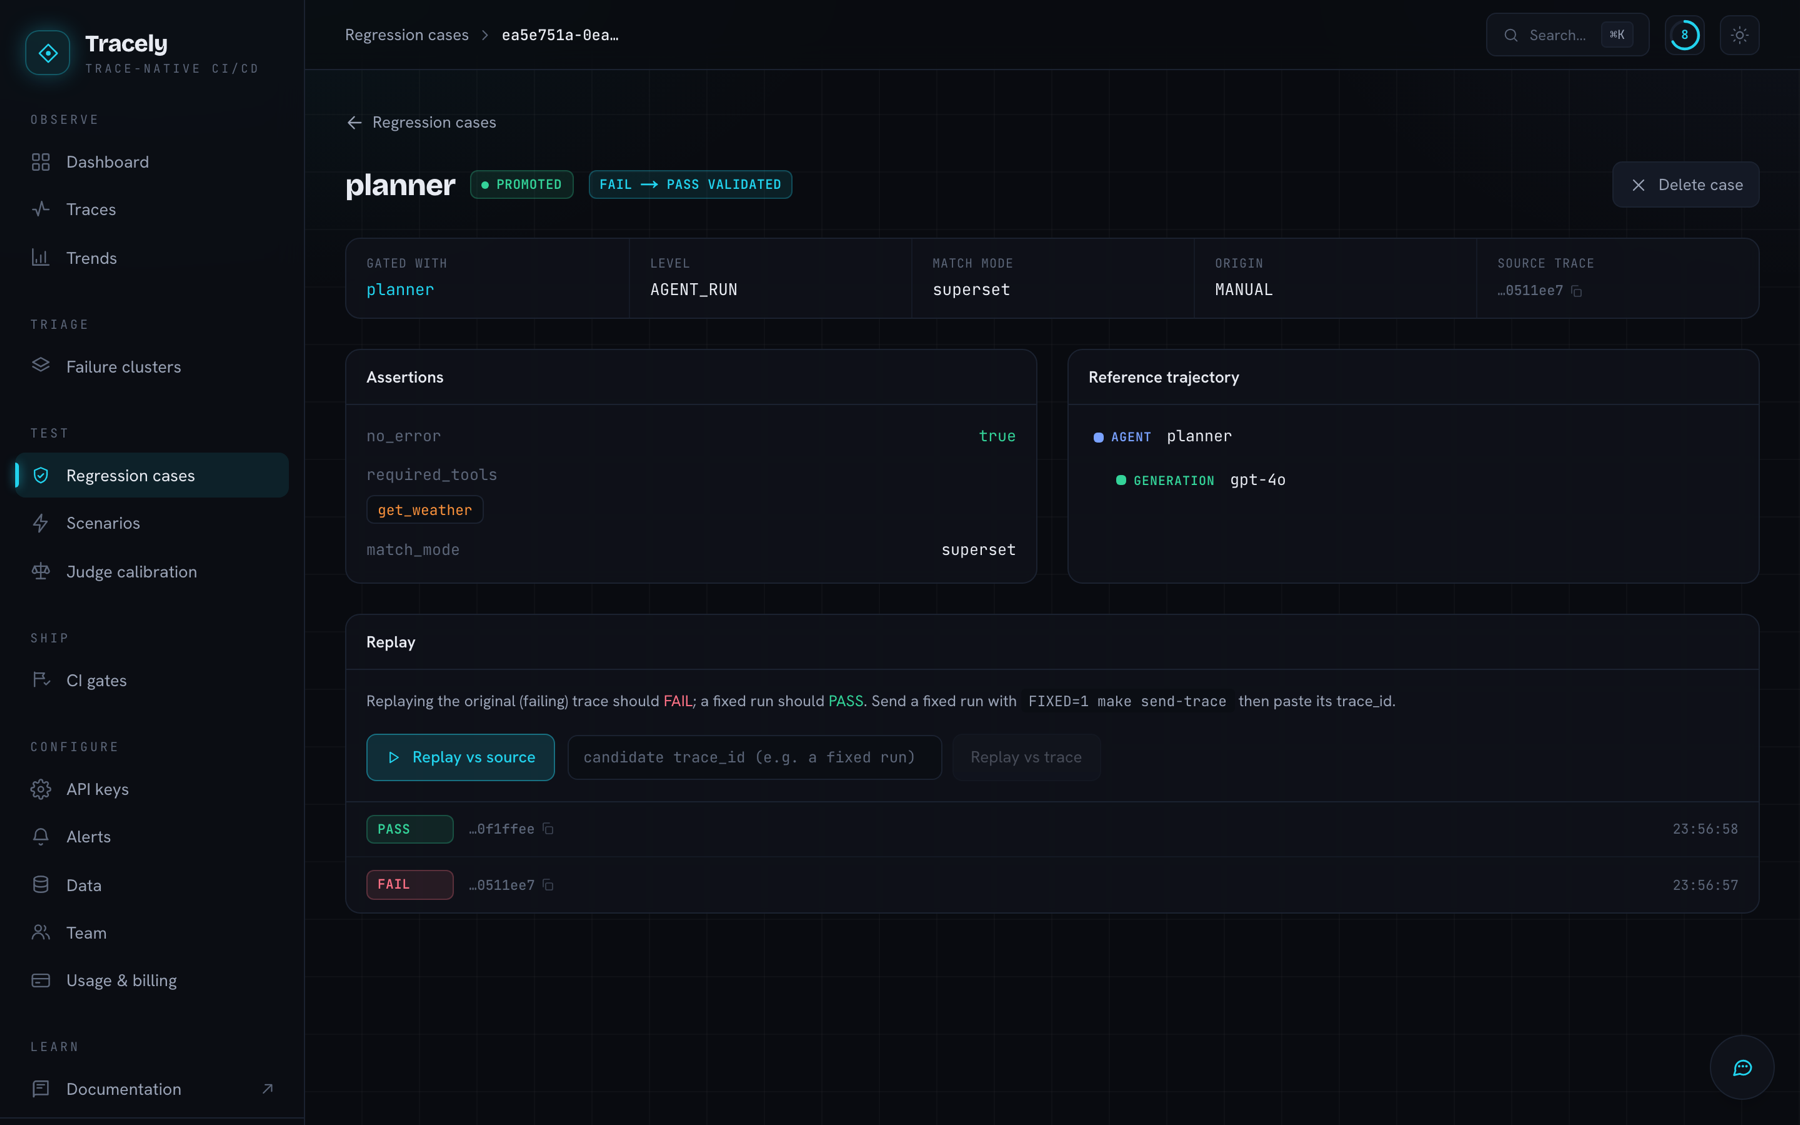
One click promotes a failing trace into a hermetic case: recorded input, tool and LLM outputs bundled as fixtures, and a fail-to-pass contract attached — the case must fail on the old code and pass on the fix, or the promotion isn't trusted. Multi-turn behaviour gets scenarios instead: a scripted conversation, or an adversarial goal a red-team model improvises against.
4 · Ship — block the PR
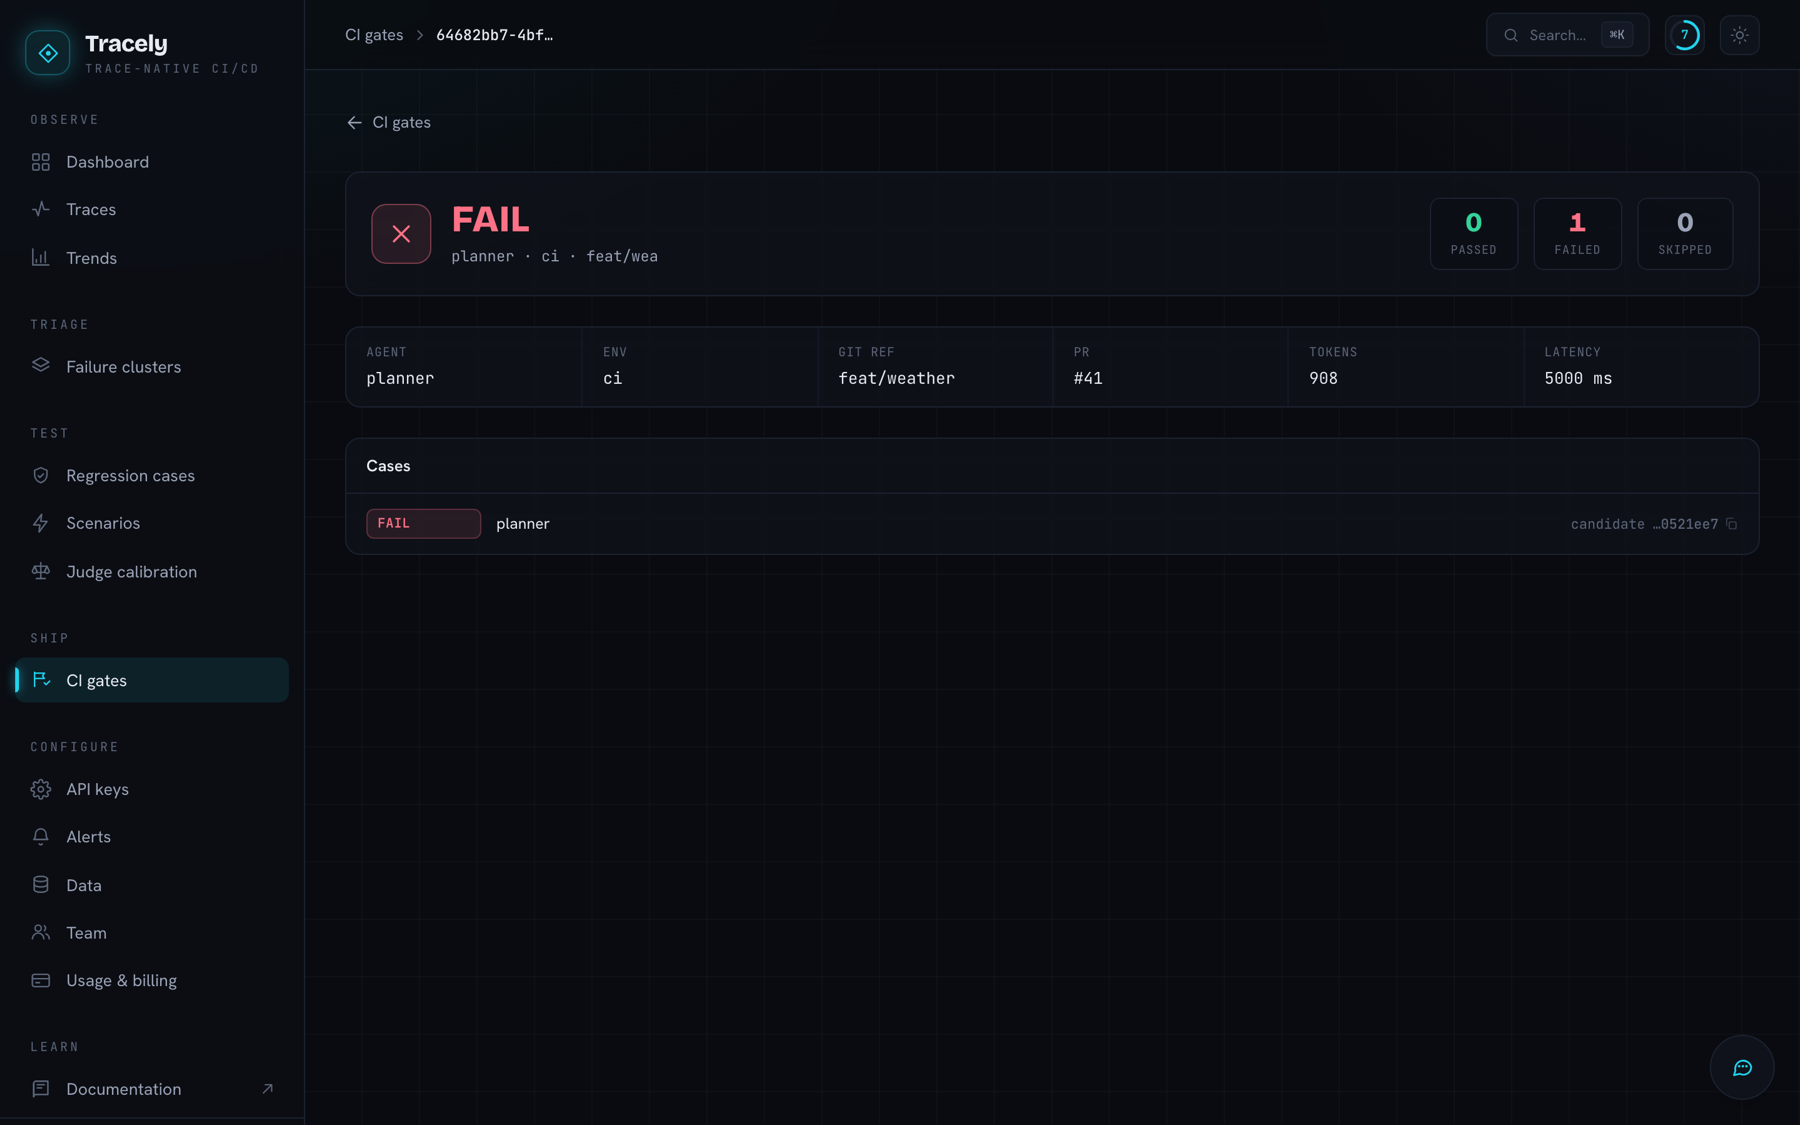
The suite replays in CI against recorded fixtures: deterministic, offline, no API keys and no model
spend. tracely gate exits non-zero, posts a commit status, and upserts a PR comment.
5 · Tell me — alerts as a flow
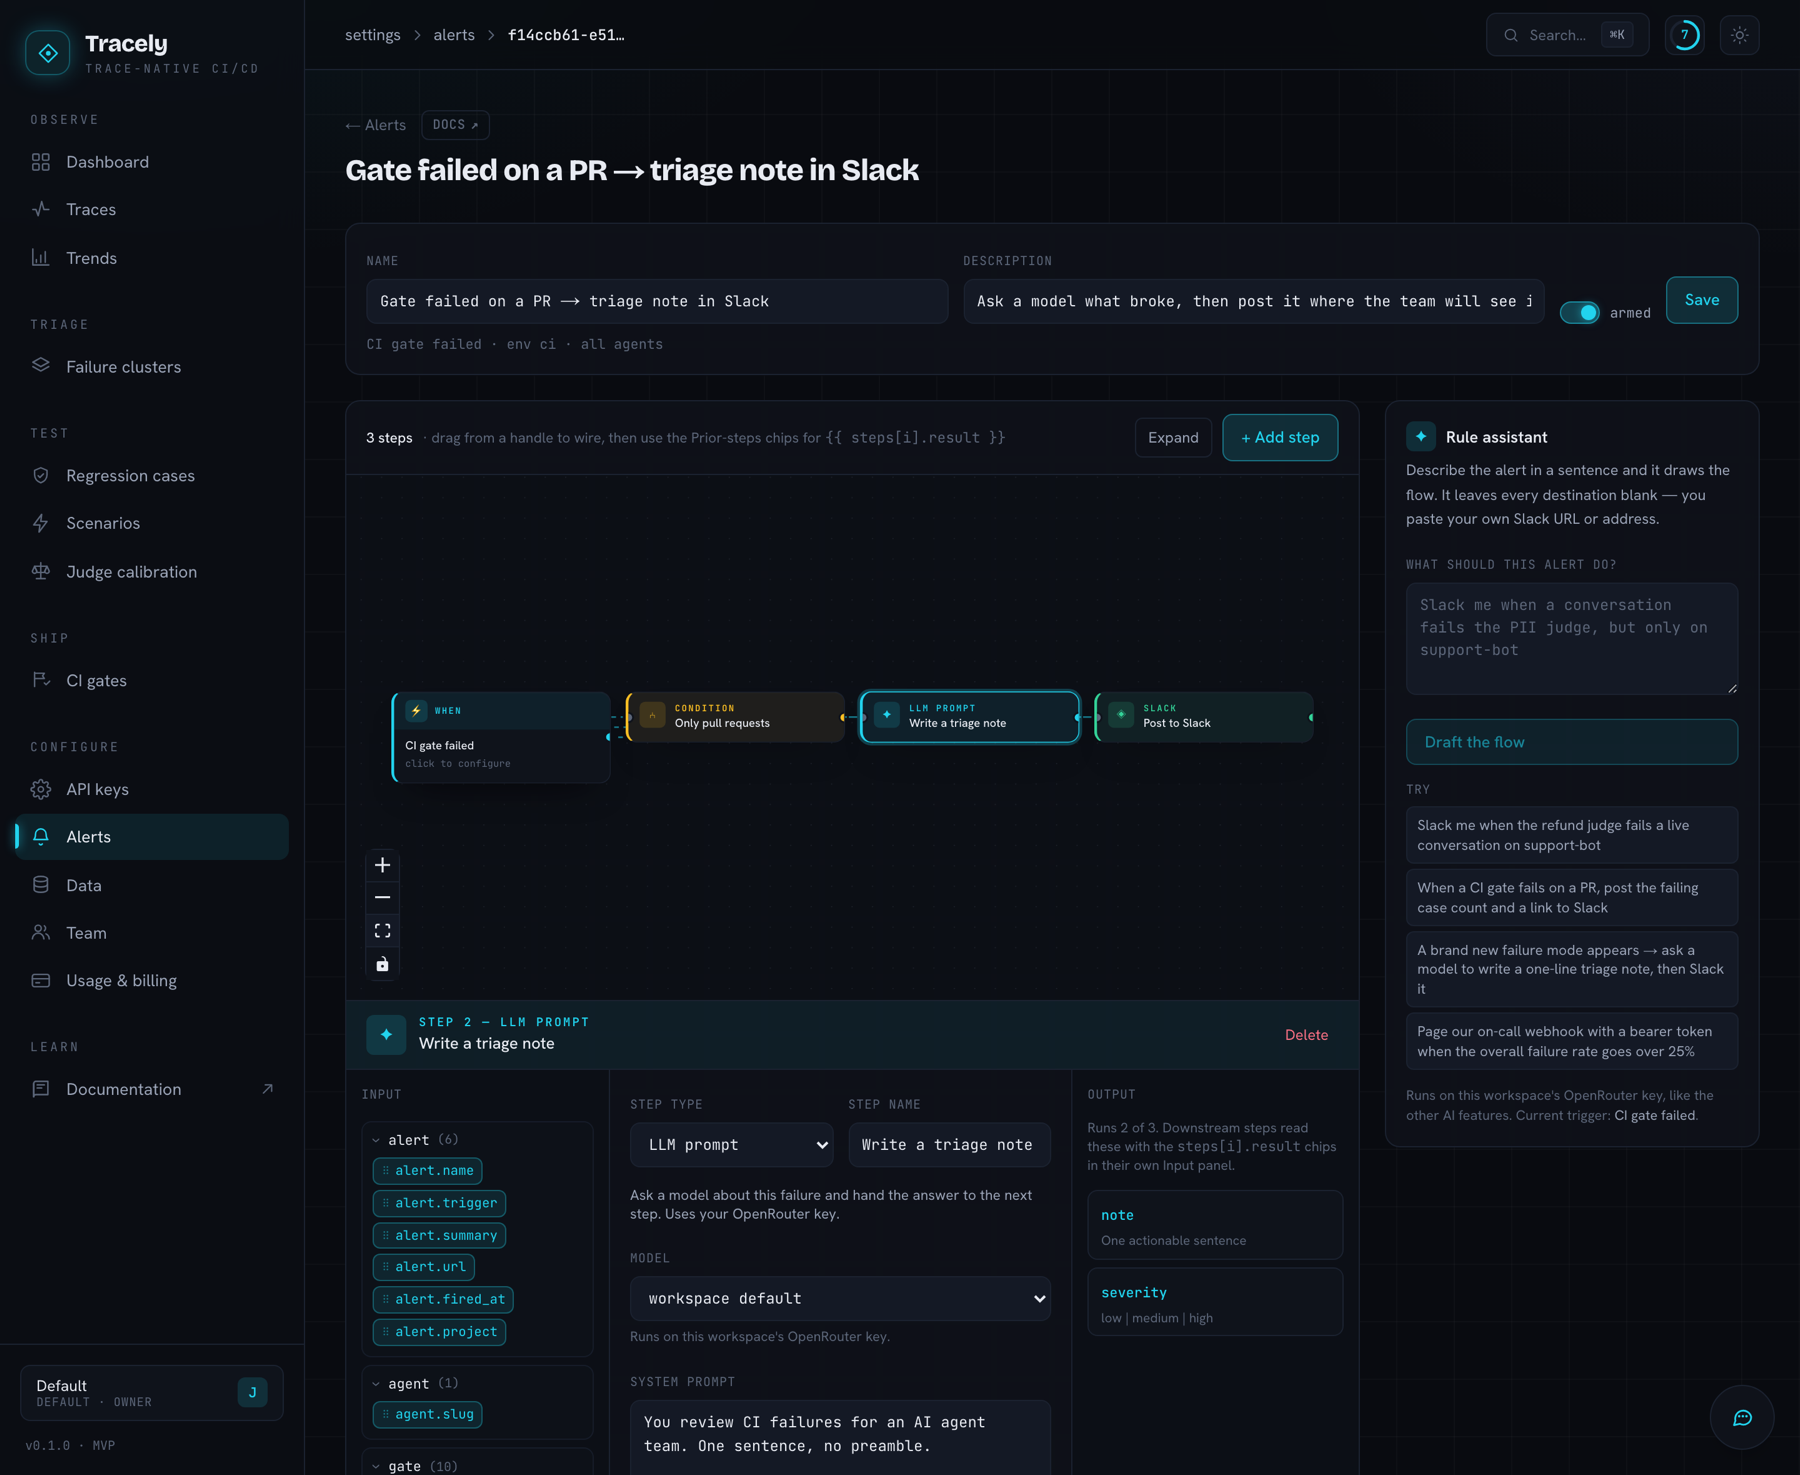
A rule has two halves: when (a gate fails, a live conversation breaks on a judge, a failure mode appears that nobody has seen before, or a rate crosses a line) and what happens — drawn on a canvas. Conditions that gate the rest of the flow, Slack, email, a webhook with your own method and headers, an LLM step whose answer the next step can use, and a Python expression for a number a template can't compute. Every field is a template over the failure's own variables, dragged in as chips. Or describe it to the in-app assistant and it draws the whole thing onto the canvas.
Plus — trends, cross-metric analysis, judge calibration
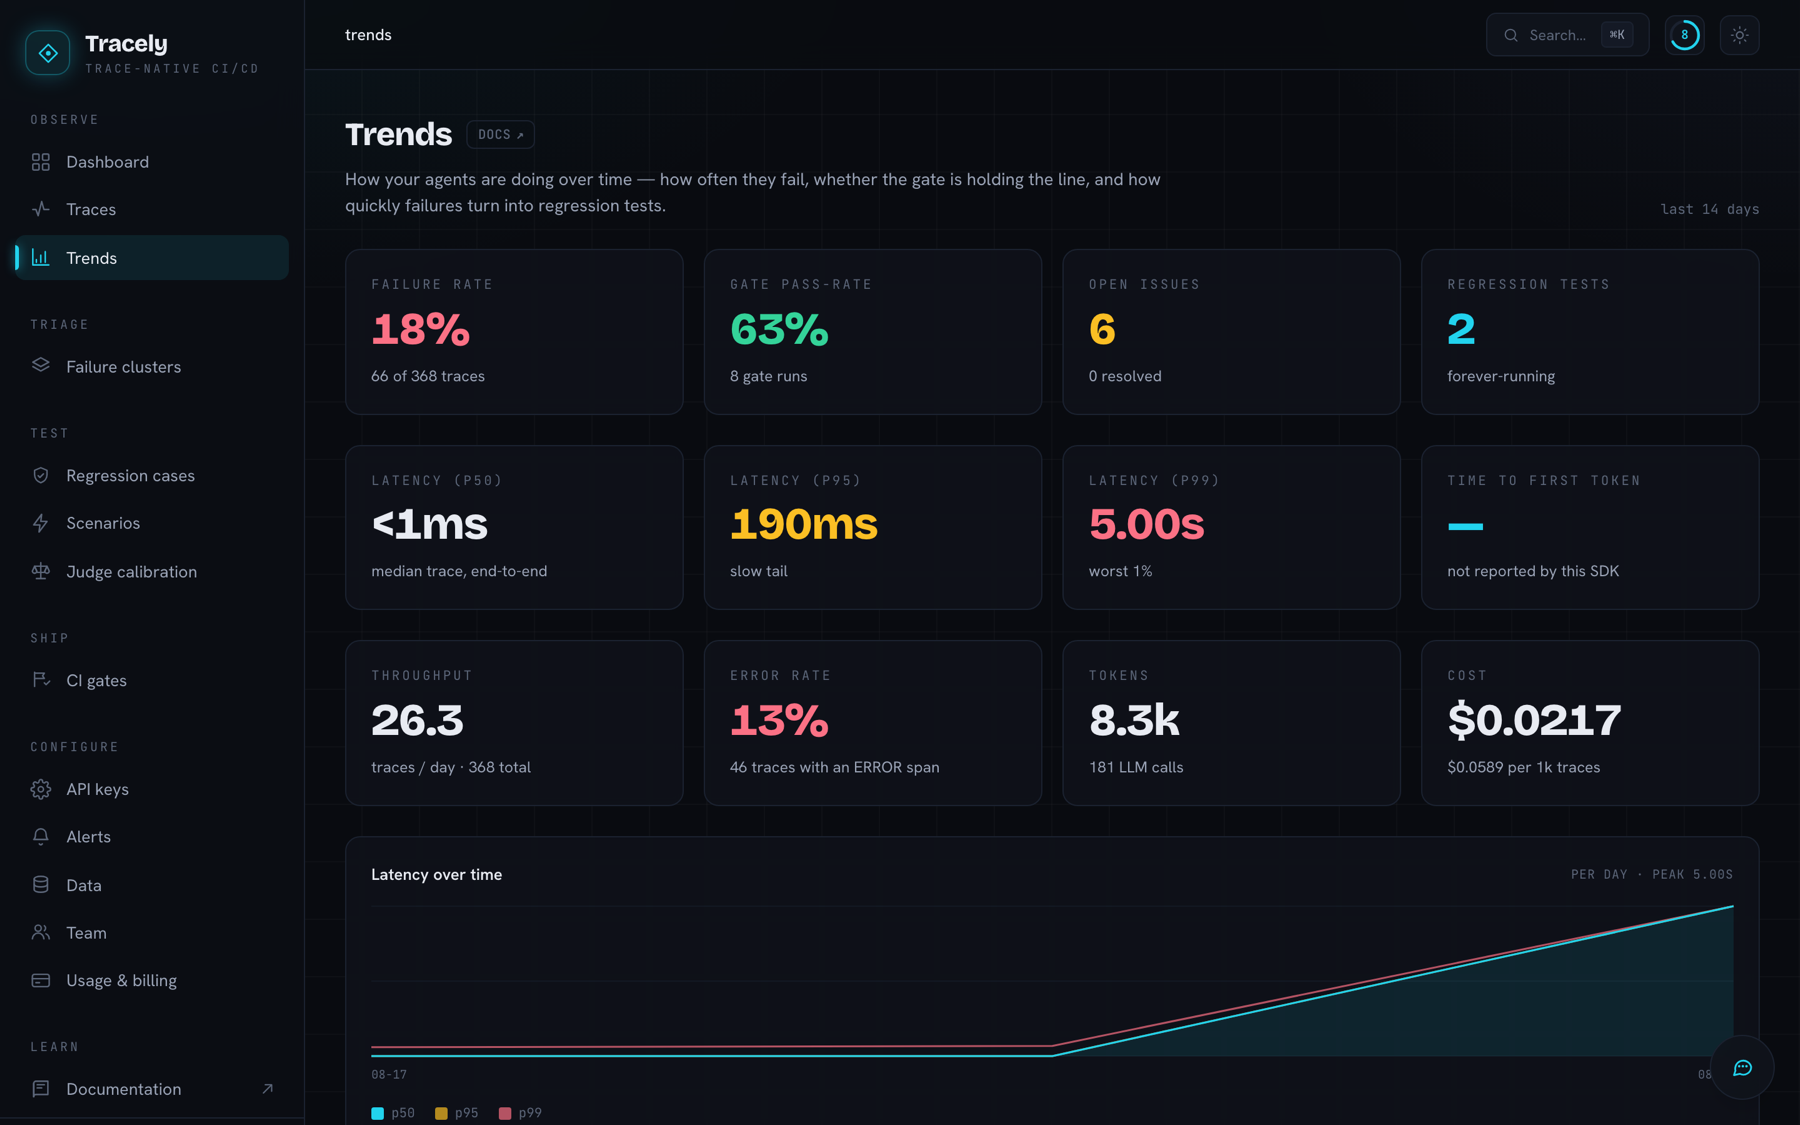
Daily failure and gate pass-rates, latency percentiles, token spend, per-agent meta-analysis (Spearman correlations + z-score outliers, LLM-synthesized) — and a calibration screen where you label judge verdicts against human review and see each judge's agreement, so you catch an over-flagging judge before you let it gate a release.
Everything in the box
| What it does | Where | |
|---|---|---|
| Ingest | OTLP/HTTP from any language; blob-first durability (S3 before the queue); agent semantics as indexed columns; three message conventions normalized | backend/ |
| Evaluators | Columns on the trace table. Structural checks (no model) + LLM judges at conversation / run / span level, multi-output (score, boolean, number, text, JSON schema), basic or @VARIABLE advanced prompts with live preview, batch or sequential, per-agent/env targeting, deterministic sampling, advisory verdicts |
Docs |
| Failure clusters | Structural signature + semantic embedding clustering, taxonomy, suggested evaluators, promote-to-case | Docs |
| Regression cases | Hermetic fixture bundles, fail-to-pass contracts, assertions, reference tra |