sitespeed.io is a free, open source monitoring & observability project written in JavaScript and released under MIT. It has 5,028 GitHub stars, 625 forks and 159 open issues, and was last pushed 33 hours ago. On this registry it ranks #90 of 191 tracked projects in Monitoring & Observability, with 5 head-to-head comparisons available.

What is sitespeed.io?

sitespeed.io is a free, MIT-licensed open-source web performance tool that drives real browsers to test, monitor, and optimize website speed, and it is aimed at developers, performance engineers, and operations teams that want their own measurement data without signing up for a hosted service.

What it is

sitespeed.io is an open-source web performance tool written in JavaScript and distributed through npm and Docker. It has been around since 2012. It drives a real browser — Firefox, Chrome, Edge, or Safari, including Safari on a real iPhone over USB — to load a page and then collects what happened during that load. A single run produces an HTML report containing Core Web Vitals, a video of the page loading, the HAR waterfall, and the Coach's best-practice advice. It is free, there is nothing to sign up for, and the data it produces belongs to whoever runs it.

The problem it solves is the gap between knowing a page feels slow and knowing why. Instead of opening a page by hand and inspecting it once in a browser, a user runs a command and receives a structured report built from an actual browser load: LCP, INP, CLS, TTFB, and FCP scored against Google's p75 thresholds, visual metrics such as First Visual Change and Speed Index, the HTTP Archive request waterfall, and a checklist of concrete fixes with severity and scores. That same run can be repeated in continuous integration to catch regressions before they ship, or on a schedule in production so performance is tracked over time rather than discovered after an incident.

Key capabilities

  • Collects Core Web Vitals — LCP, INP, CLS, TTFB, and FCP — and scores them against Google's p75 thresholds.
  • Captures a video and visual metrics including First Visual Change, Speed Index, Last Visual Change, and a scrubable filmstrip.
  • Renders the HAR waterfall with waterfall-tools.
  • Produces the Coach's advice, a checklist of best-practice rules with severity, scores, and concrete fixes.
  • Reports CPU and long-task analysis showing what the main thread was doing during the load.
  • Exports metrics to Graphite or InfluxDB for long-term tracking in Grafana dashboards.
  • Runs against Firefox, Chrome, Edge, and Safari, including Safari on a real iPhone over USB.

Who uses it and how

  • Developers auditing a single slow page from a terminal with sitespeed.io https://example.com, then opening the generated HTML report.
  • Teams running it on every pull request as continuous integration regression testing, failing the build when a performance budget is exceeded.
  • Operations teams running it on a schedule in production, shipping metrics to Graphite or InfluxDB and watching the site over time in a Grafana dashboard.
  • Performance engineers testing mobile behaviour by driving Safari on a real iPhone connected over USB.
  • Teams that want consistent browser versions and dependencies, which the Docker image supplies with Firefox, Chrome, and Edge already installed.

Getting started

The easiest route is Docker: docker run --rm -v "$(pwd)":/sitespeed.io sitespeedio/sitespeed.io https://www.sitespeed.io. A NodeJS installation through npm is also available, and the full guide covering installation, configuration, scripting, and monitoring lives at sitespeed.io/documentation.

How it compares

No comparable or competing products are named in the material available for this entry, so sitespeed.io stands alone in this registry on that axis. What can be stated plainly is its position: MIT-licensed, free, no sign-up, and full ownership of every metric it produces.

When to use it — and when not to

A self-hoster must run Docker or NodeJS with real browser binaries, and anyone wanting the production monitoring workflow also has to operate a time-series database such as Graphite or InfluxDB plus Grafana. Teams that do not want to maintain browsers and metrics infrastructure, or that need a fully hosted service with nothing to run, should look elsewhere. The README excerpt is deliberately compact and defers configuration, scripting, and monitoring detail to external documentation, and the repository carries 159 open issues, so prospective users should expect to read beyond the repository page and to keep up with browser and dependency maintenance.

project readme (upstream, from github) — read inline

sitespeed.io

Unit tests Linux browsers Docker Docker security scan Windows Edge OSX Safari Test upload functionality Downloads Docker Stars npm Changelog #212

Website | Documentation | Changelog | Bluesky | Mastodon

Table of Contents

What is sitespeed.io?

sitespeed.io is an Open Source web performance tool. Run it once to debug a slow page and you get an HTML report with Core Web Vitals, a video of the page loading, the HAR waterfall and the Coach's advice on how to fix what's slow. Run it every hour against your site, ship the metrics to Graphite or InfluxDB, and you have a Grafana dashboard tracking your site's performance over time.

It's been around since 2012, it's free, you own all your data, and there's nothing to sign up for.

sitespeed.io drives a real browser — Firefox, Chrome, Edge, or Safari (including Safari on a real iPhone over USB) — to load your page, then collects:

  • Core Web Vitals — LCP, INP, CLS, TTFB and FCP, scored against Google's p75 thresholds.
  • A video and visual metrics — First Visual Change, Speed Index, Last Visual Change, plus a scrubable filmstrip.
  • The HAR waterfall — rendered with waterfall-tools.
  • The Coach's advice — a checklist of best-practice rules with severity, scores and concrete fixes.
  • CPU and long-task analysis — what the main thread was doing during the load.

Three common ways to use it:

  • Audit a page from your terminal. Run sitespeed.io https://example.com, open the HTML report, see what's slow.
  • CI regression testing. Run on every PR, fail the build if a budget is exceeded.
  • Production monitoring. Run on a schedule, ship metrics to Graphite or InfluxDB, watch your site over time in Grafana.

Documentation

The full guide lives at sitespeed.io/documentation — installation, configuration, scripting, monitoring, and a walkthrough of every metric we collect.

Installation

Docker

Easiest way to run sitespeed.io — the Docker image ships with Firefox, Chrome, Edge and the dependencies you need:

docker run --rm -v "$(pwd)":/sitespeed.io sitespeedio/sitespeed.io https://www.sitespeed.io/

The -v flag mounts the current directory so the test results land somewhere you can find them.

NodeJS

If you'd rather install via npm:

npm i -g sitespeed.io

Then test a URL:

sitespeed.io https://www.example.com

You'll need a browser installed locally (Firefox / Chrome / Edge / Safari), plus FFmpeg and Python if you want video and visual metrics. See the installation guide for the full list.

Usage

Basic usage

Pass a URL and sitespeed.io will load it. Add -n 5 to run five iterations and report the median (recommended for any real measurement — single runs are noisy):

sitespeed.io https://www.example.com --browser chrome -n 5

Advanced configuration

Lots of flags. --help shows them all:

sitespeed.io --help

See the configuration documentation for the long form.

Mobile testing

Real Android phones over USB:

sitespeed.io https://www.example.com --android

Real iPhones over USB (new in 40.0):

sitespeed.io https://www.example.com -b safari --safari.ios

Setup guides: Android, iOS.

Examples

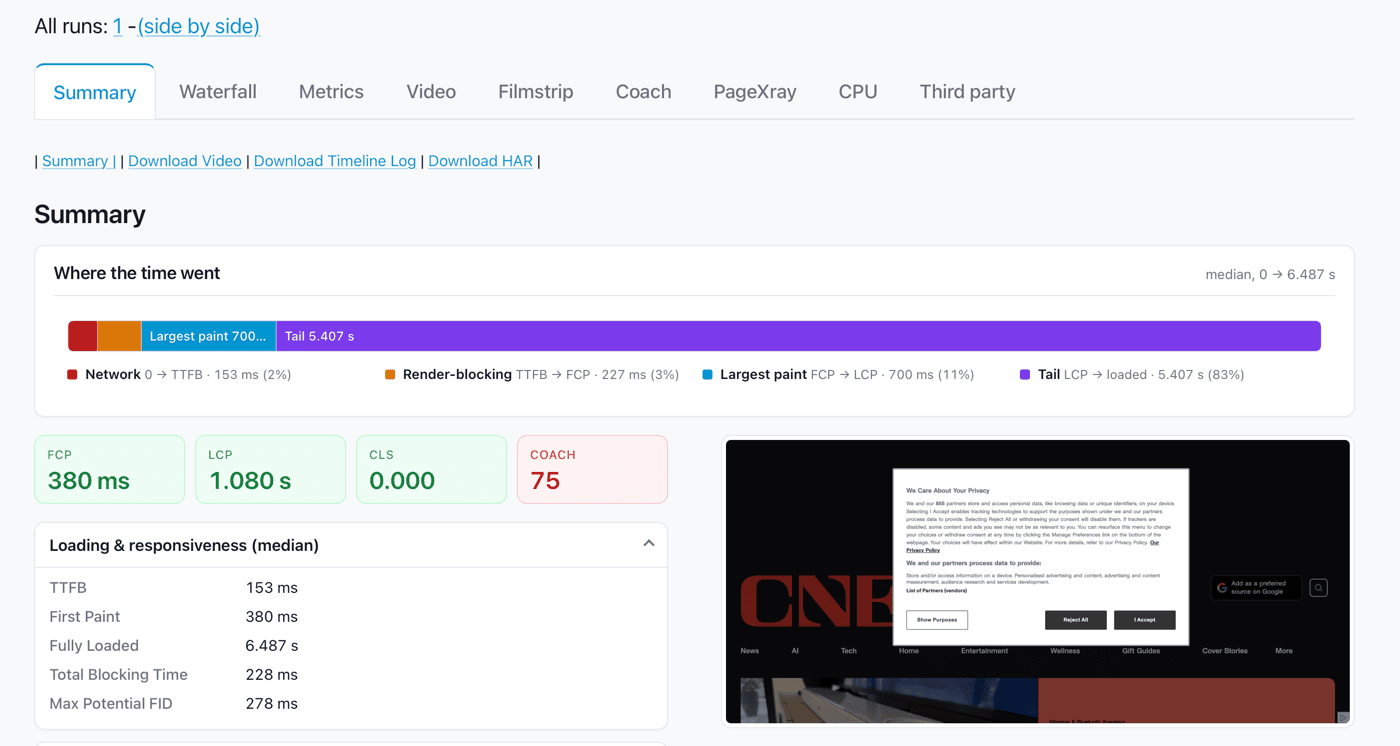
Summary report

The redesigned summary tab

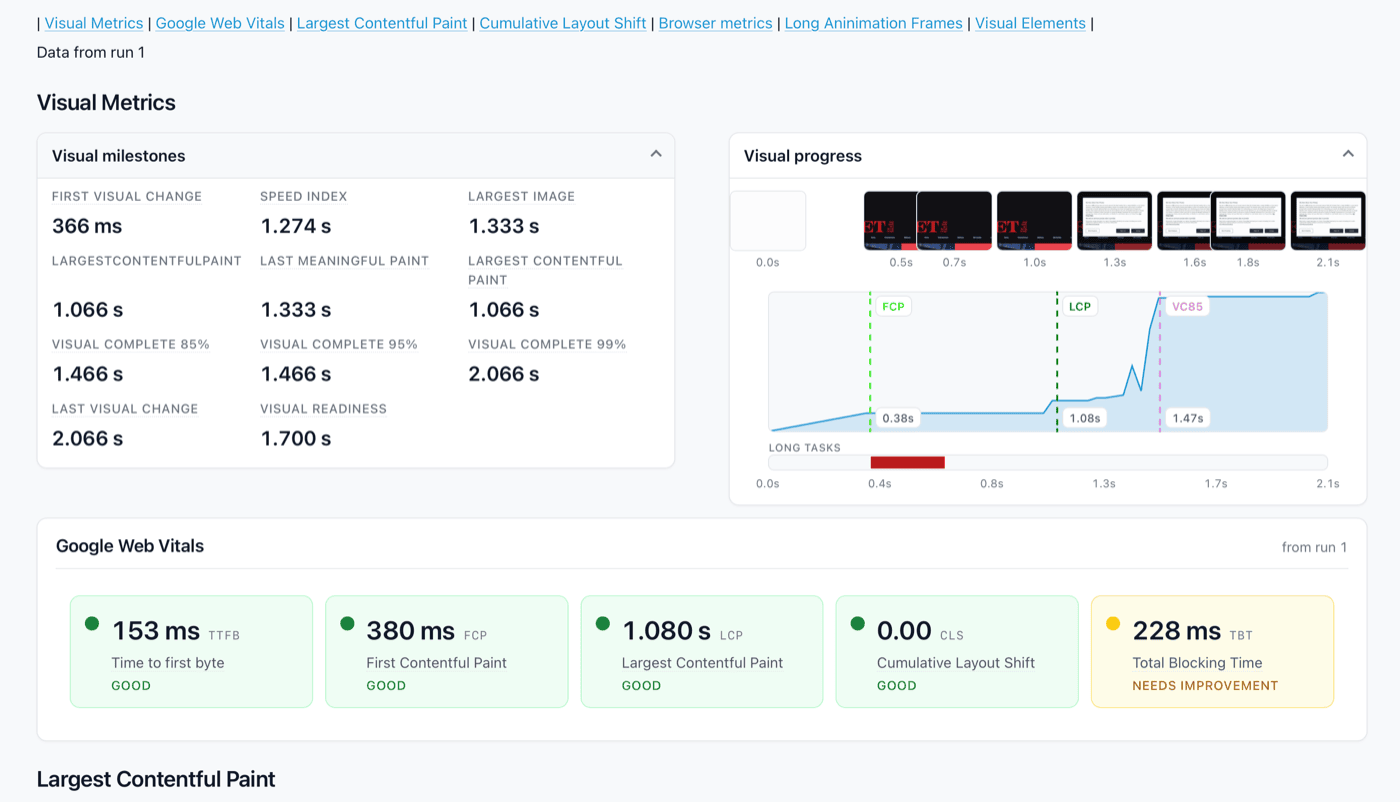
Per-URL report

The redesigned metrics tab

Continuous monitoring in Grafana

Live setup at dashboard.sitespeed.io — sitespeed.io feeding Graphite, visualised with Grafana.

Graphite/Grafana Metrics

Trends over time:

Grafana Trends

Video

Video of the page loading, captured with --video --visualMetrics:
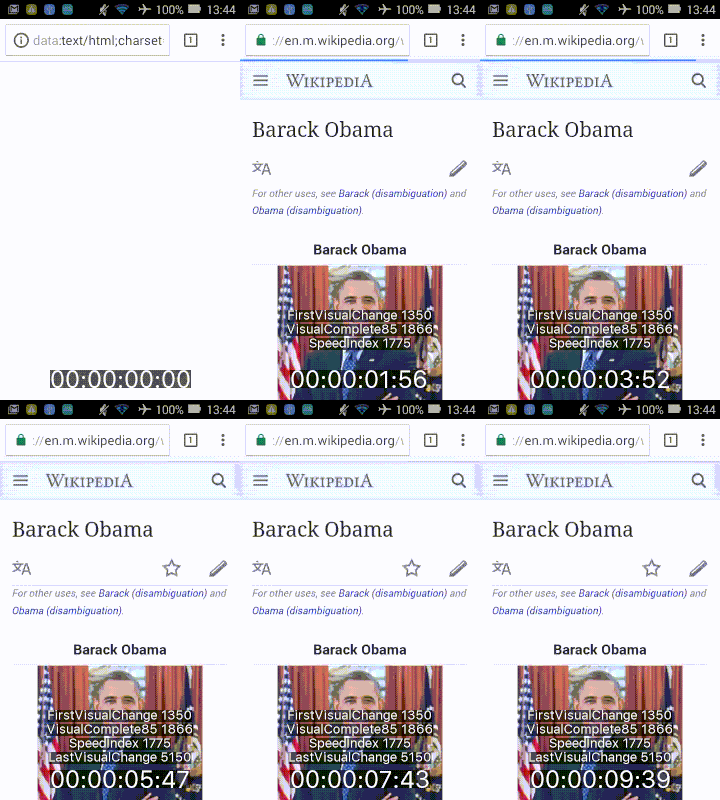
Video Analysis

Contributing

We'd love your help — code, docs, design, bug reports, or just letting us know what's missing. Open an issue first if you want to discuss, then fork, branch and submit a PR. The full guide is in CONTRIBUTING.md.

Reporting issues

Bugs and feature requests go on GitHub Issues. Search first to avoid duplicates.

Community

License

The MIT License (MIT).

Frequently asked questions

Is sitespeed.io free to use?

sitespeed.io is open source under the MIT licence. There is no licence fee and no seat count — you can self-host it or, where the project offers one, pay a vendor for a managed version instead.

What does sitespeed.io do?

sitespeed.io is an open-source tool for comprehensive web performance analysis, enabling you to test, monitor, and optimize your website’s speed using real brow

What is sitespeed.io written in?

sitespeed.io is primarily written in JavaScript. Its source is publicly available at https://github.com/sitespeedio/sitespeed.io, and it has 5,028 GitHub stars.