
Making SLOs with Prometheus manageable, accessible, and easy to use for everyone!
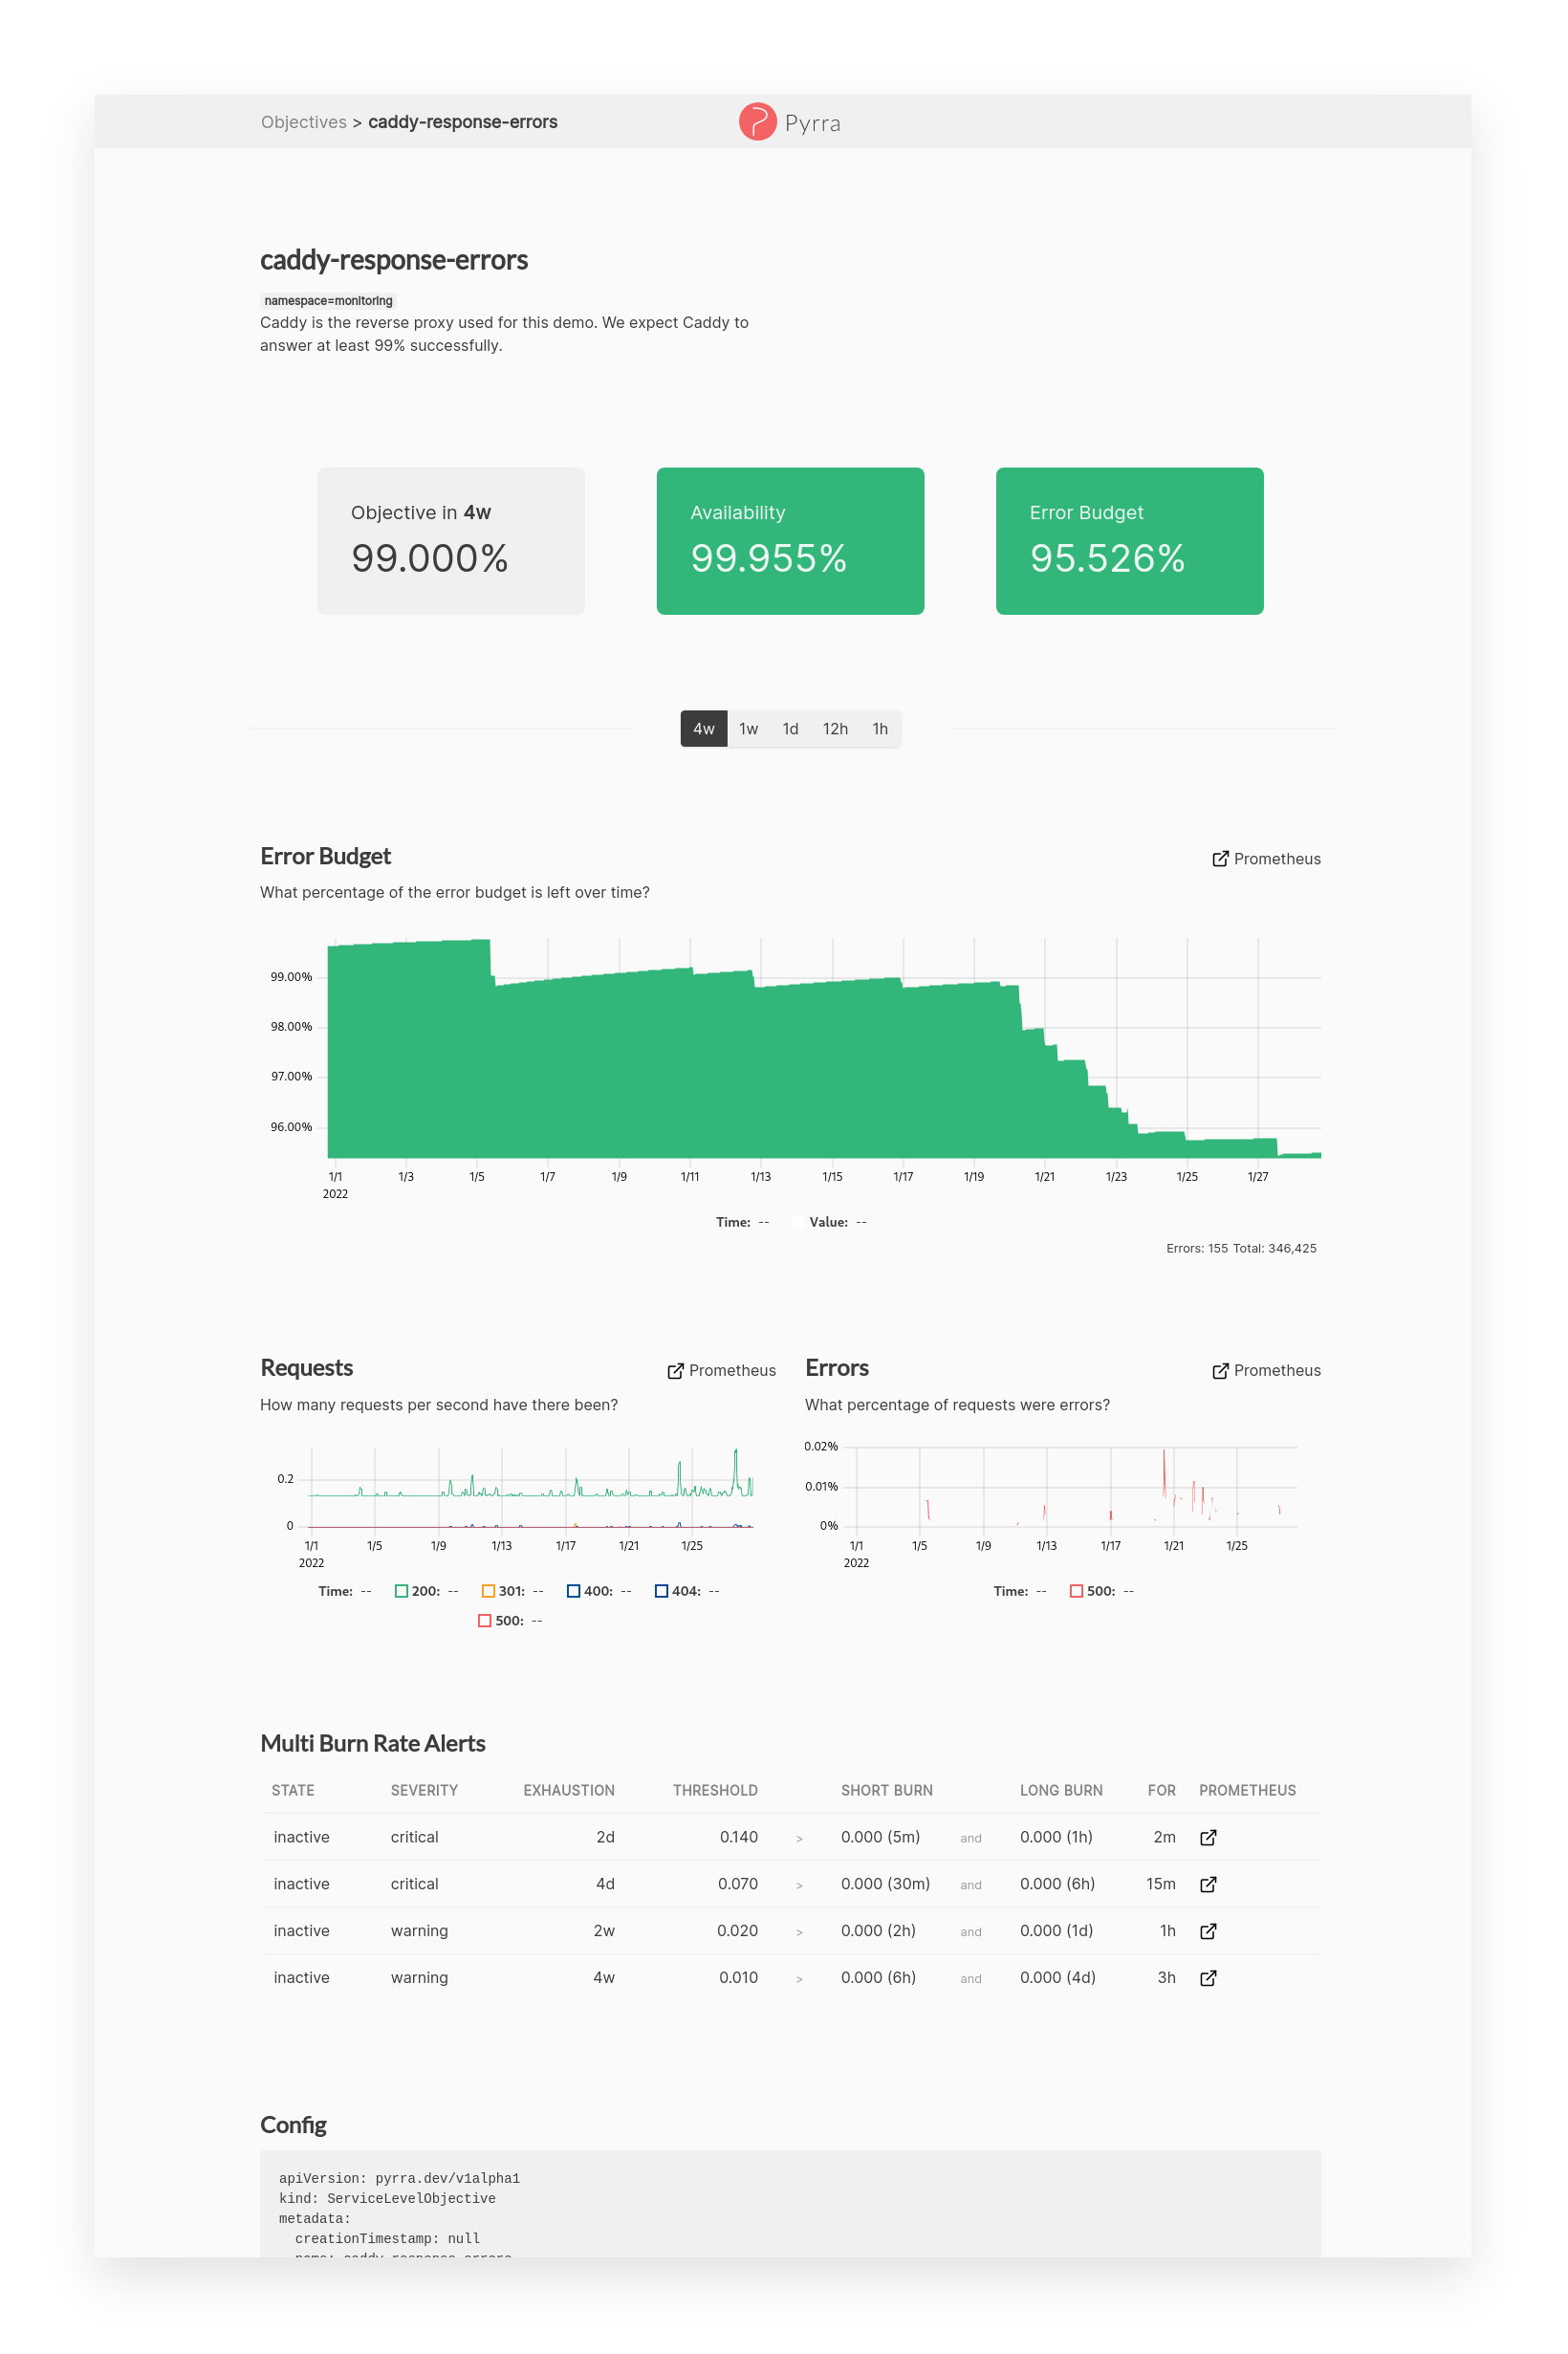
Dashboards to visualize SLOs in Grafana:
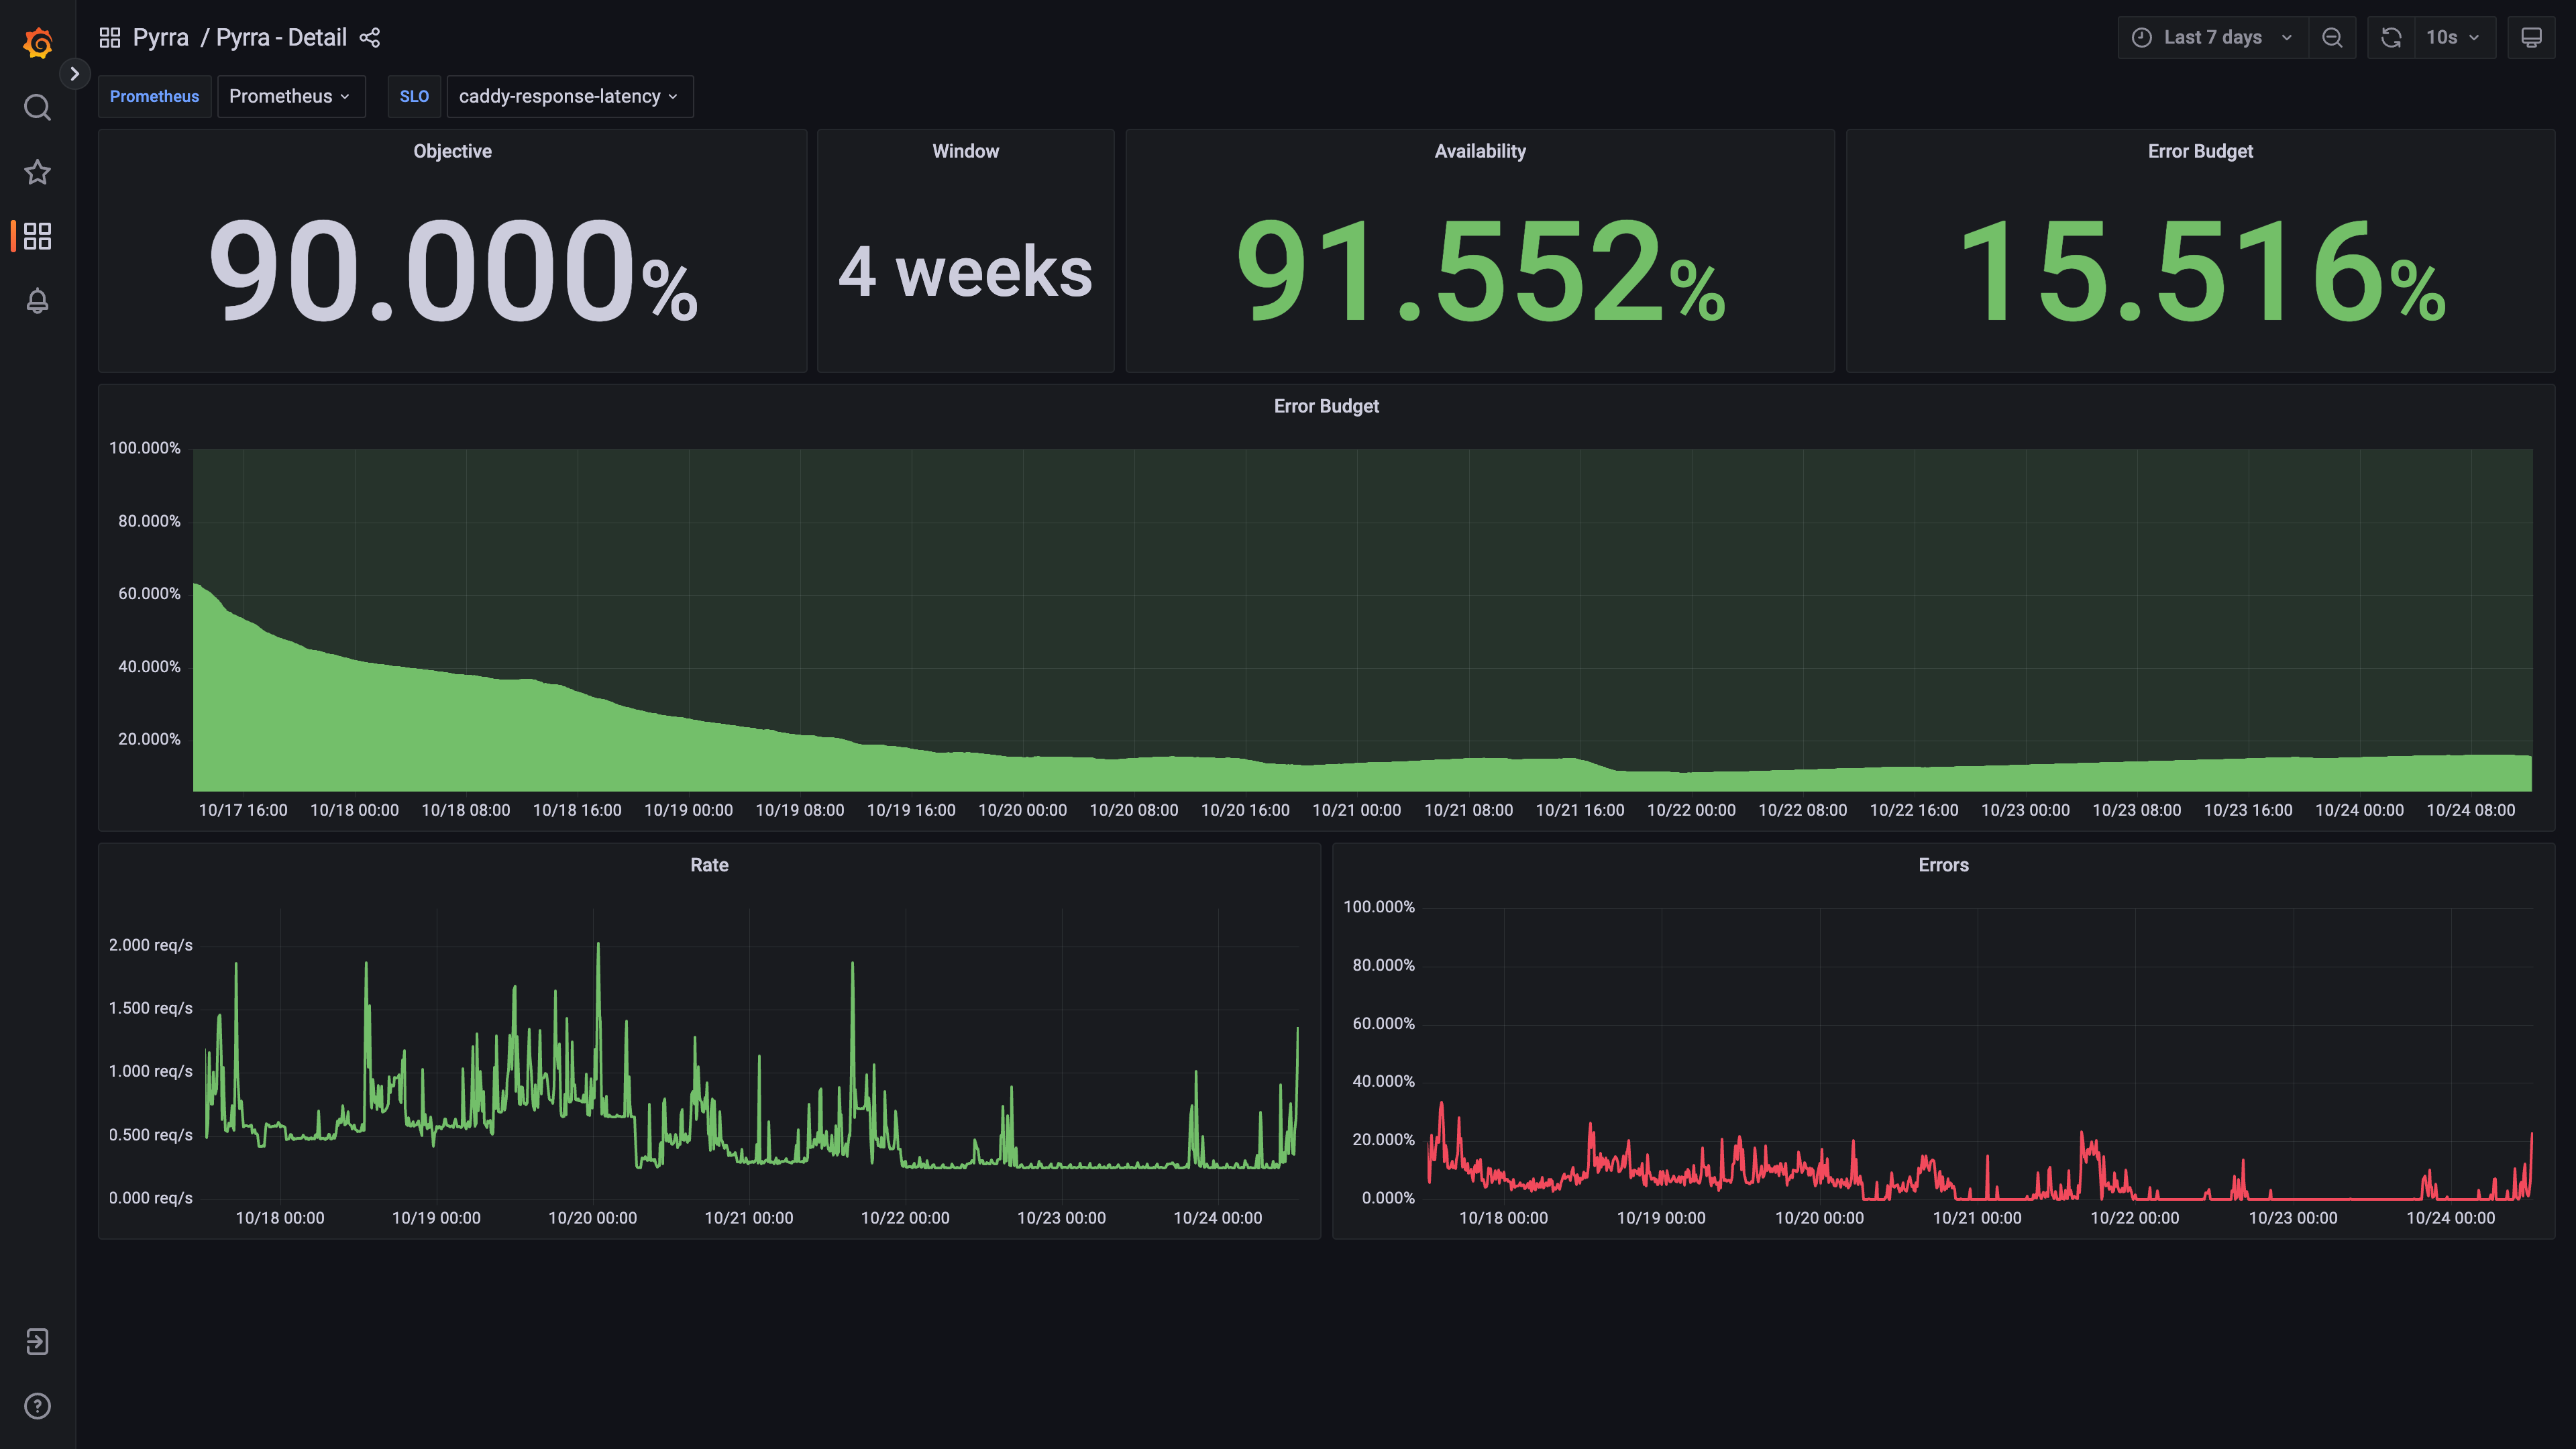
Watch the 5min lightning talk at Prometheus Day 2022:

Features
- Support for Kubernetes, Docker, and reading from the filesystem
- Alerting: Generates 4 Multi Burn Rate Alerts with different severity
- Page listing all Service Level Objectives
- Search through names and labels
- Sorted by remaining error budget to see the worst ones quickly
- All columns sortable
- View and hide individual columns
- Clicking on labels to filter SLOs that contain the label
- Tool-tips when hovering for extra context
- Page with details for a Service Level Objective
- Objective, Availability, Error Budget highlighted as 3 most important numbers
- Graph to see how the error budget develops over time
- Time range picker to change graphs
- Switch between absolute and relative chart scales
- Request, Errors, Duration (RED) graphs for the underlying service
- Multi Burn Rate Alerts overview table
- Caching of Prometheus query results
- Thanos: Disabling of partial responses and downsampling to 5m and 1h
- connect-go and connect-web generate protobuf APIs
- Grafana dashboard via
--generic-rulesgeneration
Feedback & Support
If you have any feedback, please open a discussion in the GitHub Discussions of this project.
We would love to learn what you think!
Demo
Check out our live demo on demo.pyrra.dev!
Grafana dashboards are available as demo on demo.pyrra.dev/grafana!
Feel free to give it a try there!
How It Works
There are three components of Pyrra, all of which work through a single binary:
- The UI displays SLOs, error budgets, burn rates, etc.
- The API delivers information about SLOs from a backend (like Kubernetes) to the UI.
- A backend watches for new SLO objects and then creates Prometheus recording rules for each.
- For Kubernetes, there is a Kubernetes Operator available
- For everything else, there is a filesystem-based Operator available
For the backend/operator to do its work, an SLO object has to be provided in YAML-format:
apiVersion: pyrra.dev/v1alpha1
kind: ServiceLevelObjective
metadata:
  name: pyrra-api-errors
  namespace: monitoring
  labels:
    prometheus: k8s
    role: alert-rules
    pyrra.dev/team: operations # Any labels prefixed with 'pyrra.dev/' will be propagated as Prometheus labels, while stripping the prefix.
spec:
  target: "99"
  window: 2w
  description: Pyrra's API requests and response errors over time grouped by route.
  indicator:
    ratio:
      errors:
        metric: http_requests_total{job="pyrra",code=~"5.."}
      total:
        metric: http_requests_total{job="pyrra"}
      grouping:
        - route
Depending on your mode of operation, this information is provided through an object in Kubernetes, or read from a static file.
In order to calculate error budget burn rates, Pyrra will then proceed to create Prometheus recording rules for each SLO.
The following rules would be created for the above example:
http_requests:increase2w

http_requests:burnrate3m
http_requests:burnrate15m
http_requests:burnrate30m
http_requests:burnrate1h
http_requests:burnrate3h
http_requests:burnrate12h
http_requests:burnrate2d
The recording rules names are based on the originally provided metric. The recording rules contain the necessary labels to uniquely identify the recording rules in case there are multiple ones available.
Running inside a Kubernetes cluster
An example for this mode of operation can be found in examples/kubernetes.
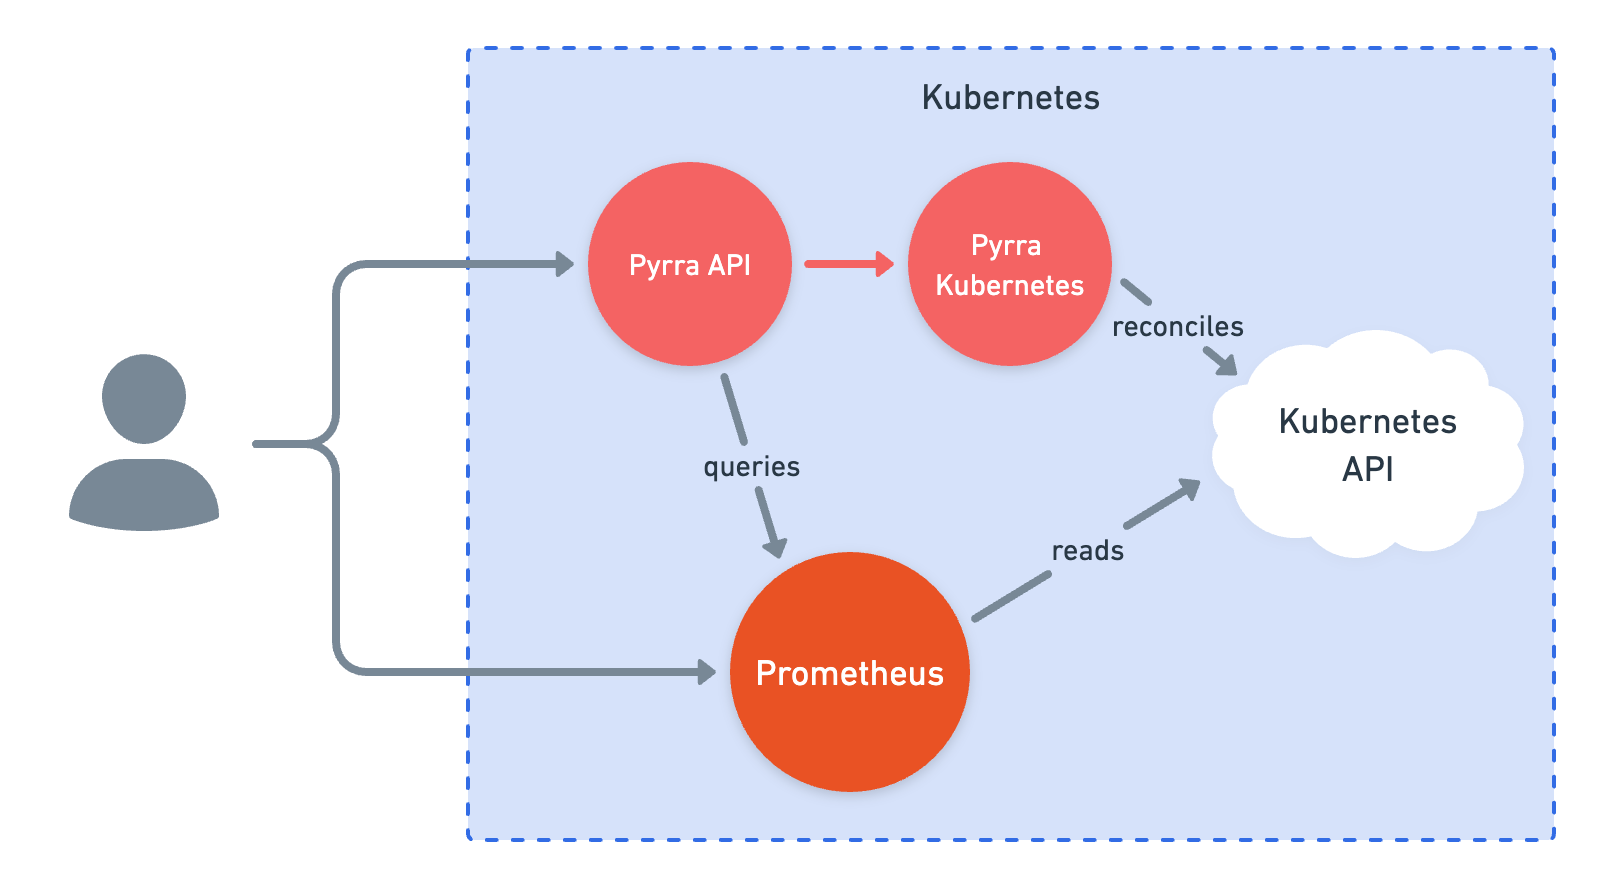
Here two deployments are needed: one for the API / UI and one for the
operator. For the first deployment, start the binary with the api argument.
When starting the binary with the kubernetes argument, the service will watch
the apiserver for ServiceLevelObjectives. Once a new SLO is picked up,
Pyrra will create PrometheusRule
objects that are automatically picked up by the Prometheus Operator.
If you're unable to run the Prometheus Operator inside your cluster, you can add
the --config-map-mode=true flag after the kubernetes argument. This will
save each recording rule in a separate ConfigMap.
Applying YAML
This repository contains generated YAML files in the examples/kubernetes/manifests folder. You can use the following commands to deploy them to a cluster right away.
kubectl apply --server-side -f ./example/kubernetes/manifests/setup
kubectl apply --server-side -f ./example/kubernetes/manifests
kubectl apply --server-side -f ./example/kubernetes/manifests/slos
Applying YAML and validating webhooks via cert-manager
This repository contains more generated YAML files in the examples/kubernetes/manifests-webhook folder.
This example deployment additionally applies and self-sign Issuer and requests a certificate via cert-manager, so that the Kubernetes APIServer can connect to Pyrra to validate any configuration object before applying it to the cluster.
kubectl apply --server-side -f ./example/kubernetes/manifests-webhook/setup
kubectl apply --server-side -f ./example/kubernetes/manifests-webhook
kubectl apply --server-side -f ./example/kubernetes/manifests-webhook/slos
kube-prometheus
The underlying jsonnet code is imported by the kube-prometheus project. If you want to install an entire monitoring stack including Pyrra we highly recommend using kube-prometheus.
Install with Helm
Pyrra can be deployed via the official Helm chart. For development, please visit: https://github.com/pyrra-dev/helm-charts
Running inside Docker / Filesystem
An example for this mode of operation can be found in examples/docker-compose.
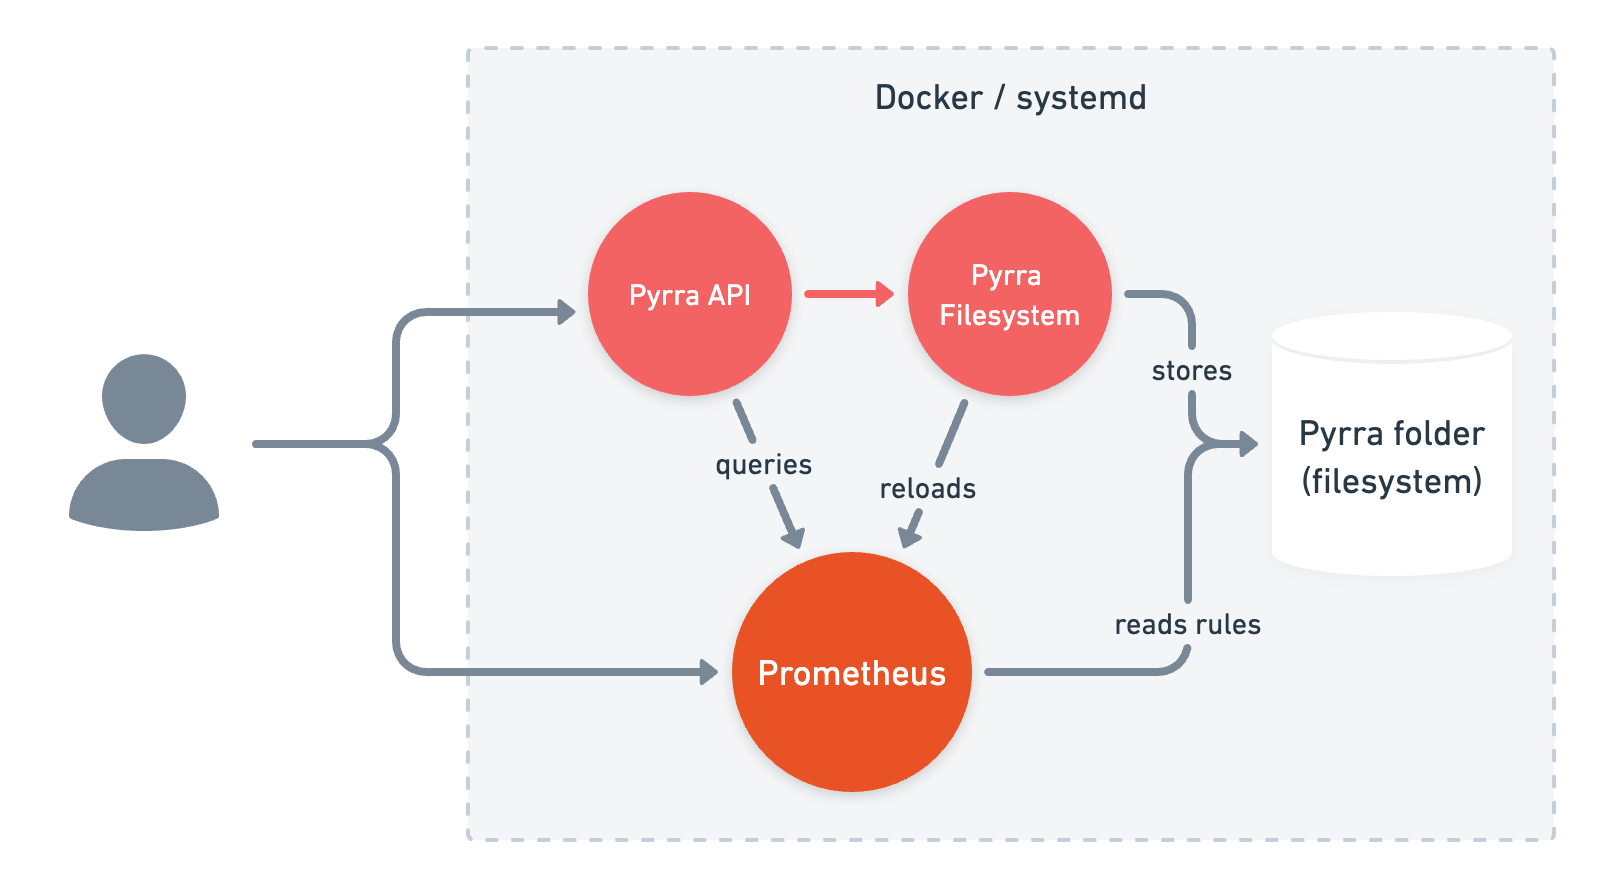
You can easily start Pyrra on its own via the provided Docker image:
docker pull ghcr.io/pyrra-dev/pyrra:v0.7.0
When running Pyrra outside of Kubernetes, the SLO object can be provided through
a YAML file read from the file system. For this, one container or binary needs to
be started with the api argument and the reconciler with the filesystem
argument.
Here, Pyrra will save the generated recording rules to disk where they can be picked up by a Prometheus instance. While running Pyrra on its own works, there won't be any SLO configured, nor will there be any data from a Prometheus to work with. It's designed to work alongside a Prometheus.
Configuration Options
API Command Flags
When running pyrra api, you can configure various options:
Prometheus Configuration
--prometheus-url- The URL to the Prometheus to query (default:http://localhost:9090)--prometheus-external-url- The URL for the UI to redirect users to when opening Prometheus--prometheus-basic-auth-username- The HTTP basic authentication username--prometheus-basic-auth-password- The HTTP basic authentication password--prometheus-bearer-token-path- Bearer token file path (useful for service account tokens)--tls-client-ca-file- File containing the CA certificate for the client (for custom or self-signed certificates)--mimir-tenant-ids- Mimir tenant IDs to query if multi-tenancy is enabled
Grafana Integration
As an alternative to redirecting to Prometheus, Pyrra can redirect to Grafana Explore for a richer query experience:
--grafana-external-url- The URL for the UI to redirect users to Grafana Explore page--grafana-external-org-id- The Grafana Explore organization id (default:1)--grafana-external-datasource-id- The Grafana Explore prometheus datasource id (required when u