

perspective is a free, open source marketing & customer engagement project written in Rust and released under Apache-2.0. It has 11,222 GitHub stars, 1,337 forks and 39 open issues, and was last pushed yesterday. On this registry it ranks #12 of 50 tracked projects in Marketing & Customer Engagement, with 5 head-to-head comparisons available. It gained 14 stars over the last 3 tracked days.

What is perspective?

Perspective is an interactive analytics and data visualization component for large, real-time and streaming datasets, built for developers and data teams who create user-configurable reports, dashboards and notebook applications on top of a high-performance streaming query engine.

What it is

Perspective is a data visualization and analytics component that ships as a data-reactive UI alongside a streaming query engine written in C++ and compiled for WebAssembly, Python and Rust. It lives in the JavaScript, Python, Rust and WebAssembly ecosystems, and it presents itself as a Custom Element (a Web Component) with drag-and-drop query and layout configuration, so it can be embedded directly into web applications, notebook environments and backend services. The same Client API reaches an engine in-process, in a Web Worker, or remotely over WebSocket, which means a single integration model covers browser and server deployments alike.

The concrete problem it solves is keeping large and continuously updating datasets interactive without copying data into the application first. Tables update incrementally and views tick in real time, with reactive joins across tables and read, write and streaming support for Apache Arrow, CSV and JSON. Where a team already runs an external engine, Perspective's virtual servers translate view configurations into native queries against DuckDB, ClickHouse, PostgreSQL and Polars, removing the ETL step and the data copy that would otherwise be required to feed a dashboard.

Key capabilities

  • A data-reactive UI packaged as a Custom Element, with drag-and-drop query and layout configuration.
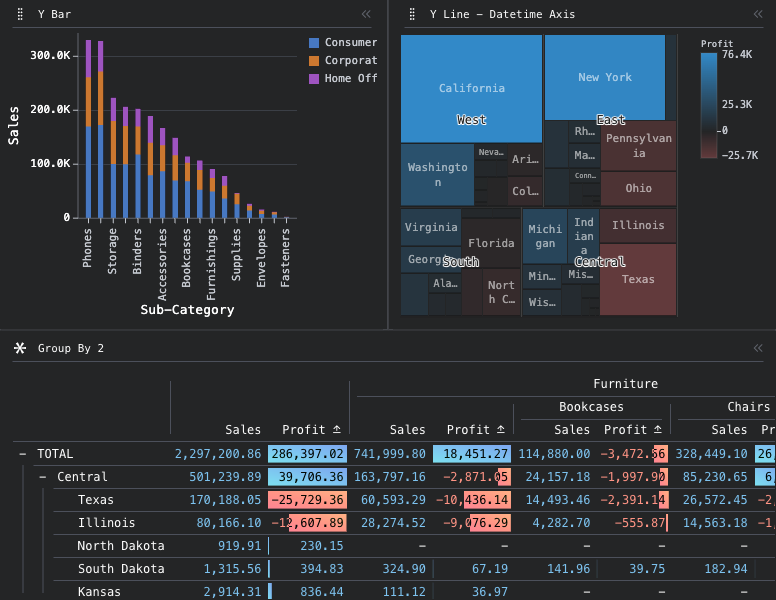
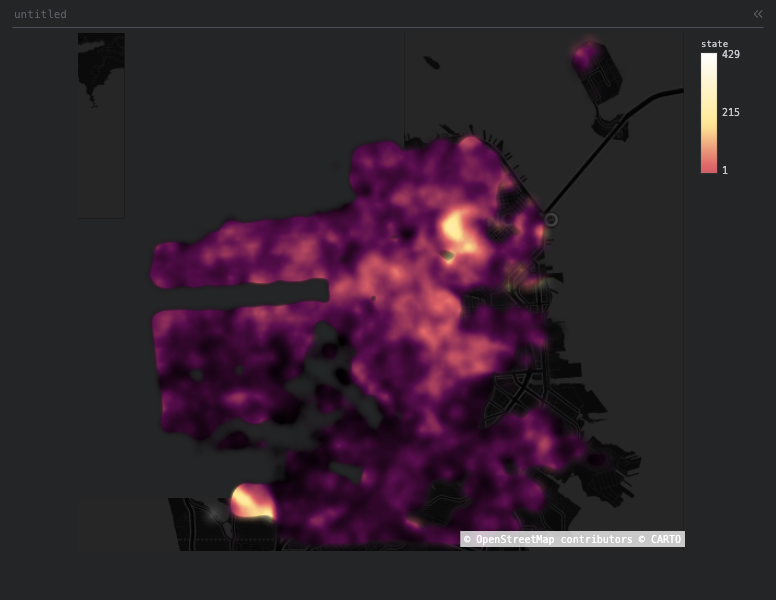
  • A virtual-scrolling, editable data grid, a WebGL charting engine with 15+ chart types, tile-based geographic maps, full theme support and React bindings.
  • A streaming query engine compiled for WebAssembly, including a 64-bit memory64 build for in-browser datasets larger than 4GB, plus Python and Rust targets.
  • Incremental table updates, live-ticking views, reactive joins across tables and a columnar expression language based on ExprTK.
  • Read, write and streaming support for Apache Arrow, CSV and JSON.
  • A symmetric client/server architecture with server bindings for Python (aiohttp, Starlette, Tornado), Node.js and Rust.
  • Virtual servers for DuckDB, ClickHouse, PostgreSQL and Polars that translate view configurations into native queries with no ETL or data copy.
  • A Jupyter widget built on anywidget and a Python client library for interactive analysis in JupyterLab and other notebook environments.

Who uses it and how

  • Application teams building user-configurable reports and dashboards that must stay responsive as data streams in.
  • Data analysts working interactively inside JupyterLab and other notebook environments through the anywidget-based widget and Python client.
  • Organizations that already run DuckDB, ClickHouse, PostgreSQL or Polars and want to query those engines directly rather than replicating data.
  • Browser-facing deployments handling datasets larger than 4GB, which can use the 64-bit memory64 WebAssembly build.
  • Server-side deployments that virtualize datasets and stream only what is visible, backed by aiohttp, Starlette, Tornado, Node.js or Rust bindings.

Getting started

Install the package for the target environment — @perspective-dev/client from npm, perspective-python from PyPI, or perspective from crates.io — and follow the User Guide on the project site for the API of each binding.

How it compares

No direct competitors are named in the facts. Among the tools that are named, DuckDB, ClickHouse, PostgreSQL and Polars appear as engines that Perspective integrates with through virtual servers rather than as alternatives, so Perspective stands alone in this registry as a visualization and streaming query component in this category.

When to use it — and when not to

Perspective suits teams that can embed a component and, for server-side deployments, operate a Python, Node.js or Rust service using the provided bindings. Teams looking for a turnkey hosted analytics product, or unwilling to integrate a UI component into their own application, should look elsewhere. One practical constraint worth noting: in-browser datasets beyond 4GB require the 64-bit memory64 build, and any server-side path means running and maintaining the query service yourself.

project readme (upstream, from github) — read inline


Build Status npm PyPI crates.io

Perspective is an interactive analytics and data visualization component for large, real-time and streaming datasets. Build user-configurable reports, dashboards, notebooks and applications, backed by a high-performance streaming query engine that runs in-browser via WebAssembly or server-side in Python, Node.js and Rust — or delegates to a database you already have.

Features

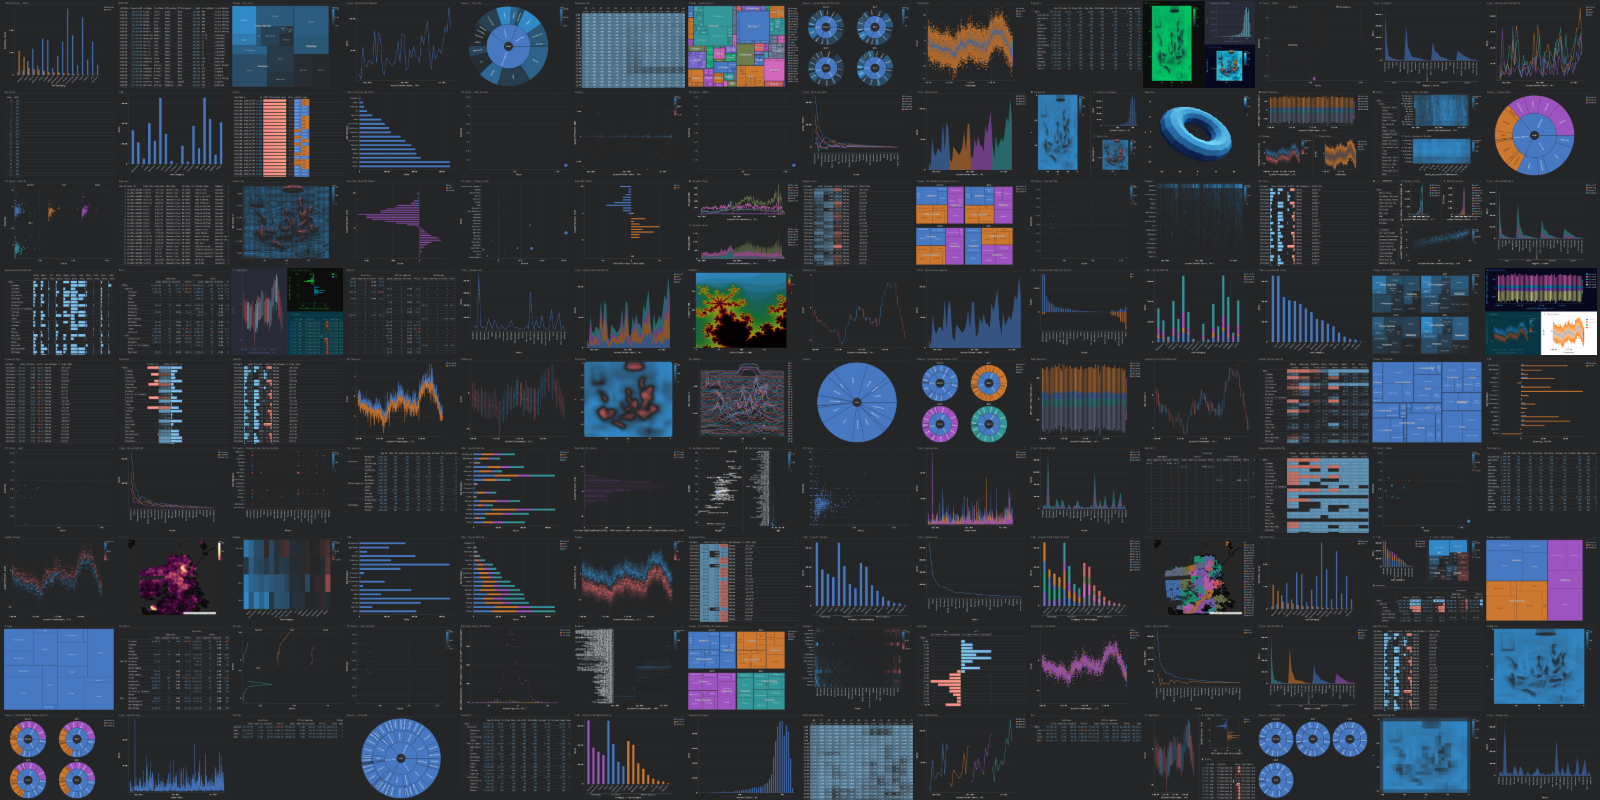
  • A data-reactive UI packaged as a Custom Element, with drag-and-drop query and layout configuration. Includes a virtual-scrolling, editable data grid, WebGL charting engine with 15+ chart types, tile-based geographic maps, full theme support, and React bindings.

  • A fast, memory-efficient streaming query engine written in C++ and compiled for WebAssembly (including a 64-bit memory64 build for in-browser datasets larger than 4GB), Python and Rust. Tables update incrementally and views tick in real time, with reactive joins across tables, a columnar expression language based on ExprTK, and read/write/streaming support for Apache Arrow, CSV and JSON.

  • A symmetric client/server architecture — the same Client API connects to an engine in-process, in a Web Worker, or remotely over WebSocket, with server bindings for Python (aiohttp, Starlette, Tornado), Node.js and Rust. Datasets can be mirrored to the browser for fluid interaction or virtualized server-side, streaming only what's visible.

  • Virtual servers that run Perspective's UI directly on external engines like DuckDB, ClickHouse, PostgreSQL and Polars, translating view configurations into native queries — no ETL or data copy required.

  • A Jupyter widget built on anywidget and a Python client library for interactive data analysis in JupyterLab and other notebook environments.

Documentation

Examples

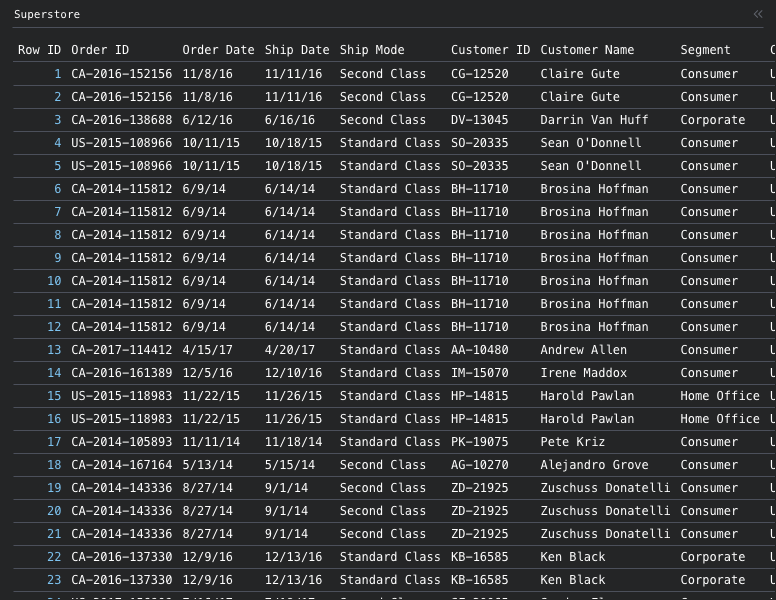
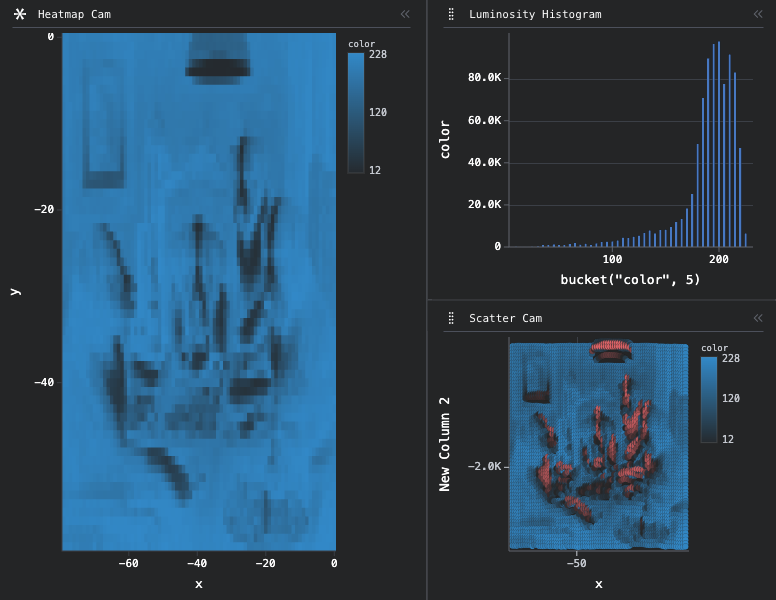
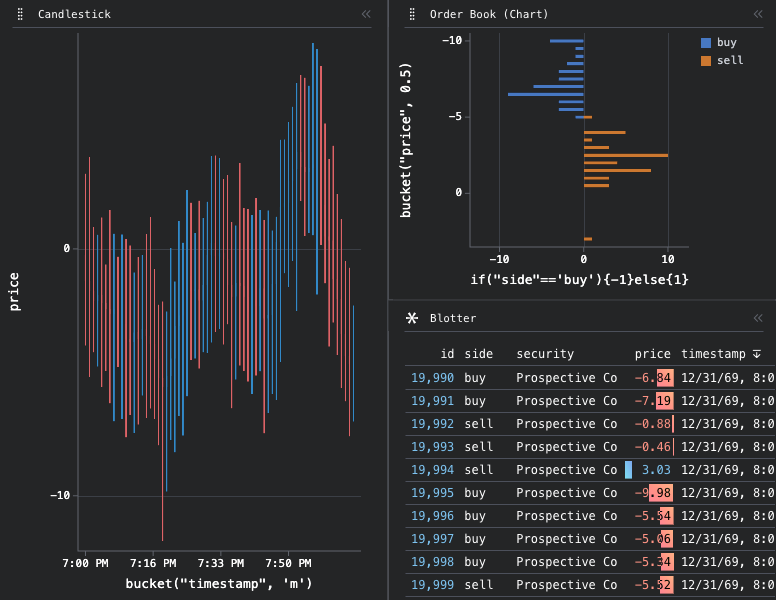
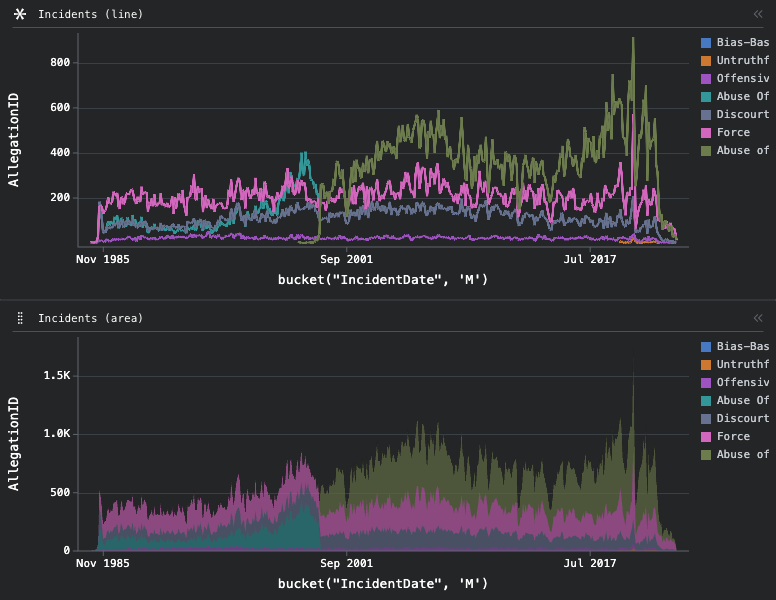
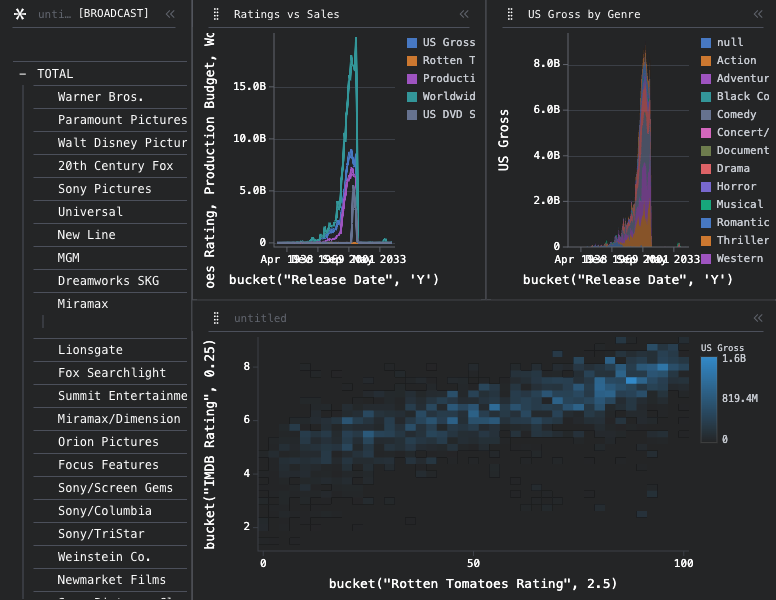
SuperstoreWorkspaceWebcam
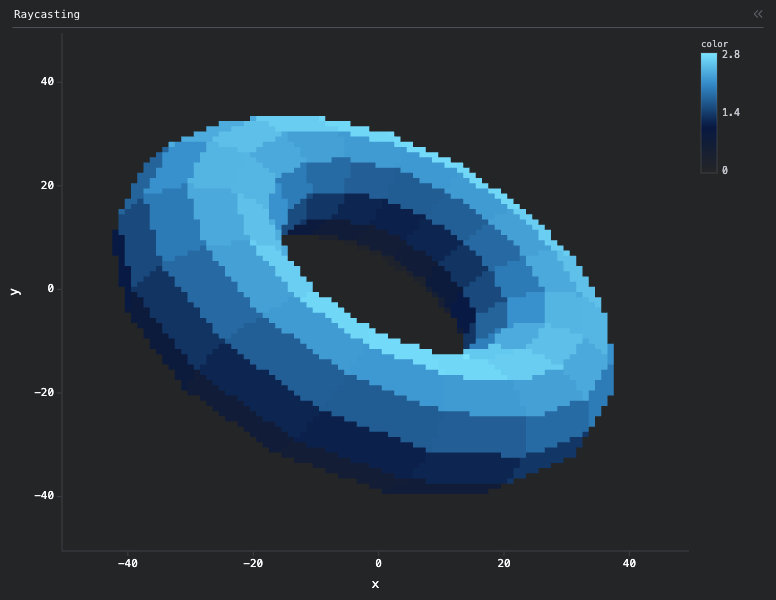
RaycastingMarketNYPD
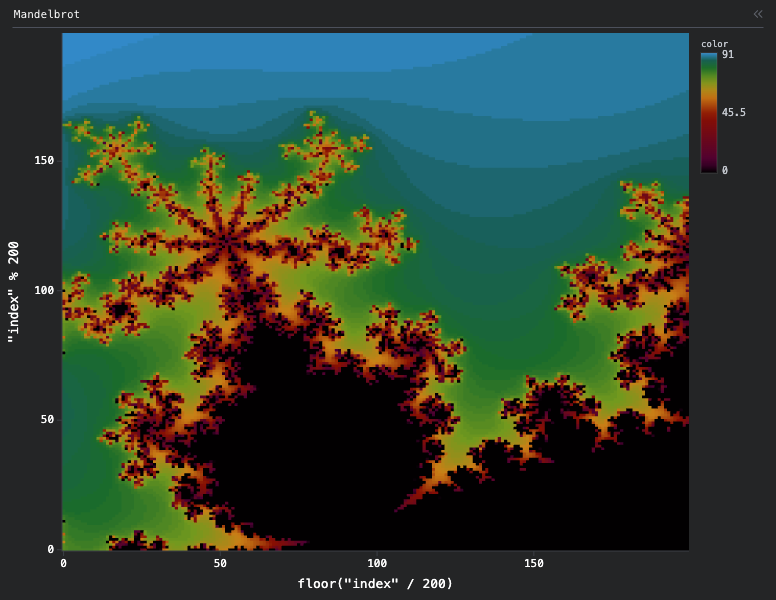
MoviesEvictionsFractal

Media

@timkpaine @timbess @sc1f
readme truncated — read the full docs on github

Frequently asked questions

Is perspective free to use?

perspective is open source under the Apache-2.0 licence. There is no licence fee and no seat count — you can self-host it or, where the project offers one, pay a vendor for a managed version instead.

What does perspective do?

A data visualization and analytics component, especially well-suited for large and/or streaming datasets.

What is perspective written in?

perspective is primarily written in Rust. Its source is publicly available at https://github.com/perspective-dev/perspective, and it has 11,222 GitHub stars.