
perses is a free, open source monitoring & observability project written in Go and released under Apache-2.0. It has 2,514 GitHub stars, 266 forks and 277 open issues, and was last pushed 5 hours ago. On this registry it ranks #154 of 270 tracked projects in Monitoring & Observability, with 5 head-to-head comparisons available. It gained 53 stars over the last 30 tracked days.

What is perses?

Perses is an Apache-2.0 dashboard and observability visualisation tool, a Cloud Native Computing Foundation sandbox project written in Go, for platform, SRE and observability teams that want Prometheus metrics, Tempo traces, Loki logs and Pyroscope profiles displayed in one place.

What it is

Perses is first and foremost a dashboard tool used to display a variety of observability data. It currently supports Prometheus for metrics, Tempo for traces, Loki for logs and Pyroscope for profiling, bringing all four observability pillars together in a single application. The project is a CNCF sandbox project and is maintained under the perses organisation, with core plugins living in the separate perses/plugins repository, while dashboard definitions can also be deployed into and read from individual application namespaces as Custom Resource Definitions through the Perses Operator.

The concrete problem it solves is the lack of a shared, standardized definition of a dashboard. Perses is also an initiative to define a standardized dashboard specification, which is intended to foster interoperability across observability tools rather than binding dashboard definitions to one vendor or one rendering engine. Alongside that specification work, it replaces the hand-maintained, UI-only dashboard workflow with a Dashboard-as-Code approach: SDKs, CI/CD libraries, static validation and a native CLI, so dashboards can be reviewed, validated and promoted like any other artifact. The project also provides npm packages that let developers embed Perses panels and dashboards into their own user interfaces, with the Prometheus UI named as one example of where that could apply.

Key capabilities

  • Displays four observability pillars in one tool: Prometheus metrics, Tempo traces, Loki logs and Pyroscope profiling.
  • Defines an open specification for dashboards, aimed at interoperability across observability tools.
  • Ships a plugin architecture that externalizes both plugin loading and plugin implementation, with core plugins maintained in perses/plugins.
  • Provides two SDKs for coding dashboards, in Golang and Cuelang, documented through the Dashboard-as-Code getting-started guide in docs/dac/getting-started.md.
  • Includes a native CLI for interacting with the API, documented in docs/cli.md.
  • Delivers npm packages that allow panels and dashboards to be embedded into third-party UIs.
  • Supports Kubernetes-native mode through Custom Resource Definitions, with the Perses Operator handling deployment and reading of dashboard definitions in application namespaces.

Who uses it and how

  • Platform and SRE teams that run Prometheus, Tempo, Loki and Pyroscope together and want a single dashboard surface across all four signal types.
  • Teams practising GitOps, who keep dashboards in source control, validate them statically and drive them through CI/CD with the CLI and the Golang or Cuelang SDKs.
  • Kubernetes operators who deploy dashboard definitions as CRDs into individual application namespaces and read them back per namespace with the Perses Operator.
  • Developers embedding observability panels inside their own products by consuming the published npm packages.
  • Evaluators can try the hosted online demo at https://demo.perses.dev, inspecting existing dashboards or creating their own resources before committing to an install.

Getting started

Precompiled binaries for released versions are available from the GitHub releases, and using the latest release binary is the recommended way of installing Perses. Each release also carries SBOM artifacts documenting the full set of shipped dependencies.

How it compares

This registry lists no paid product or directly comparable dashboard tool that Perses replaces, so Perses stands alone here among dashboard projects. The only other tools named in the facts are the data sources it reads — Prometheus, Tempo, Loki and Pyroscope — which Perses queries and renders rather than competes with. Its distinguishing position in these facts is the open dashboard specification and the Dashboard-as-Code toolchain built around it.

When to use it — and when not to

A self-hoster has to run the Perses application itself and manage plugin loading and implementation, since the plugin architecture externalizes both; the facts do not specify a database, object storage or SMTP dependency, so those requirements should be confirmed before planning a deployment. Teams that want a fully managed, zero-operations dashboard service, or that need data sources beyond the four currently supported, should wait, because coverage today is Prometheus, Tempo, Loki and Pyroscope only. The install documentation here covers precompiled binaries from GitHub releases, and the facts mention no container image or Helm chart, so container-based deployment paths are outside what this page can confirm; the project also carries 277 open issues and its SDKs are explicitly expected to evolve, though the intent is to add utility functions rather than introduce breaking changes.

project readme (upstream, from github) — read inline


Perses

build go react OpenSSF Best Practices OpenSSF Scorecard

Overview

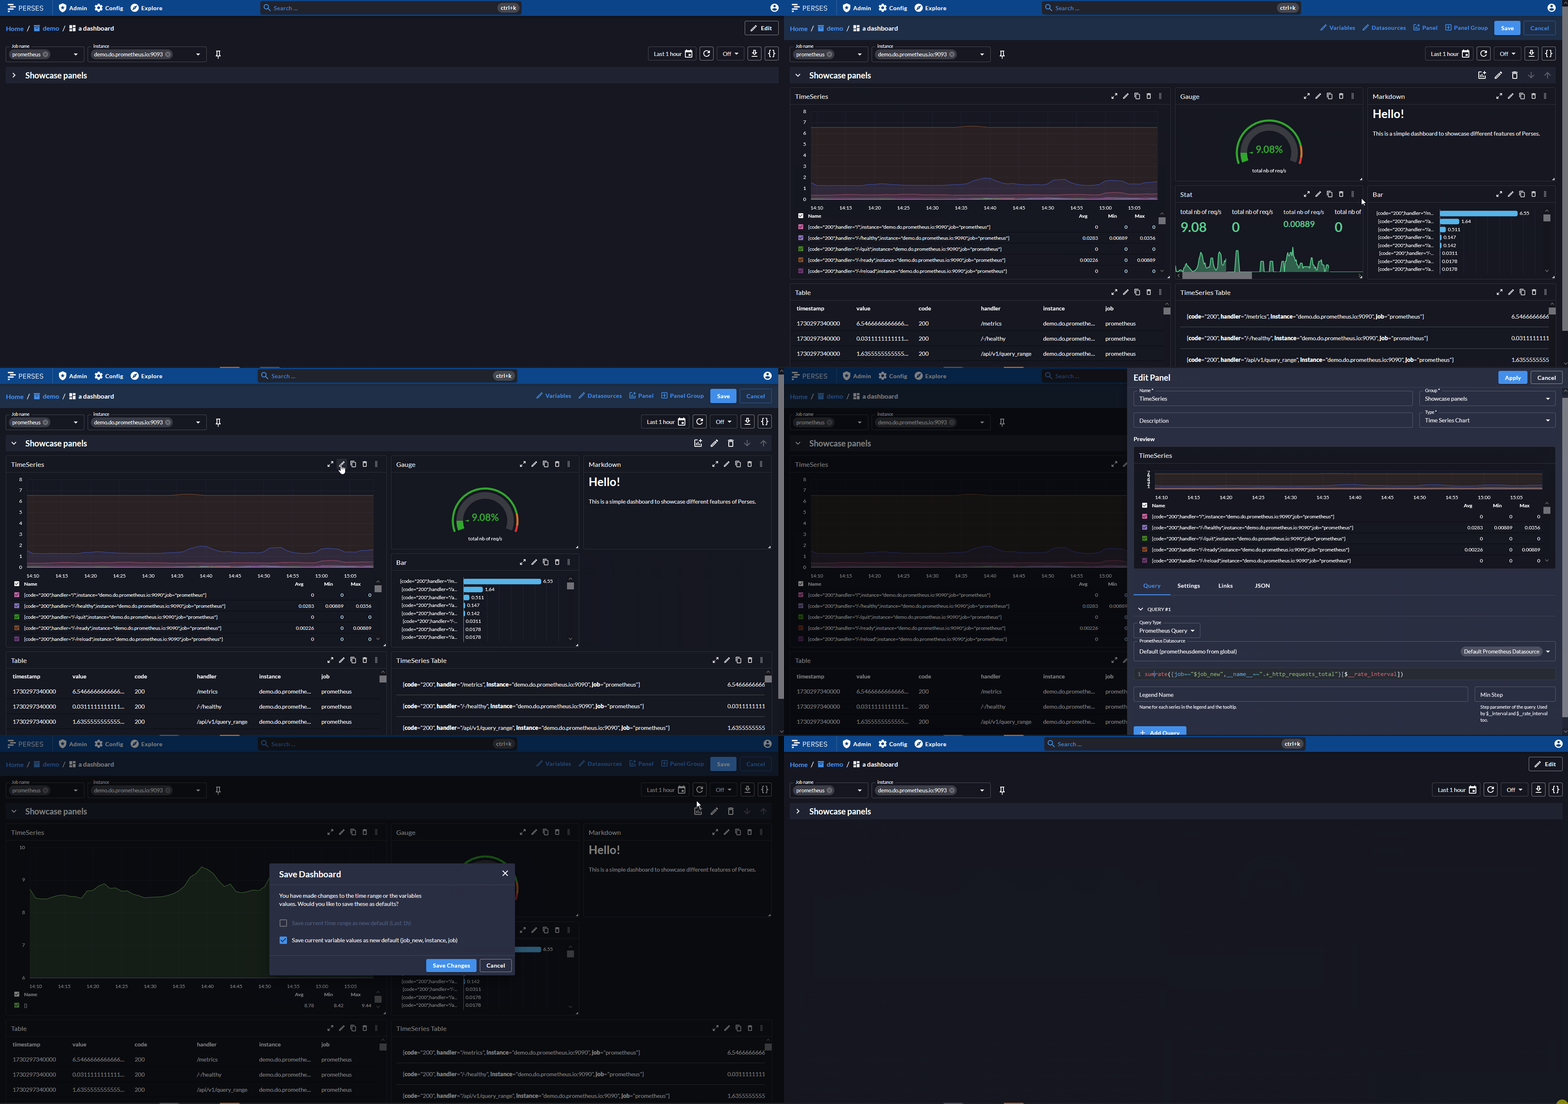
Perses is first and foremost a dashboard tool that you can use to display a variety of observability data. It currently supports Prometheus metrics, Tempo traces, Loki for logs, Pyroscope for profiling, bringing together all four observability pillars in one place. As the project continues to evolve, it will expand support for additional tools to give users even more flexibility and insight.

Perses is a Cloud Native Computing Foundation sandbox project.
img.png

Beyond its core usage, Perses aims to achieve several broader goals:

  • Open specification for dashboards. Perses is also an initiative to define a standardized dashboard specification, fostering interoperability across observability tools.
  • Integrability. Perses provides various npm packages that allow developers to embed panels and dashboards into their own UIs, benefiting from the work done in Perses. For instance, these packages could be used in the future to enhance data visualization in the Prometheus UI.
  • Extensibility. Perses supports multiple kinds of plugins, enabling users to extend the tool’s native capabilities to suit specific needs.
  • GitOps-friendly. SDKs, CI/CD libraries, static validation, native CLI.. Perses provides everything you need for a great Dashboard-as-Code experience.
  • Kubernetes-native mode. Dashboard definitions will be deployable into and readable from individual application namespaces using Custom Resource Definitions (CRDs). For more information on that topic you can take a look at the Perses Operator.

Want to learn more? Check the documentation website.

Try it

We are providing an online demo available at https://demo.perses.dev, where you can check existing dashboards or create your own resources.

Status

  1. Perses as an application can now be used.
    • The data model reached a stable point, and we are providing multiple panel types that should cover most of the monitoring & tracing use cases.
    • Authentication and authorization are available.
  2. On the GitOps aspect:
    • We provide a CLI that helps to interact with the API. A short doc is available here
    • Two SDKs (in Golang and in Cuelang) are available for coding dashboards. See Dashboard-as-Code guide. These SDKs will likely evolve based on the feedback we receive. However, changes are expected to focus on adding utility functions rather than introducing breaking changes.
  3. A plugin architecture:
    • Enables the externalization of both plugin loading and implementation.
    • The core plugins are maintained in perses/plugins repository.

What's next

Current Roadmap is available here

Install

There are various ways of installing Perses.

Precompiled binaries

Precompiled binaries for released versions are available in the GitHub release. Using the latest release binary is the recommended way of installing Perses.

Software Bill of Materials (SBOM)

Each GitHub release includes SBOM artifacts that document the full set of dependencies shipped with Perses:

Artifact Format Description
perses___.tar.gz.sbom.spdx.json SPDX JSON Dependencies for the Go release archive (per platform)
perses__source.tar.gz.sbom.spdx.json SPDX JSON Dependencies for the full source tree
ui-sbom.cdx.json CycloneDX JSON Dependencies for the React frontend (npm packages)

Docker images

Docker images are available on Docker Hub.

You can launch a Perses container for trying it out with:

docker run --name perses -d -p 127.0.0.1:8080:8080 persesdev/perses

Homebrew

We have a Homebrew tap so macOS and Linux users can install with:

brew install perses/tap/perses for the server and web UI brew install perses/tap/percli for the CLI tool

Building from source

To build Perses from source code, You need:

Start by cloning the repository:

git clone https://github.com/perses/perses.git
cd perses

Then you can use make build that would build the web assets and then Perses itself (and also the Perses CLI that can be used to interact directly with the Perses API in case you prefer to browser the API using a terminal).

make build
./bin/perses --config=your_config.yml

Contributing and development

General instructions about how you can contribute to Perses are available in the document CONTRIBUTING.md.

UI development

If you are primarily interested in contributing to the UI application and libraries, please refer to the UI Readme. It includes quick start instructions for how to build, run, and test the React UI. It also includes details about the architecture and guidelines for development.

License

The code is licensed under an Apache 2.0 license.

Frequently asked questions

Is perses free to use?

perses is open source under the Apache-2.0 licence. There is no licence fee and no seat count — you can self-host it or, where the project offers one, pay a vendor for a managed version instead.

What does perses do?

The CNCF sandbox for observability visualisation. Already supports Prometheus, Tempo, Loki and Pyroscope - more data sources to come!

What is perses written in?

perses is primarily written in Go. Its source is publicly available at https://github.com/perses/perses, and it has 2,514 GitHub stars.