Intel® Performance Counter Monitor (Intel® PCM)

PCM Tools | Building PCM | Downloading Pre-Compiled PCM | FAQ | API Documentation | Environment Variables | Compilation Options
Intel® Performance Counter Monitor (Intel® PCM) is an application programming interface (API) and a set of tools based on the API to monitor performance and energy metrics of Intel® Core™, Xeon®, Atom™ and Xeon Phi™ processors. PCM works on Linux, Windows, FreeBSD, DragonFlyBSD and ChromeOS operating systems.
Github repository statistics: 


We welcome bug reports and enhancement requests, which can be submitted via the "Issues" section on GitHub. For those interested in contributing to the code, please refer to the guidelines outlined in the CONTRIBUTING.md file.
Current Build Status
- Linux:
- Windows:
- FreeBSD:
- Docker container:


PCM Tools
PCM provides a number of command-line utilities for real-time monitoring:
- pcm : basic processor monitoring utility (instructions per cycle, core frequency (including Intel(r) Turbo Boost Technology), memory and Intel(r) Quick Path Interconnect bandwidth, local and remote memory bandwidth, cache misses, core and CPU package sleep C-state residency, core and CPU package thermal headroom, cache utilization, CPU and memory energy consumption)
pcm-sensor-server : pcm collector exposing metrics over http in JSON or Prometheus (exporter text based) format (how-to). Also available as a docker container. More info about Global PCM events is here.
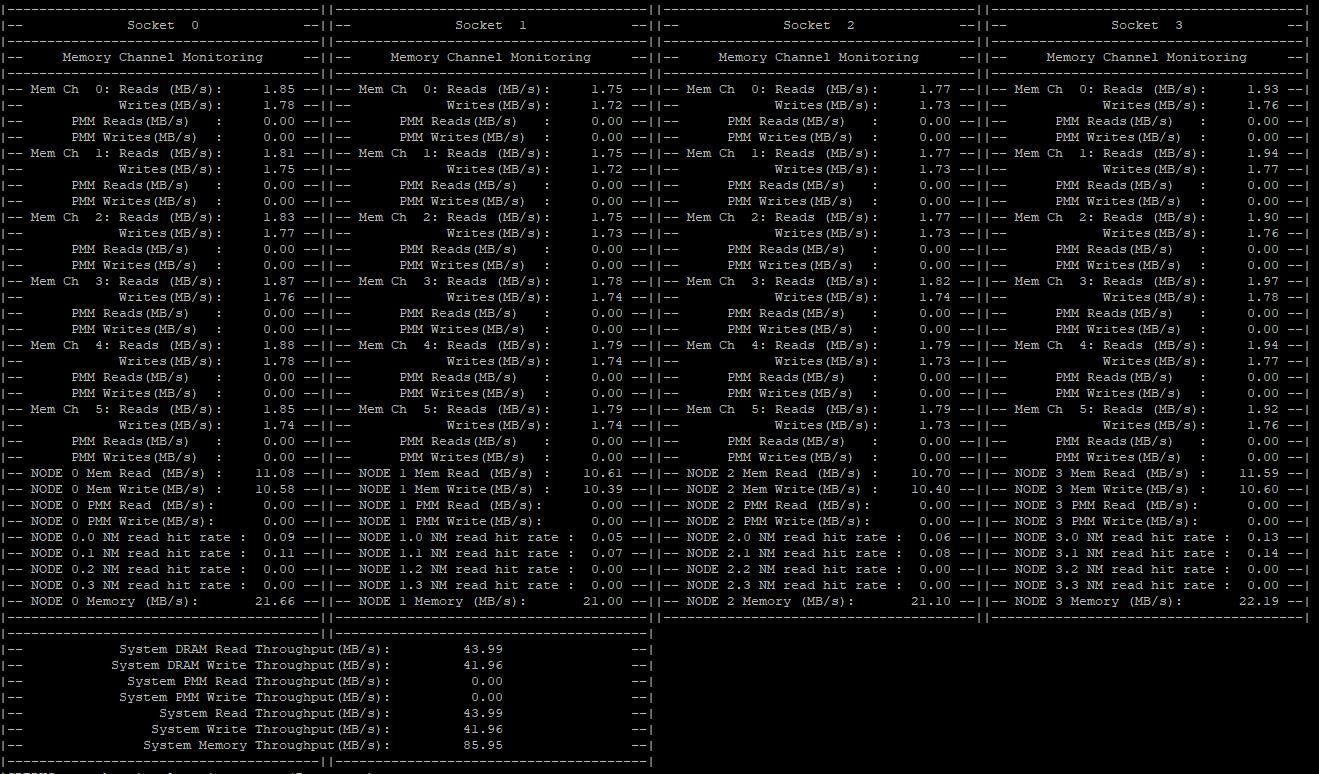
pcm-memory : monitor memory bandwidth (per-channel and per-DRAM DIMM rank)
pcm-latency : monitor L1 cache miss and DDR/PMM memory latency
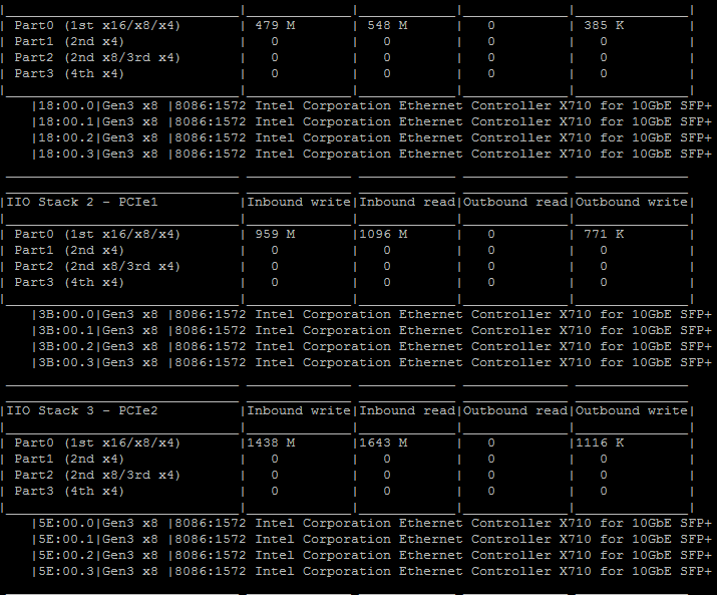
pcm-pcie : monitor PCIe bandwidth per-socket

- pcm-numa : monitor local and remote memory accesses
- pcm-power : monitor sleep and energy states of processor, Intel(r) Quick Path Interconnect, DRAM memory, reasons of CPU frequency throttling and other energy-related metrics
- pcm-tsx: monitor performance metrics for Intel(r) Transactional Synchronization Extensions
- pcm-core and pmu-query: query and monitor arbitrary processor core events
- pcm-raw: program arbitrary core and uncore events by specifying raw register event ID encoding
- pcm-bw-histogram: collect memory bandwidth utilization histogram
Graphical front ends:
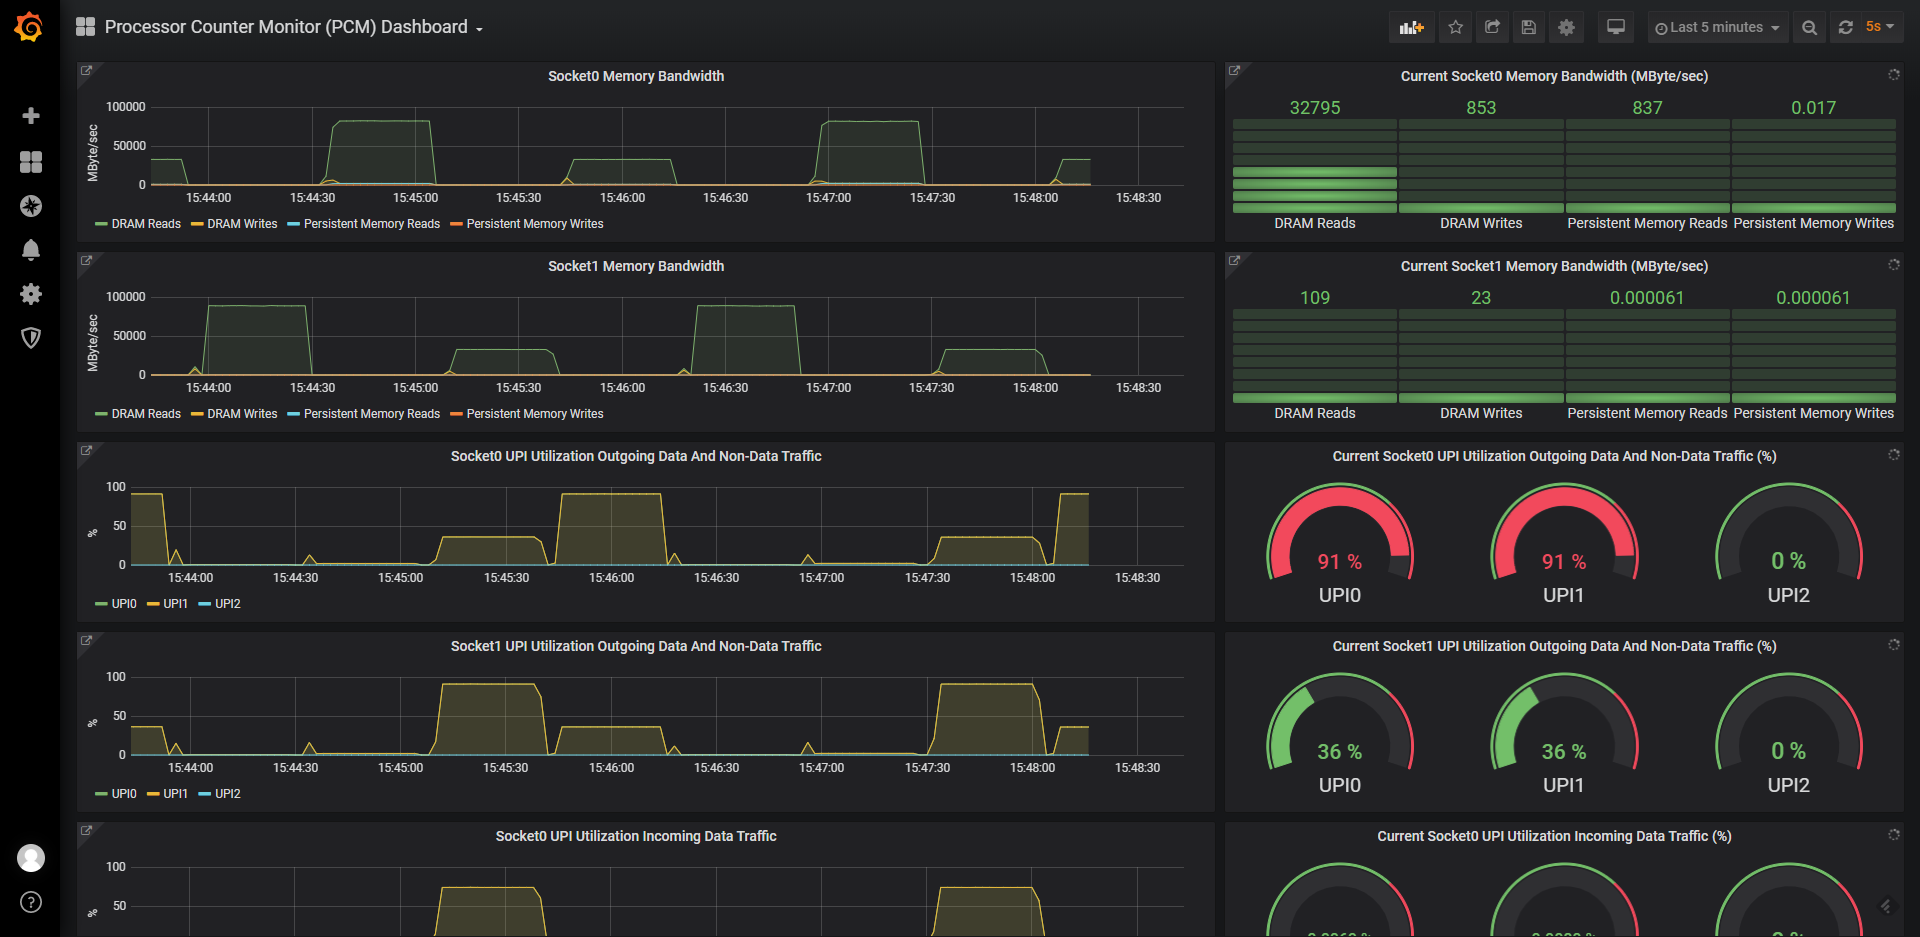
- pcm Grafana dashboard : front-end for Grafana (in scripts/grafana directory). Full Grafana Readme is here
- pcm-service : front-end for Windows perfmon
There are also utilities for reading/writing model specific registers (pcm-msr), PCI configuration registers (pcm-pcicfg), memory mapped registers (pcm-mmio) and TPMI registers (pcm-tpmi) supported on Linux, Windows, FreeBSD and DragonFlyBSD.
And finally a daemon that stores core, memory and QPI counters in shared memory that can be be accessed by non-root users.
Building PCM Tools
Clone PCM repository with submodules:
git clone --recursive https://github.com/intel/pcm
cd pcm
or clone the repository first, and then update submodules with:
git submodule update --init --recursive
Install cmake (and libasan on Linux) then compile:
Choose one of the following build methods:
- Incremental Build (Fastest): if you have a previous build to reuse the existing
builddirectory and preserve previous build artifacts, go straight to thecd buildstep. - Clean Build (From Scratch): Run
cmake -E rm -rf build && cmake -E make_directory buildfor your first build, or for a full rebuild to ensure a "clean state" by deleting all previous build data.
cd build
cmake ..
cmake --build .
You will get all the utilities (pcm, pcm-memory, etc) in build/bin directory.
'--parallel' can be used for faster building:
cmake --build . --parallel
Debug is default on Windows. Specify config to build Release:
cmake --build . --config Release
On Windows additional drivers and steps are required. Please find instructions here: WINDOWS_HOWTO.md.
FreeBSD/DragonFlyBSD-specific details can be found in FREEBSD_HOWTO.txt

Downloading Pre-Compiled PCM Tools
- Linux:
- Ubuntu/Debian:
sudo apt install pcm - openSUSE:
sudo zypper install pcm - RHEL8.5 or later:
sudo dnf install pcm - Fedora:
sudo yum install pcm - RPMs and DEBs with the latest PCM version for RHEL/SLE/Ubuntu/Debian/openSUSE/etc distributions (binary and source) are available here
- Ubuntu/Debian:
- Windows: download PCM binaries as appveyor build service artifacts and required Visual C++ Redistributable from www.microsoft.com. Additional steps and drivers are required, see WINDOWS_HOWTO.md.
- Docker: see instructions on how to use pcm-sensor-server pre-compiled container from docker hub.
Executing PCM tools under non-root user on Linux
Executing PCM tools under an unprivileged user on a Linux operating system is feasible. However, the