






Continuous profiling for analysis of CPU, memory usage over time, and down to the line number. Saving infrastructure cost, improving performance, and increasing reliability.
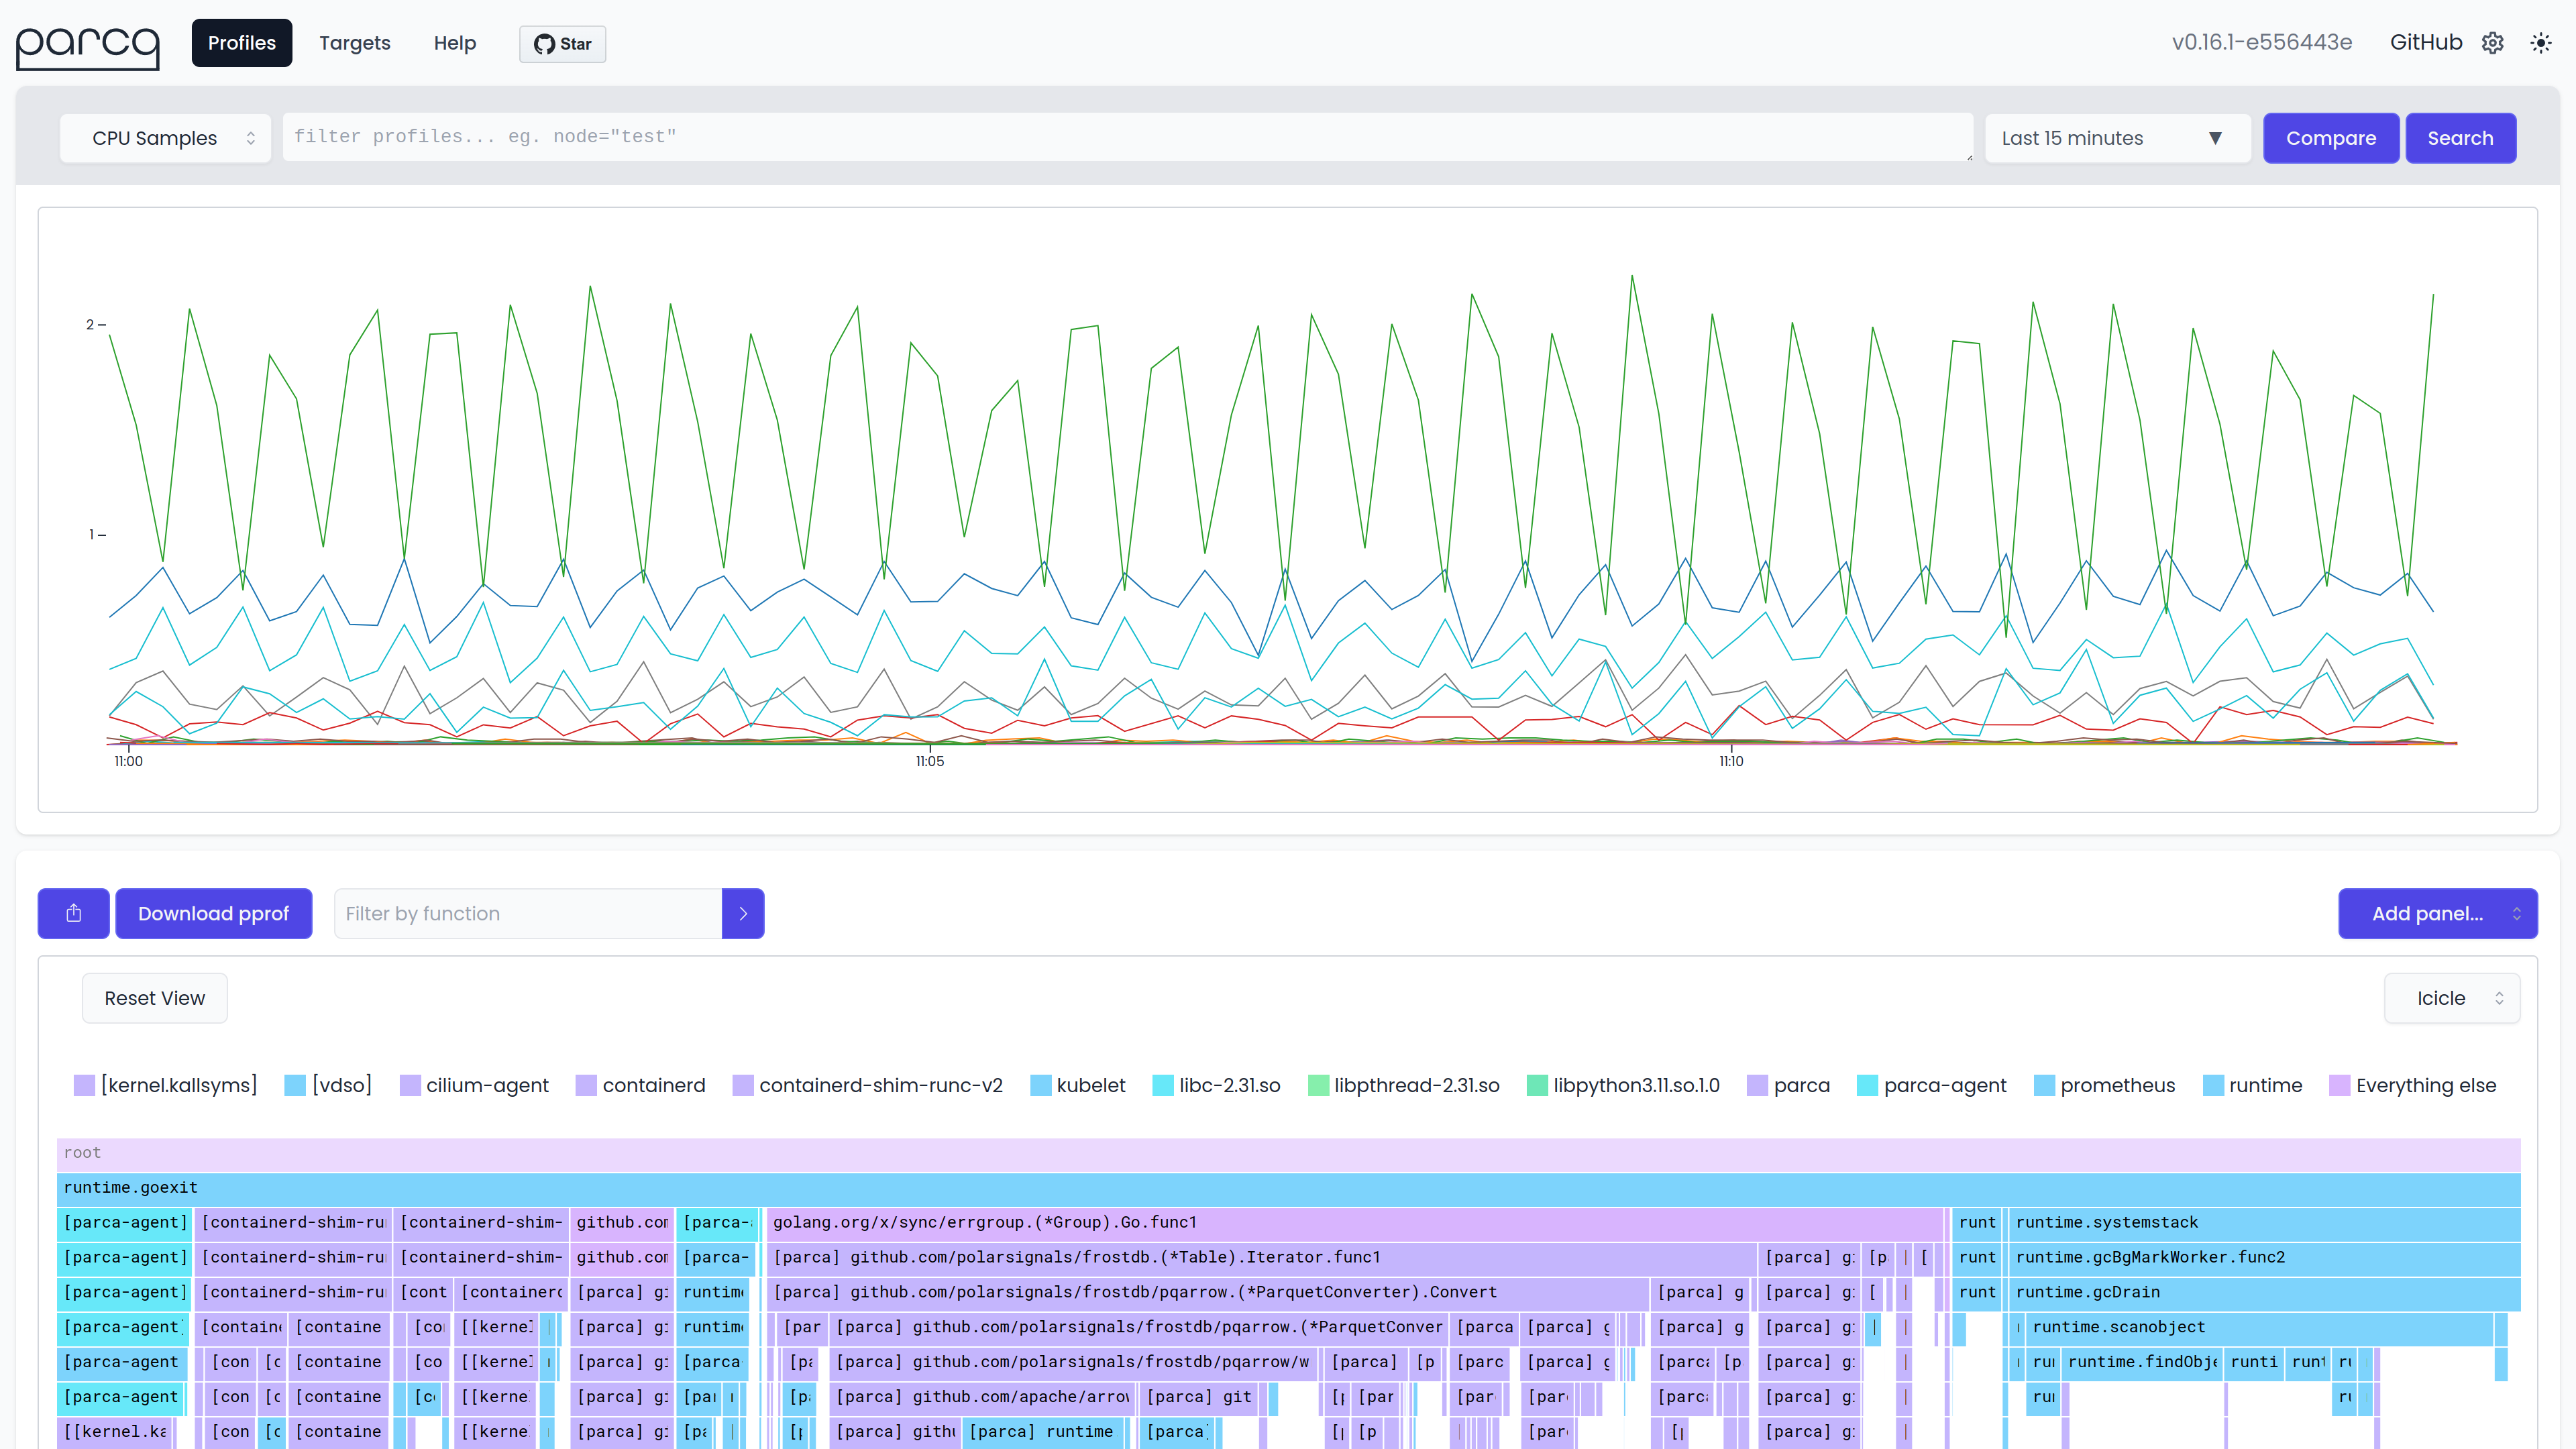
Features
eBPF Profiler: A single profiler, using eBPF, automatically discovering targets from Kubernetes or systemd across the entire infrastructure with very low overhead. Supports C, C++, Rust, Go, and more!
Open Standards: Both producing pprof formatted profiles with the eBPF based profiler, and ingesting any pprof formatted profiles allowing for wide language adoption and interoperability with existing tooling.
Optimized Storage & Querying: Efficiently storing profiling data while retaining raw data and allowing slicing and dicing of data through a label-based search. Aggregate profiling data infrastructure wide, view single profiles in time or compare on any dimension.
Why?
- Save Money: Many organizations have 20-30% of resources wasted with easily optimized code paths. The Parca Agent aims to lower the entry bar by requiring 0 instrumentation for the whole infrastructure. Deploy in your infrastructure and get started!
- Improve Performance: Using profiling data collected over time, Parca can with confidence and statistical significance determine hot paths to optimize. Additionally, it can show differences between any label dimension, such as deploys, versions, and regions.
- Understand Incidents: Profiling data provides unique insight and depth into what a process executed over time. Memory leaks, but also momentary spikes in CPU or I/O causing unexpected behavior, is traditionally difficult to troubleshoot are a breeze with continuous profiling.
Feedback & Support
If you have any feedback, please open a discussion in the GitHub Discussions of this project. We would love to learn what you think!
Installation & Documentation
Check Parca's website for updated and in-depth installation guides and documentation!
Development
You need to have Go, Node and Pnpm installed.
Clone the project
git clone https://github.com/parca-dev/parca.git
Go to the project directory
cd parca
Build the UI and compile the Go binaries
make build
Running the compiled Parca binary
The binary was compiled to bin/parca .
./bin/parca
Now Parca is running locally and its web UI is available on http://localhost:7070/.
By default, Parca is scraping it's own pprof endpoints and you should see profiles show up over time.
The scrape configuration can be changed in the parca.yaml in the root of the repository.
Configuration
Flags:
Usage: parca [flags]

Flags:
  -h, --help                     Show context-sensitive help.
      --config-path="parca.yaml"
                                 Path to config file.
      --mode="all"               Scraper only runs a scraper that sends to a
                                 remote gRPC endpoint. All runs all components.
      --http-address=":7070"     Address to bind HTTP server to.
      --http-read-timeout=5s     Timeout duration for HTTP server to read
                                 request body.
      --http-write-timeout=1m    Timeout duration for HTTP server to write
                                 response body.
      --port=""                  (DEPRECATED) Use http-address instead.
      --log-level="info"         Log level.
      --log-format="logfmt"      Configure if structured logging as JSON or as
                                 logfmt
      --otlp-address=STRING      The endpoint to send OTLP traces to.
      --otlp-exporter="grpc"     The OTLP exporter to use.
      --otlp-insecure            If true, disables TLS for OTLP exporters (both
                                 gRPC and HTTP).
      --cors-allowed-origins=CORS-ALLOWED-ORIGINS,...
                                 Allowed CORS origins.
      --version                  Show application version.
      --path-prefix=""           Path prefix for the UI
      --mutex-profile-fraction=0
                                 Fraction of mutex profile samples to collect.
      --block-profile-rate=0     Sample rate for block profile.
      --enable-persistence       Turn on persistent storage for the metastore
                                 and profile storage.
      --storage-active-memory=536870912
                                 Amount of memory to use for active storage.
                                 Defaults to 512MB.
      --storage-path="data"      Path to storage directory.
      --storage-enable-wal       Enables write ahead log for profile storage.
      --storage-snapshot-trigger-size=134217728
                                 Number of bytes to trigger a snapshot. Defaults
                                 to 1/4 of active memory. This is only used if
                                 enable-wal is set.
      --storage-row-group-size=8192
                                 Number of rows in each row group during
                                 compaction and persistence. Setting to <= 0
                                 results in a single row group per file.
      --storage-index-on-disk    Whether to store the index on disk instead
                                 of in memory. Useful to reduce the memory
                                 footprint of the store.
      --symbolizer-demangle-mode="simple"
                                 Mode to demangle C++ symbols. Default mode
                                 is simplified: no parameters, no templates,
                                 no return type
      --symbolizer-external-addr-2-line-path=""
                                 Path to addr2line utility, to be used for
                                 symbolization instead of native implementation
      --symbolizer-number-of-tries=3
                                 Number of tries to attempt to symbolize an
                                 unsybolized location
      --debuginfo-cache-dir="/tmp"
                                 Path to directory where debuginfo is cached.
      --debuginfo-upload-max-size=1000000000
                                 Maximum size of debuginfo upload in bytes.
      --debuginfo-upload-max-duration=15m
                                 Maximum duration of debuginfo upload.
      --debuginfo-uploads-signed-url
                                 Whether to use signed URLs for debuginfo
                                 uploads.
      --debuginfod-upstream-servers=debuginfod.elfutils.org,...
                                 Upstream debuginfod servers. Defaults to
                                 debuginfod.elfutils.org. It is an ordered
                                 list of servers to try. Learn more at
                                 https://sourceware.org/elfutils/Debuginfod.html
      --debuginfod-http-request-timeout=5m
                                 Timeout duration for HTTP request to upstream
                                 debuginfod server. Defaults to 5m
      --profile-share-server="api.pprof.me:443"
                                 gRPC address to send share profile requests to.
      --store-address=STRING     gRPC address to send profiles and symbols to.
      --bearer-token=STRING      Bearer token to authenticate with store
                                 ($PARCA_BEARER_TOKEN).
      --bearer-token-file=STRING
                                 File to read bearer token from to authenticate
                                 with store.
      --insecure                 Send gRPC requests via plaintext instead of
                                 TLS.
      --insecure-skip-verify     Skip TLS certificate verification.
      --external-label=KEY=VALUE;...
                                 Label(s) to attach to all profiles in
                                 scraper-only mode.
      --grpc-headers=KEY