OneUptime is a free, open source monitoring & observability project written in TypeScript and released under Apache-2.0. It has 7,617 GitHub stars, 455 forks and 292 open issues, and was last pushed 6 hours ago. On this registry it ranks #53 of 97 tracked projects in Monitoring & Observability, with 5 head-to-head comparisons available. It gained 18 stars over the last 6 tracked days.

What is OneUptime?

OneUptime is an open-source, self-hostable monitoring and observability platform written in TypeScript and released under the Apache-2.0 licence, built for DevOps, SRE, and on-call teams that want uptime checks, incident response, status pages, logs, traces, metrics, and APM in one application instead of a shelf of separate SaaS subscriptions.

What it is

OneUptime lives in the Infrastructure & Operations / Monitoring & Observability category. It is a single TypeScript application that combines multi-region uptime monitoring, alerting and on-call scheduling, incident management, public and private status pages, log management, error tracking, distributed traces, metrics, and APM dashboards. The project has 7,611 stars, 453 forks, and 292 open issues, and legal, technical, and documentation material is published in English alongside translations in Simplified Chinese, Traditional Chinese, Japanese, Korean, Spanish, French, German, Portuguese, Italian, Russian, Hindi, Persian, Dutch, Danish, Swedish, and Norwegian.

The concrete problem is tool sprawl. Teams typically run Pingdom or UptimeRobot for uptime checks, StatusPage.io for public status, PagerDuty or Opsgenie for on-call paging, Incident.io for incident workflow, Datadog or New Relic for APM and metrics, Loggly for logs, and Sentry for error tracking — seven products, seven bills, and no shared context between an alert and the trace that explains it. OneUptime replaces that set with one self-hostable app, so detection, paging, status communication, and root-cause correlation happen in the same system rather than across vendor boundaries.

Key capabilities

  • Multi-region uptime checks covering website, API, ping, port, SSL, DNS, and synthetic monitors, with automatic incident creation when a latency threshold such as 5s is breached.
  • Public and private branded status pages with email and SMS subscribers that update automatically when an incident changes.
  • On-call scheduling and alerting with escalation policies delivering SMS, phone call, push, and Slack notifications, escalating to backup until someone acknowledges.
  • Incident management for declaring, triaging, communicating, and writing post-mortems.
  • APM, metrics, and dashboards, including trace waterfalls that correlate traces, logs, and metrics down to the exact span.
  • Log management and error tracking: collect, search, and alert on logs, and capture exceptions with full stack traces and context.
  • An AI agent that opens a pull request with a proposed fix, linked to the incident and verified against the repository's configured build and test commands before the PR is opened.

Who uses it and how

  • Homelabs and small teams run the whole stack from Docker Compose on a single Debian, Ubuntu, or RHEL server; a Raspberry Pi is sufficient.
  • On-call rotations use escalation policies per policy area, for example a Payments policy that calls, texts, and push-notifies the on-call engineer and escalates to backup automatically.
  • Teams consolidating vendor spend deploy it to replace separate uptime, status page, paging, incident, APM, log, and error-tracking subscriptions.
  • SRE and DevOps teams use the correlated trace waterfall to find root cause, such as a slow SELECT … FOR UPDATE on orders stuck on a missing index.
  • Teams without infrastructure to operate can use OneUptime Cloud instead of self-hosting.

Getting started

Two paths are documented: sign up for the hosted OneUptime Cloud free-forever plan with no credit card, or self-host with Docker Compose by cloning the release branch, copying config.example.env to config.env, setting strong random secrets, and running npm start, after which the platform is reachable at http://localhost. Self-hosting requires a Debian, Ubuntu, or RHEL host with Docker and Docker Compose installed.

How it compares

Against Pingdom and UptimeRobot for uptime, StatusPage.io for status pages, PagerDuty and Opsgenie for on-call, Incident.io for incidents, Datadog and New Relic for APM, Loggly for logs, and Sentry for errors, OneUptime is Apache-2.0 licensed and free to self-host, while those alternatives are paid hosted products. Self-hosting places the monitoring data, incident history, and subscriber list on infrastructure the operator controls rather than in each vendor's tenancy, and collapses several recurring subscriptions into one system to run. The hosted cloud plan exists as an alternative for teams that would rather not operate that system themselves.

When to use it — and when not to

A self-hoster must run and maintain a Docker and Docker Compose host, edit config.env with strong random secrets, and keep the release branch updated, so the operational burden sits with the operator rather than a vendor. The project carries 292 open issues, which signals active development but also a real backlog, and the README reads as a narrative walkthrough rather than reference documentation, so plan to work from the docs site. Teams that need only simple uptime pings, or that want a zero-ops single-purpose tool, should not adopt the full stack — a narrower monitor or the hosted plan fits better than a self-hosted platform spanning seven product categories.

project readme (upstream, from github) — read inline

English · 简体中文 · 繁體中文 · 日本語 · 한국어 · Español · Français · Deutsch · Português · Italiano · Русский · हिन्दी · فارسی · Nederlands · Dansk · Svenska · Norsk

OneUptime logo

Agentic observability — one open-source platform for uptime, incidents, on-call, status pages, logs, traces, metrics & APM.

When things go wrong, be the first to know — and the fastest to fix.

OneUptime replaces a whole shelf of SaaS tools with one platform you can self-host for free. It catches the outage, pages the right person, updates your status page, finds the root cause, and even opens the fix PR.


License Release Stars Helm Chart Slack

Website  •  Docs  •  Quick Start  •  Pricing  •  Contribute

🚀 Try OneUptime Cloud — free forever plan, no credit card →
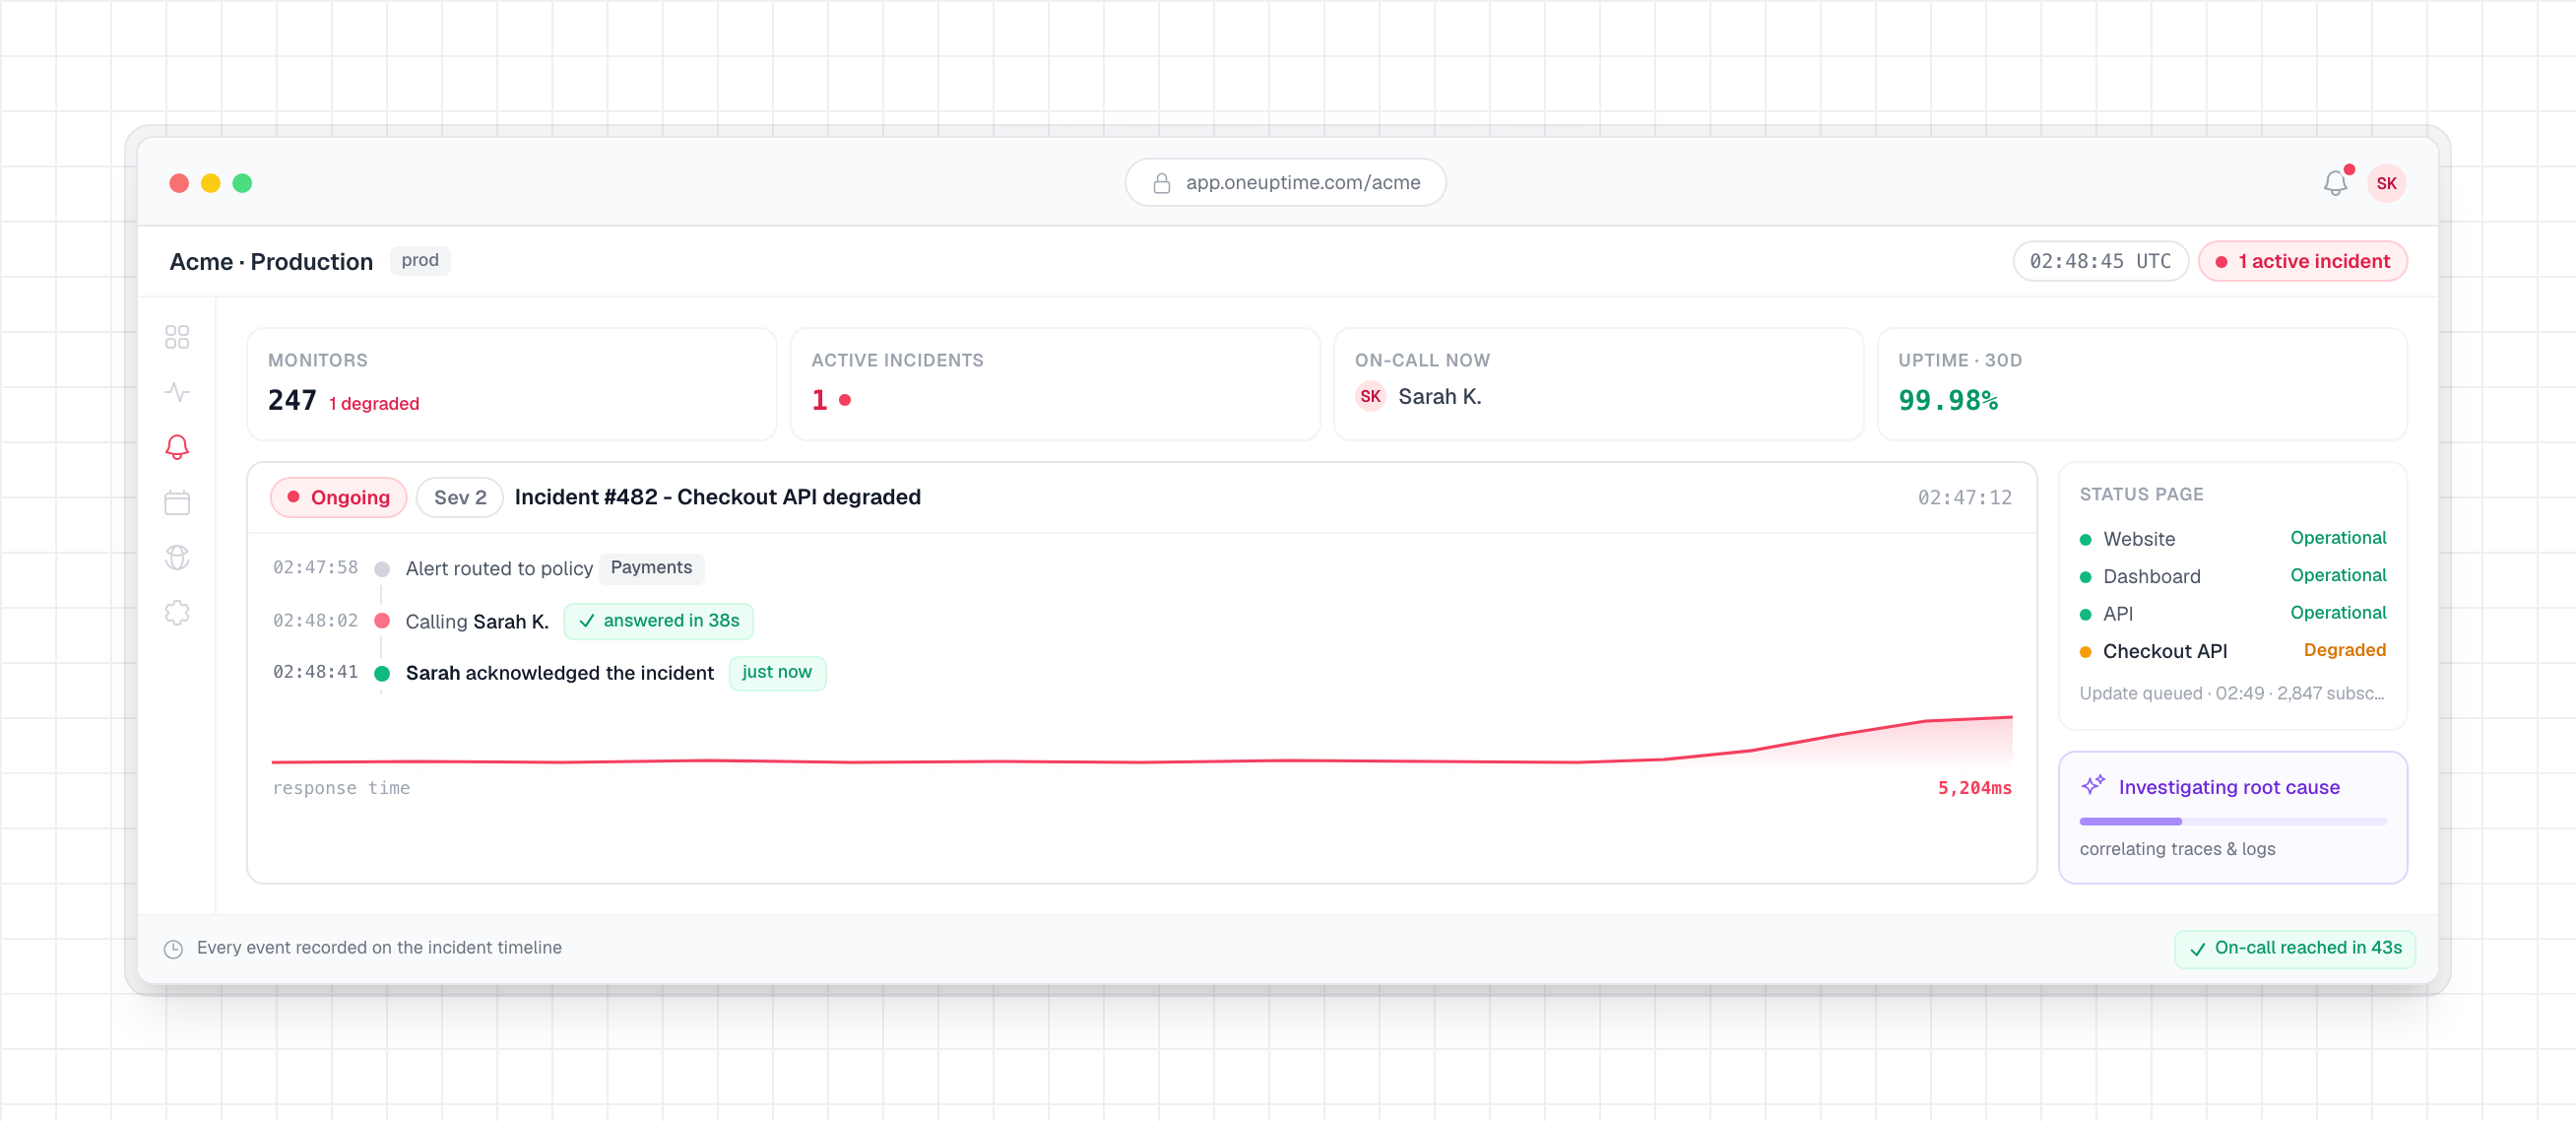

OneUptime command center during a live incident

Replace your whole observability stack

OneUptime brings monitoring, alerting, incident response, and observability into a single open-source app — so you stop paying for (and stitching together) a dozen separate tools.

Instead of… Use OneUptime for…
Pingdom / UptimeRobot Uptime Monitoring — website, API, ping, port, SSL, DNS & synthetic checks from around the world
StatusPage.io Status Pages — branded public & private status pages with subscribers
PagerDuty / Opsgenie On-Call & Alerts — schedules, escalation policies, SMS / call / push / Slack
Incident.io Incident Management — declare, triage, communicate, and post-mortem
Datadog / New Relic APM & Metrics — traces, dashboards, and service performance
Loggly Log Management — collect, search, and alert on logs
Sentry Error Tracking — exceptions with full stack traces and context

All of it is 100% open source (Apache 2.0) and free to self-host.


🌙 One incident, handled end to end

It's 2:47 AM. Checkout starts timing out. Here's what OneUptime does before most tools would even fire the first alert — and what the screenshots below actually show.

1 · Detect — know in seconds

Probes in multiple regions catch checkout latency blowing past your 5s threshold and open an incident automatically — before your customers hit refresh.

Detect — global monitoring catches the checkout API degrading

2 · Respond — the right person, paged

The on-call engineer for the Payments policy is called, texted, and push-notified, escalating to backup automatically until someone acknowledges.

Respond — the incident is routed to on-call and acknowledged

3 · Communicate — customers in the loop

Your status page updates itself and every subscriber is notified by email and SMS — no one has to hand-write the update.

Communicate — the public status page updates and notifies subscribers

4 · Diagnose — root cause, found

Traces, logs, and metrics are correlated down to the exact span: a slow SELECT … FOR UPDATE on orders, stuck on a missing index.

Diagnose — the trace waterfall pinpoints the slow database span

5 · Auto-Fix — the fix, drafted for you

The AI agent opens a pull request with the fix, linked to the incident, verified against your repository's configured build and test commands before it opens — you review and merge. Like an SRE that never sleeps.

Auto-Fix — the AI agent opens a pull request with the fix


⚡ Quick Start

☁️ OneUptime Cloud — the easy way

Zero setup, always up to date, and it funds the open-source project.

Sign up free at oneuptime.com

🐳 Self-host with Docker Compose

Everything you need on a single server (Debian / Ubuntu / RHEL, Docker + Docker Compose). Great for homelabs and small teams — a Raspberry Pi even works.

# 1. Clone the release branch
git clone --depth 1 --single-branch --branch release https://github.com/OneUptime/oneuptime.git
cd oneuptime

# 2. Create your config (then edit it — set strong, random secrets!)
cp config.example.env config.env

# 3. Start everything
npm start

OneUptime is now running at http://localhost — open it and create your first account.

📖 Full guide: Docker Compose install · Sizing & requirements

☸️ Kubernetes with Helm — for production

helm repo add oneuptime https://helm-chart.oneuptime.com
helm install oneuptime oneuptime/oneuptime

📖 Full install instructions & values on Artifact Hub →

Upgrading an existing install? See the upgrade guide.


✨ Everything in the box

Feature What it does
📊 Uptime Monitoring Website, API, IP, port, SSL, DNS, and synthetic monitors from multiple global regions.
📋 Status Pages Beautiful branded status pages, incident history, scheduled maintenance, and subscriber notifications.
🚨 Incident Management End-to-end incident workflow: declare, assign, communicate, resolve, and run post-mortems.
📞 On-Call & Alerts On-call schedules and escalation policies with SMS, phone call, push, email, and Slack alerts.
📝 Log Management Ingest, store, search, and alert on logs via OpenTelemetry.
🔍 APM & Traces Distributed traces, spans, and performance dashboards to find slow paths and bottlenecks.
📈 Metrics & Dashboards Custom dashboards over your telemetry — build the views your team needs.
🐛 Error Tracking Capture exceptions with full stack traces, context, and release tracking.
Workflows Automate and integrate with Slack, Jira, GitHub, Microsoft Teams, and 5,000+ apps.
🤖 AI Copilot An always-on agent that finds anomalies across logs, traces & metrics, spots root causes, and opens PRs with fixes.
⚡ Automate the busywork

Wire up escalations, ticketing, and notifications on a visual, no-code canvas — or drop in custom code. The incident above paged on-call, opened a Jira ticket, and posted to Slack without anyone lifting a finger.

Workflows — a no-code automation canvas for incident escalation

🖥️ Infras

readme truncated — read the full docs on github

Frequently asked questions

Is OneUptime free to use?

OneUptime is open source under the Apache-2.0 licence. There is no licence fee and no seat count — you can self-host it or, where the project offers one, pay a vendor for a managed version instead.

What does OneUptime do?

Comprehensive monitoring and incident management platform

What is OneUptime written in?

OneUptime is primarily written in TypeScript. Its source is publicly available at https://github.com/OneUptime/oneuptime, and it has 7,617 GitHub stars.
