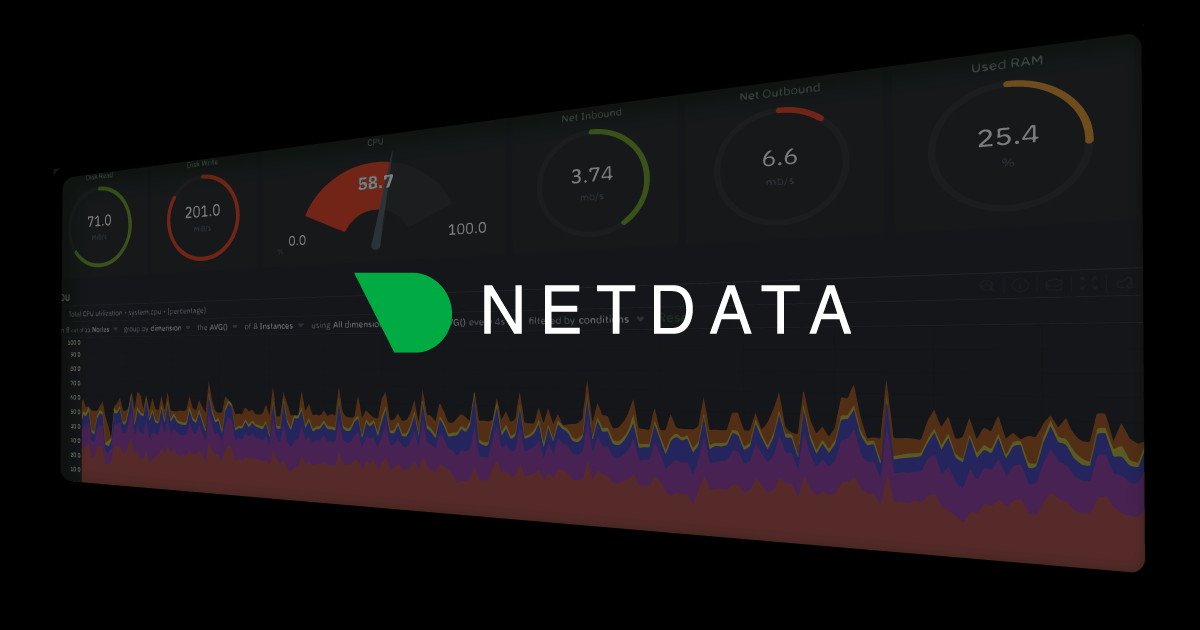


NetData is a free, open source monitoring & observability project written in Go and released under GPL-3.0. It has 80,561 GitHub stars, 6,630 forks and 393 open issues, and was last pushed 3 hours ago. On this registry it ranks #3 of 97 tracked projects in Monitoring & Observability, with 5 head-to-head comparisons available. It gained 61 stars over the last 6 tracked days.

NetData — Real-time monitoring for systems and applications

What is NetData?

Netdata is an open-source, real-time infrastructure monitoring platform written in Go and released under GPL-3.0, built for operators and lean teams who need per-second visibility across Linux, macOS, FreeBSD, and Windows systems.

What it is

Netdata is a real-time infrastructure monitoring platform that collects, stores, visualizes, and alerts on per-second metrics from the nodes it runs on. It is developed primarily in Go under the GPL-3.0 licence, carries an 80,560-star following on GitHub, and sits in the cloud-native ecosystem as a CNCF-listed project. The README describes a three-part architecture, of which the Netdata Agent is the core monitoring engine handling collection, storage, machine learning, alerts, and exports. A Parent-Child centralization model allows agents to stream to a parent node, scaling from a single machine to multi-cloud fleets. Processing happens at the edge, so data stays local unless it is explicitly centralized.

The concrete problem it addresses is resolution and cost. The project's origin story traces to 2013, when a company where creator Costa Tsaousis served as COO lost a significant share of cloud-based transactions to silent failures. The troubleshooting tools available at the time could not identify a root cause, and the conclusion recorded was that monitoring systems offered too few metrics, at too low a resolution, scaled badly, and cost too much to run. Netdata replaces that class of low-resolution, expensive monitoring setup with a zero-configuration agent that publishes every metric every second, and it is positioned directly against Prometheus in the project's own published comparison.

Key capabilities

  • Collects and processes metrics at one-second resolution, with visualization that requires no query language to slice and dice data.
  • Auto-discovers the workloads and services running on a node, so deployment needs no complex setup or manual metric registration.
  • Trains multiple unsupervised machine-learning models per metric at the edge for anomaly detection and issue prediction.
  • Stores long-term data at roughly 0.5 bytes per sample using tiered storage for archiving.
  • Scales horizontally through Parent-Child centralization, described as handling multi-million samples per second.
  • Keeps data on the operator's premises by distributing code rather than centralizing data, with no central collection required.
  • Covers infrastructure through to applications, with alerting, dashboards, and integrations catalogued under topics including grafana, influxdb, docker, kubernetes, and database.

Who uses it and how

  • Lean operations teams that need full-stack observability without staffing a dedicated monitoring platform group.
  • Docker-based and Kubernetes environments; a University of Amsterdam study cited in the README found Netdata the most energy-efficient tool for monitoring Docker-based systems, with favorable CPU and RAM usage and execution time.
  • Multi-cloud and multi-node estates, where Netdata Agents stream to a Parent for centralized long-term retention.
  • Edge and on-premises deployments that must keep telemetry inside their own boundaries.
  • Linux, macOS, FreeBSD, and Windows fleets, all of which the README names as supported platforms.

Getting started

The README points readers to its own Getting Started section and to the project home page at https://www.netdata.cloud, and the topic list names Docker and Kubernetes among the supported deployment targets.

How it compares

Two comparable tools appear in the project's own material: Prometheus, which Netdata addresses through a dedicated published comparison, and Grafana, listed among the project's topics as an integration surface. The distinguishing claims the README makes are per-second resolution, zero-configuration discovery, and edge-based processing that avoids a central data pipeline.

When to use it — and when not to

A self-hoster runs a Netdata Agent on every monitored node and, for centralized retention and fleet-wide views, operates a Parent node as well, so storage sizing and alert routing are the operator's responsibility. Teams that only want a fully managed hosted service, or that cannot place an agent on each host, should look elsewhere, and anyone embedding the code in a proprietary product must weigh the GPL-3.0 copyleft terms. One honest gap: the supplied material names a three-part ecosystem but details only the Netdata Agent, so the Parent and cloud-side components need separate reading before commitment.

project readme (upstream, from github) — read inline

Netdata Netdata

X-Ray Vision for your infrastructure!

Every Metric, Every Second. No BS.


GitHub Stars
Live Demo Latest release Latest nightly build
Discourse topics GitHub Discussions
CII Best Practices Coverity Scan

User base Servers monitored Sessions served Docker Hub pulls

Visit our Home Page


MENU: WHO WE ARE | KEY FEATURES | GETTING STARTED | HOW IT WORKS | FAQ | DOCS | COMMUNITY | CONTRIBUTE | LICENSE

[!WARNING] People get addicted to Netdata. Once you use it on your systems, there's no going back.

Platforms


WHO WE ARE

Netdata is an open-source, real-time infrastructure monitoring platform. Monitor, detect, and act across your entire infrastructure.

Core Advantages:

  • Instant Insights – With Netdata you can access per-second metrics and visualizations.
  • Zero Configuration – You can deploy immediately without complex setup.
  • ML-Powered – You can detect anomalies, predict issues, and automate analysis.
  • Efficient – You can monitor with minimal resource usage and maximum scalability.
  • Secure & Distributed – You can keep your data local with no central collection needed.

With Netdata, you get real-time, per-second updates. Clear insights at a glance, no complexity.

All heroes have a great origin story. Click to discover ours.

In 2013, at the company where Costa Tsaousis was COO, a significant percentage of their cloud-based transactions failed silently, severely impacting business performance.

Costa and his team tried every troubleshooting tool available at the time. None could identify the root cause. As Costa later wrote:

I couldn’t believe that monitoring systems provide so few metrics and with such low resolution, scale so badly, and cost so much to run.

Frustrated, he decided to build his own monitoring tool, starting from scratch.

That decision led to countless late nights and weekends. It also sparked a fundamental shift in how infrastructure monitoring and troubleshooting are approached, both in method and in cost.

Most Energy-Efficient Monitoring Tool

Energy Efficiency Energy efficiency

According to the University of Amsterdam study, Netdata is the most energy-efficient tool for monitoring Docker-based systems. The study also shows Netdata excels in CPU usage, RAM usage, and execution time compared to other monitoring solutions.


Key Features

Feature Description What Makes It Unique
Real-Time Per-second data collection and processing Works in a beat – click and see results instantly
Zero-Configuration Automatic detection and discovery Auto-discovers everything on the nodes it runs
ML-Powered Unsupervised anomaly detection Trains multiple ML models per metric at the edge
Long-Term Retention High-performance storage ~0.5 bytes per sample with tiered storage for archiving
Advanced Visualization Rich, interactive dashboards Slice and dice data without query language
Extreme Scalability Native horizontal scaling Parent-Child centralization with multi-million samples/s
Complete Visibility From infrastructure to applications Simplifies operations and eliminates silos
Edge-Based Processing at your premises Distributes code instead of centralizing data

[!NOTE]
Want to put Netdata to the test against Prometheus? Explore the full comparison.


Netdata Ecosystem

This three-part architecture enables you to scale from single nodes to complex multi-cloud environments:

Component Description License
Netdata Agent • Core monitoring engine
• Handles collection, storage, ML, alerts, exports
• Runs on servers, cloud, K8s, IoT
• Zero production impact
GPL v3+
Netdata Cloud • Enterprise features
• User management, RBAC, horizontal scaling
• Centralized alerts
• Free community tier
• No metric storage centralization
Netdata UI • Dashboards and visualizations
• Free to use
• Included in standard packages
• Latest version via CDN
[NCUL1](https://app.netdata

readme truncated — read the full docs on github

Frequently asked questions

Is NetData free to use?

NetData is open source under the GPL-3.0 licence. There is no licence fee and no seat count — you can self-host it or, where the project offers one, pay a vendor for a managed version instead.

What does NetData do?

Real-time monitoring for systems and applications

What is NetData written in?

NetData is primarily written in Go. Its source is publicly available at https://github.com/netdata/netdata, and it has 80,561 GitHub stars.




