MyPerf4J is a high-performance Java APM and method-level performance statistics tool, built on ASM bytecode instrumentation and aimed at teams running high-concurrency, low-latency JVM applications that need continuous visibility into method and JVM behaviour without modifying application code.
What it is
MyPerf4J is an open-source Java performance monitoring and statistics tool released under the BSD-3-Clause licence. It attaches to a running JVM as a Java agent and instruments application bytecode with ASM, collecting method-level and JVM-level metrics on a continuous basis. It lives in the Java and JVM ecosystem, where its topics place it among agent, bytecode, java-agent, jvm-monitor, diagnostics, and observability tooling for microservices. The project is written in Java and published from the LinShunKang/MyPerf4J repository, which has drawn 3566 stars and 554 forks.
The concrete problem it solves is the cost of instrumenting application code by hand. Instead of adding timers, counters, and percentile bookkeeping directly into source files, a team starts the JVM with -javaagent:/path/to/MyPerf4J-ASM.jar together with -DMyPerf4JPropFile=/path/to/MyPerf4J.properties and lets the agent gather the measurements. In that sense it replaces hand-written, in-application performance instrumentation and the code changes that approach demands, keeping the collection transparent to the application. Its stated purposes are to locate performance bottlenecks quickly and to locate the causes of faults quickly.
Key capabilities
- Attaches as a Java agent through -javaagent:/path/to/MyPerf4J-ASM.jar with -DMyPerf4JPropFile=/path/to/MyPerf4J.properties, so no source changes are required in the monitored application.
- Performs bytecode instrumentation with ASM, the mechanism behind the non-invasive collection model.
- Collects Method Metrics including RPS, Count, Avg, Min, Max, StdDev, and the TP50, TP90, TP95, TP99, TP999, TP9999, and TP100 percentiles.
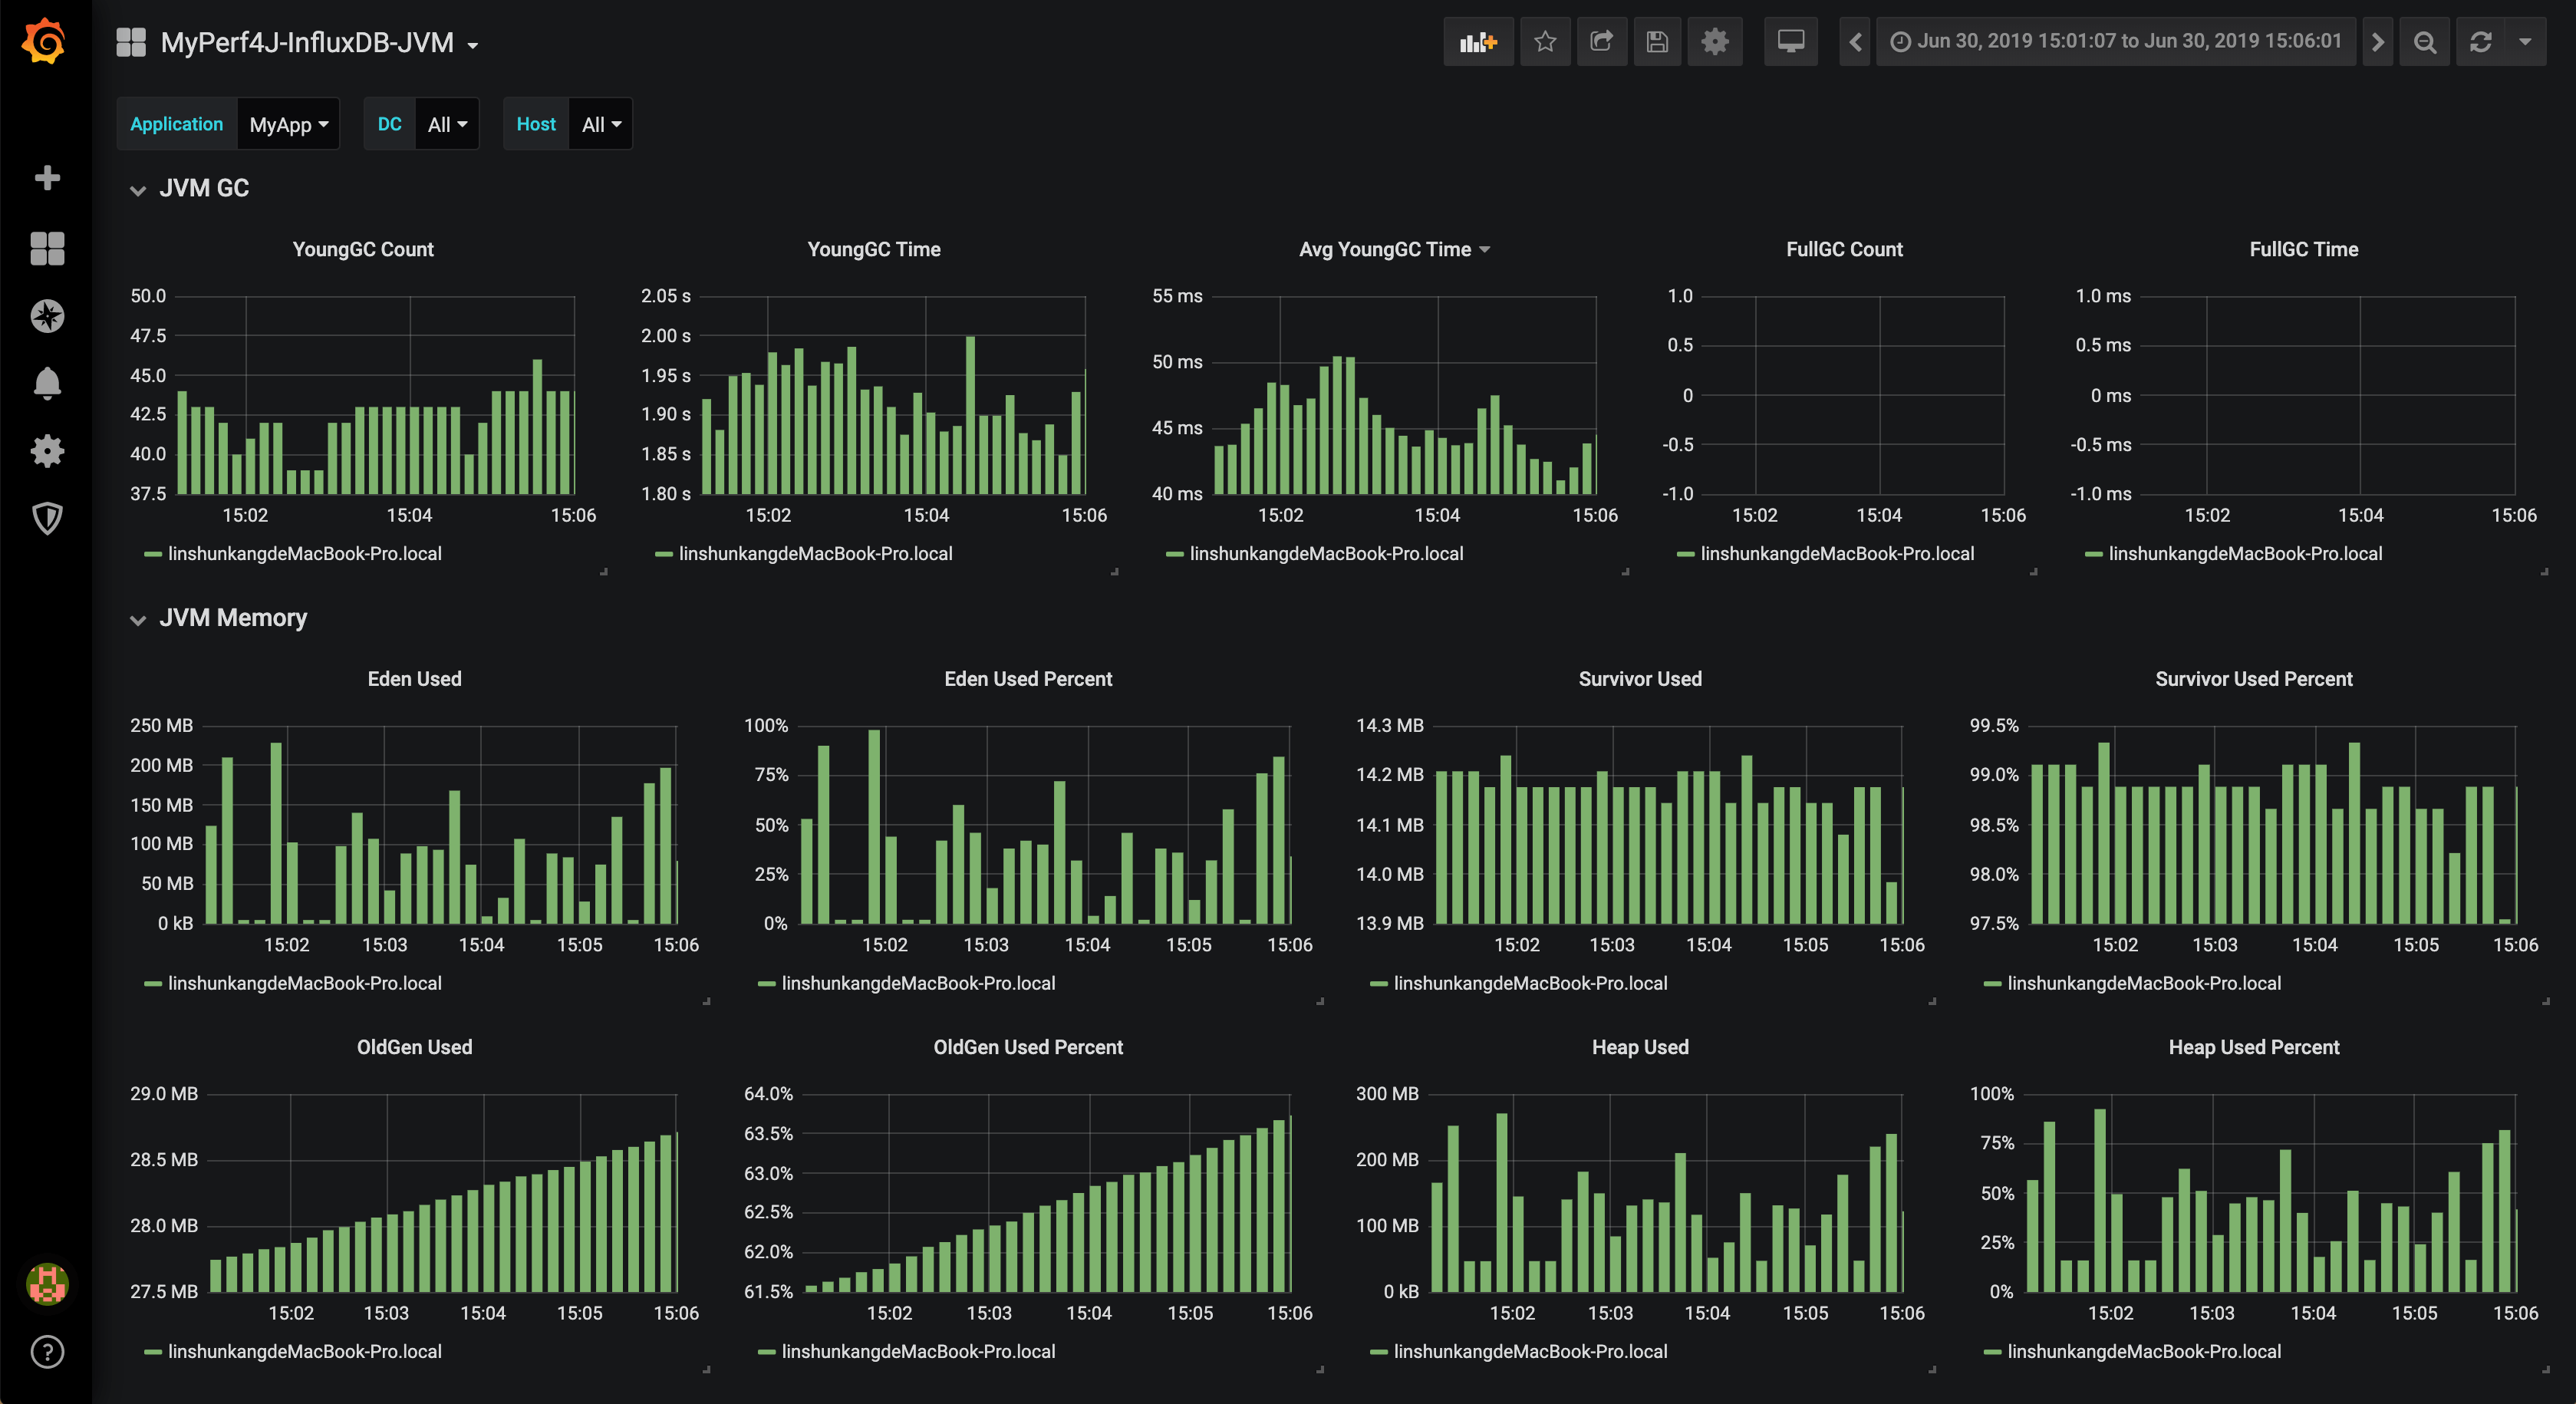
- Collects JVM Metrics covering Thread, Memory, ByteBuff, GC, Class, Compilation, and FileDescriptor.
- Reports at a one-second minimum granularity, described as second-level and full statistics that do not drop a record.
- Claims a single thread can record 16 million response times per second at 63 nanoseconds per record, using memory reuse so that few temporary objects are created and application GC is not disturbed.
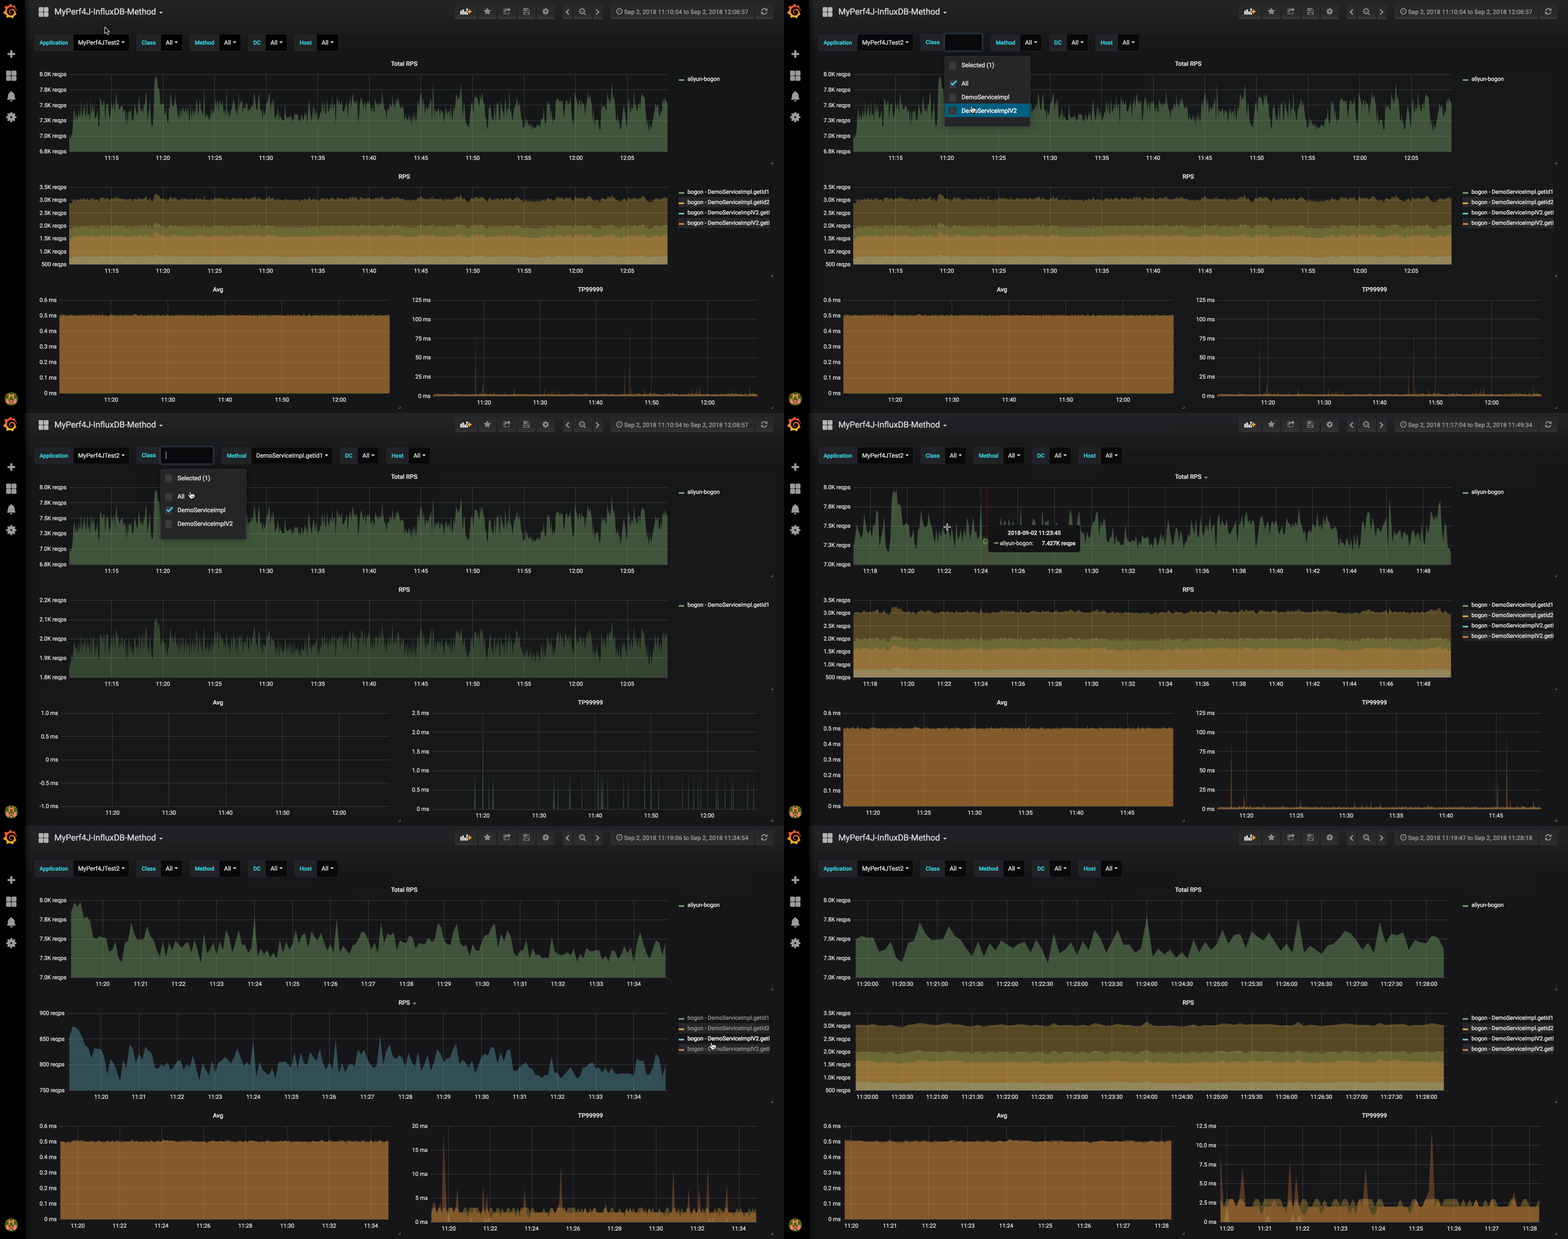
- Writes to log destinations such as /path/to/log/method_metrics.log and feeds Grafana dashboards 7766 for method metrics and 8787 for JVM metrics when paired with InfluxDB.
- Reads configuration keys including app_name, metrics.log.xxx, and filter.packages.include from the properties file.
Who uses it and how
- Teams running high-concurrency, low-latency JVM services attach the agent at process startup and leave it in place, which suits long-lived production workloads rather than one-off profiling sessions.
- Operators who need per-method percentiles use the method_metrics.log output and the TP50 through TP100 columns to identify slow methods, then filter collection with filter.packages.include to keep the scope on the packages that matter.
- Teams wanting dashboards pair the agent output with InfluxDB storage and import Grafana dashboard 7766 for method metrics or 8787 for JVM metrics, giving one view per service across a microservice estate.
- Engineers diagnosing faults read the second-by-second statistics to correlate a change in RPS, average latency, or GC and thread behaviour with an incident window.
- Because the agent reports on a per-second cycle, it is useful where latency budgets are tight enough that minute-level sampling would hide the problem.
Getting started
Download and unzip MyPerf4J-ASM.zip, which the README references at version 3.6.0, then edit the MyPerf4J.properties file. Add -javaagent:/path/to/MyPerf4J-ASM.jar and -DMyPerf4JPropFile=/path/to/MyPerf4J.properties to the JVM startup arguments, and on JDK 9 or above also add --add-opens java.base/java.lang=ALL-UNNAMED.
How it compares
The facts provided do not name any paid products that MyPerf4J replaces, and they do not name comparable open-source tools either. On the evidence available it stands alone in this registry, so no licence, hosting, data-ownership, or cost comparison against other products can be made here without inventing one.
When to use it — and when not to
A self-hoster operates the agent configuration, the metric log files it writes, and, if dashboards are wanted, an InfluxDB and Grafana pipeline; none of that is hosted for you, and the README excerpt covers configuration rather than day-two operations. The documentation is split across a Chinese README, an English README, and wiki pages, so some reading is required before the configuration keys make sense. Teams outside the JVM, or those who want a managed APM with a built-in user interface and no local storage stack, should not pick it, though maintenance is not the concern given 5 open issues and a push as recent as 2026-07-31.
project readme (upstream, from github) — read inline
简体中文 | English
MyPerf4J
一个针对高并发、低延迟应用设计的高性能 Java 性能监控和统计工具。


价值
优势
- 高性能: 单线程支持每秒 1600 万次 响应时间的记录,每次记录只花费 63 纳秒
- 无侵入: 采用 JavaAgent 方式,对应用程序完全无侵入,无需修改应用代码
- 低内存: 采用内存复用的方式,整个生命周期只产生极少的临时对象,不影响应用程序的 GC
- 高实时: 支持秒级统计,最低统计粒度为 1 秒,并且是全量统计,不丢失任何一次记录
文档
监控指标
MyPerf4J 为每个应用收集数十个监控指标,所有的监控指标都是实时采集和展现的。
下面是 MyPerf4J 目前支持的监控指标列表:
快速启动
MyPerf4J 采用 JavaAgent 配置方式,透明化接入应用,对应用代码完全没有侵入。
下载
- 下载并解压 MyPerf4J-ASM.zip
- 阅读解压出的
README 文件
- 修改解压出的
MyPerf4J.properties 配置文件中 app_name、metrics.log.xxx 和 filter.packages.include 的配置值
查看配置文件模板。想了解更多的配置?请看这里
配置
在 JVM 启动参数里加上以下两个参数
- -javaagent:/path/to/MyPerf4J-ASM.jar
- -DMyPerf4JPropFile=/path/to/MyPerf4J.properties
形如:java -javaagent:/path/to/MyPerf4J-ASM.jar -DMyPerf4JPropFile=/path/to/MyPerf4J.properties -jar yourApp.jar
注意:如果您使用 JDK9 及其之上的版本,请额外添加 --add-opens java.base/java.lang=ALL-UNNAMED
运行
启动应用,监控日志输出到 /path/to/log/method_metrics.log:
MyPerf4J Method Metrics [2020-01-01 12:49:57, 2020-01-01 12:49:58]
Method[6]                            Type        Level  TimePercent      RPS  Avg(ms)  Min(ms)  Max(ms)    StdDev    Count     TP50     TP90     TP95     TP99    TP999   TP9999
DemoServiceImpl.getId2(long)      General      Service      322.50%     6524     0.49        0        1     0.50      6524        0        1        1        1        1        1
DemoServiceImpl.getId3(long)      General      Service      296.10%     4350     0.68        0        1     0.47      4350        1        1        1        1        1        1
DemoServiceImpl.getId4(long)      General      Service      164.60%     2176     0.76        0        1     0.43      2176        1        1        1        1        1        1
DemoServiceImpl.getId1(long)      General      Service        0.00%     8704     0.00        0        0     0.00      8704        0        0        0        0        0        0
DemoDAO.getId1(long)         DynamicProxy          DAO        0.00%     2176     0.00        0        0     0.00      2176        0        0        0        0        0        0
DemoDAO.getId2()             DynamicProxy          DAO        0.00%     2176     0.00        0        0     0.00      2176        0        0        0        0        0        0
卸载
在 JVM 启动参数中去掉以下两个参数,重启即可卸载此工具。
- -javaagent:/path/to/MyPerf4J-ASM.jar
- -DMyPerf4JPropFile=/path/to/MyPerf4J.properties
构建
您可以自行构建 MyPerf4J-ASM.jar
MyPerf4J-ASM-${MyPerf4J-version}.jar 在 MyPerf4J-ASM/target/ 目录下
问题
如果您有任何问题、疑问或者建议,您可以 提交Issue 或者 发送邮件 :)
注意,为了保障大家的时间,请保证您已经完整阅读过以下内容:
已知用户
如果您在使用 MyPerf4J,请告诉我,您的使用对我来说非常重要:https://github.com/LinShunKang/MyPerf4J/issues/30(按登记顺序排列)



鸣谢
感谢 JetBrains OpenSourceSupport 所提供的支持 : )

项目捐赠
如果 MyPerf4J 对您有帮助,可以使用微信扫描下面的赞赏码,请我喝杯咖啡 : )

参考项目
MyPerf4J 是受以下项目启发而来:
更多信息
想更深入的了解 MyPerf4J?请看 https://github.com/LinShunKang/MyPerf4J/wiki/Chinese-Doc。