Matplot++ is an MIT-licensed C++ graphics library for data visualization, built for programmers and scientists who need to plot data from inside a C++ program rather than hand it off to another environment.
What it is
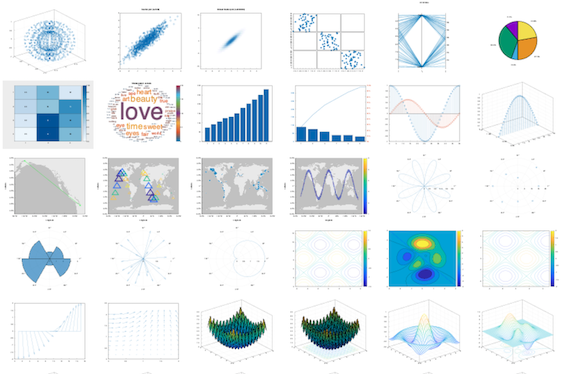
Matplot++ is a C++ library for data visualization. It provides interactive plotting, export of plots in high-quality formats for scientific publications, a compact syntax consistent with similar libraries, dozens of plot categories with specialized algorithms, multiple coding styles, and support for generic backends. The project carries topics across data visualization, charting libraries, charts, graphs, plots, contour plots, plot categories, data analysis, and data science, and it sits in the Data & Analytics / Business Intelligence & Reporting category of this registry.
The concrete problem it solves is the gap in the C++ ecosystem itself. The README states that the customary alternatives available to C++ users are either non-dedicated libraries that depend on existing user interfaces, or bindings to other languages. Neither gives a C++ program a first-class plotting interface of its own. Matplot++ replaces that compromise: instead of reaching out through a UI toolkit or a foreign-language binding, a C++ application links a dedicated graphics library and gets plotting directly. It also covers the case where results must leave the program, offering export in high-quality formats suited to scientific publications rather than only on-screen output.
Key capabilities
- Interactive plotting for exploring data from within a C++ program.
- Export of plots in high-quality formats intended for scientific publications.
- Dozens of plot categories, including contour plots, with specialized algorithms behind them.
- A compact syntax consistent with similar plotting libraries, which eases porting of existing plotting habits.
- Multiple coding styles, so the same plotting work can be expressed in more than one way.
- Support for generic backends, decoupling the library from a single rendering or output target.
- Coverage spanning charts, graphs, plots, and plot categories under the charting-library and graphics-library topics.
Who uses it and how
- Programmers and scientists working in modern C++, who the README identifies as the audience for scientific data visualization.
- Scientific applications that need to communicate results to peers, where the library's publication-grade export is the relevant path.
- Workflows where the alternative would be a non-dedicated library tied to an existing user interface, or a binding into another language.
- Data analysis and data science work expressed in C++, as reflected in the project's topic list.
- Researchers and engineers producing figures for publication, who need the export step rather than only an interactive window.
Getting started
The README links a "Download" badge pointing at the GitHub Releases page for the latest release, and documentation is hosted at https://alandefreitas.github.io/matplotplusplus/.
How it compares
The facts provided name no specific competing products, and no list of paid products that Matplot++ replaces is given. On the evidence available, it stands alone in this registry.
When to use it — and when not to
Matplot++ is a library rather than a service, so adopting it means building and linking C++ code rather than provisioning a database, object store, or SMTP relay; the operational weight sits in the toolchain and dependency management, not in running infrastructure. The documentation site and the release download are the documented entry points, and anyone who needs a package-manager one-liner or a hosted plotting service should look elsewhere. The project is actively maintained, with a last push on 2026-04-02, but it carries 82 open issues and the README excerpt documents capabilities more thoroughly than it documents an install command, so expect to lean on the documentation site and the release artifacts to get started.




















 [
[ ](docs/COMPLETE_GALLERY.m