maintenant
Drop a container. Your stack is monitored.
Docker, Kubernetes, uptime, TLS, cron jobs, live logs, image updates, CVEs: auto-discovered, alerting on every one of them,
from a single Go binary that idles under 30 MB of RAM. No PromQL, no exporters, no dashboards to build.




Quick Start • Why maintenant • Features • Documentation • Editions • Pricing
Quick Start
# docker-compose.yml
services:
  maintenant:
    image: ghcr.io/kolapsis/maintenant:latest
    ports:
      # ⚠️  SECURITY: publishes the UI/API (no authentication of their own) on
      # every interface; put an auth reverse proxy in front, or bind "127.0.0.1:8080:8080". See https://docs.maintenant.dev/security/#reverse-proxy-setup.
      - "8080:8080"
    read_only: true
    security_opt:
      - no-new-privileges:true
    tmpfs:
      - /tmp:noexec,nosuid,size=64m
    volumes:
      - /var/run/docker.sock:/var/run/docker.sock:ro
      - /proc:/host/proc:ro
      - maintenant-data:/data
    environment:
      MAINTENANT_ADDR: "0.0.0.0:8080"
      MAINTENANT_DB: "/data/maintenant.db"
    restart: unless-stopped

volumes:
  maintenant-data:
docker compose up -d
Open http://localhost:8080. Your containers are already there, with their health, restart loops, resources and logs. Nothing to configure.
Docker socket access is automatic: the entrypoint reads the mounted socket's group and grants it to the unprivileged user, on Compose and on Swarm (where docker stack deploy silently ignores group_add). If containers do not show up, see Troubleshooting.
Kubernetes
kubectl apply -f deploy/kubernetes/
In-cluster API auto-detected, read-only RBAC, namespace filtering, workloads (Deployments, DaemonSets, StatefulSets) as first-class citizens. Kubernetes guide.
Bare Linux, no Docker at all (systemd, amd64 and arm64, statically linked)
curl -fsSL https://install.maintenant.dev | sudo bash
Endpoints, certificates and heartbeats work without any container runtime. Container monitoring switches on by itself the moment a runtime shows up. Install documentation for pinned versions, air-gapped installs and supply-chain verification.
Cloud: one cloud-init file boots a hardened host with maintenant running on Hetzner Cloud, DigitalOcean, Scaleway, OVHcloud or Vultr.
Why maintenant?
Monitoring your own infrastructure with the standard stack means running Prometheus, Grafana, Alertmanager, node-exporter, cAdvisor, blackbox-exporter, a certificate exporter, Loki, Promtail, Trivy and something for image updates. Ten-odd components, each with its own config, upgrades and dashboards, to answer one question: is my stack up, and what is burning?
maintenant answers that question with one container.
| Built into maintenant | What you would assemble instead |
|---|---|
| Container state, health checks, restart loops | cAdvisor + node-exporter + alert rules you write |
| CPU, memory, network and disk, per container and per host | cAdvisor + node-exporter + Grafana dashboards you build |
| HTTP / TCP endpoint checks, declared as Docker labels | blackbox-exporter + a config file per target |
| TLS certificate expiry and chain validation | ssl_exporter |
| Cron and heartbeat deadlines | Pushgateway + alert rules you write |
| Live container logs, stdout/stderr demuxed | Dozzle, or Loki + Promtail |
| Image update detection, with compose-aware update and rollback commands | Diun or Watchtower |
Network exposure audit: 0.0.0.0 binds, exposed database ports, host network, privileged containers |
nothing standard |
| CVE enrichment and per-container risk score (Personal) | Trivy + its exporter |
| Alerts routed to Discord, webhooks, email, Telegram, Slack and Teams, with escalation (Pro) | Alertmanager |
| Public status page with incidents and subscribers | Cachet, Uptime Kuma, or a SaaS |
| One real-time dashboard for all of the above | Grafana + dashboards you build and maintain |
Do I still need Prometheus? maintenant monitors your infrastructure. Prometheus monitors your application. There is no PromQL here, no custom exporters, no panels to design: maintenant already knows what a container, a certificate, an endpoint, a cron job and a CVE are, and starts watching them the moment they appear. If you ship business metrics and write your own queries, keep Prometheus for that. The two answer different questions, and plenty of people run both.
Against the tools usually stacked up next to it:
| maintenant | Uptime Kuma | Portainer | Dozzle | |
|---|---|---|---|---|
| Container auto-discovery | Yes | No | Yes | Yes |
| Live container logs | Yes | No | Yes | Yes |
| HTTP/TCP endpoint checks | Yes | Yes | No | No |
| Cron/heartbeat monitoring | Yes | Yes | No | No |
| SSL certificate tracking | Yes | Yes | No | No |
| CPU/memory/network metrics | Yes | No | Limited | No |
| Image update detection | Yes | No | Yes | No |
| Network security insights | Yes | No | No | No |
| CVE enrichment, risk scoring | Personal | No | No | No |
| Public status page | Yes | Yes | No | No |
| Alerting with routing | Yes | Yes | Limited | No |
| Kubernetes native | Yes | No | Yes | No |
| Single binary, zero deps | Yes | Node.js | Docker API | Docker API |
| Runs without a runtime | Yes | No | No | No |
One container. One dashboard. Everything monitored.
Screenshots

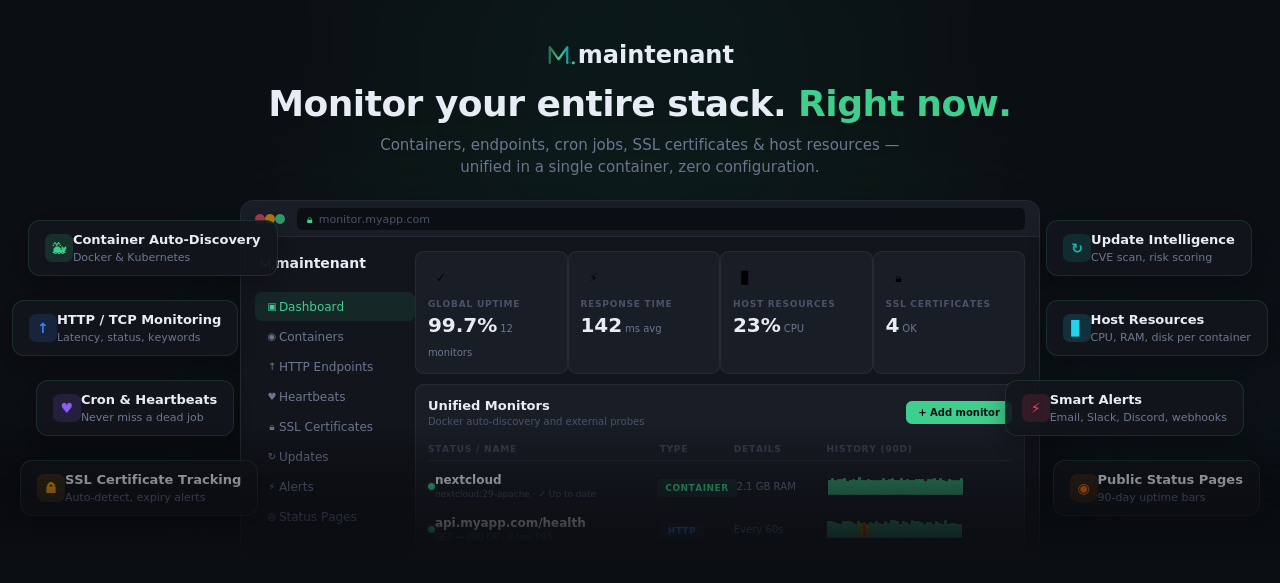
Dashboard: uptime, response times, resources, unified monitors |
|

Unified alerts across every source |

Security posture with CVE enrichment and risk scoring (Personal) |
More screenshots

readme truncated — read the full docs on github Frequently asked questionsIs maintenant free to use?maintenant is open source under the AGPL-3.0 licence. There is no licence fee and no seat count — you can self-host it or, where the project offers one, pay a vendor for a managed version instead. What does maintenant do?Self-hosted monitoring for Docker, Kubernetes and uptime. Single Go binary, no agent config, live alerts. Drop a container, your stack is monitored. What is maintenant written in?maintenant is primarily written in Go. Its source is publicly available at https://github.com/kOlapsis/maintenant, and it has 505 GitHub stars. |