Lighthouse 





Lighthouse analyzes web apps and web pages, collecting modern performance metrics and insights on developer best practices.
- Using Lighthouse
- Associated Products and Projects
- FAQ
Using Lighthouse in Chrome DevTools
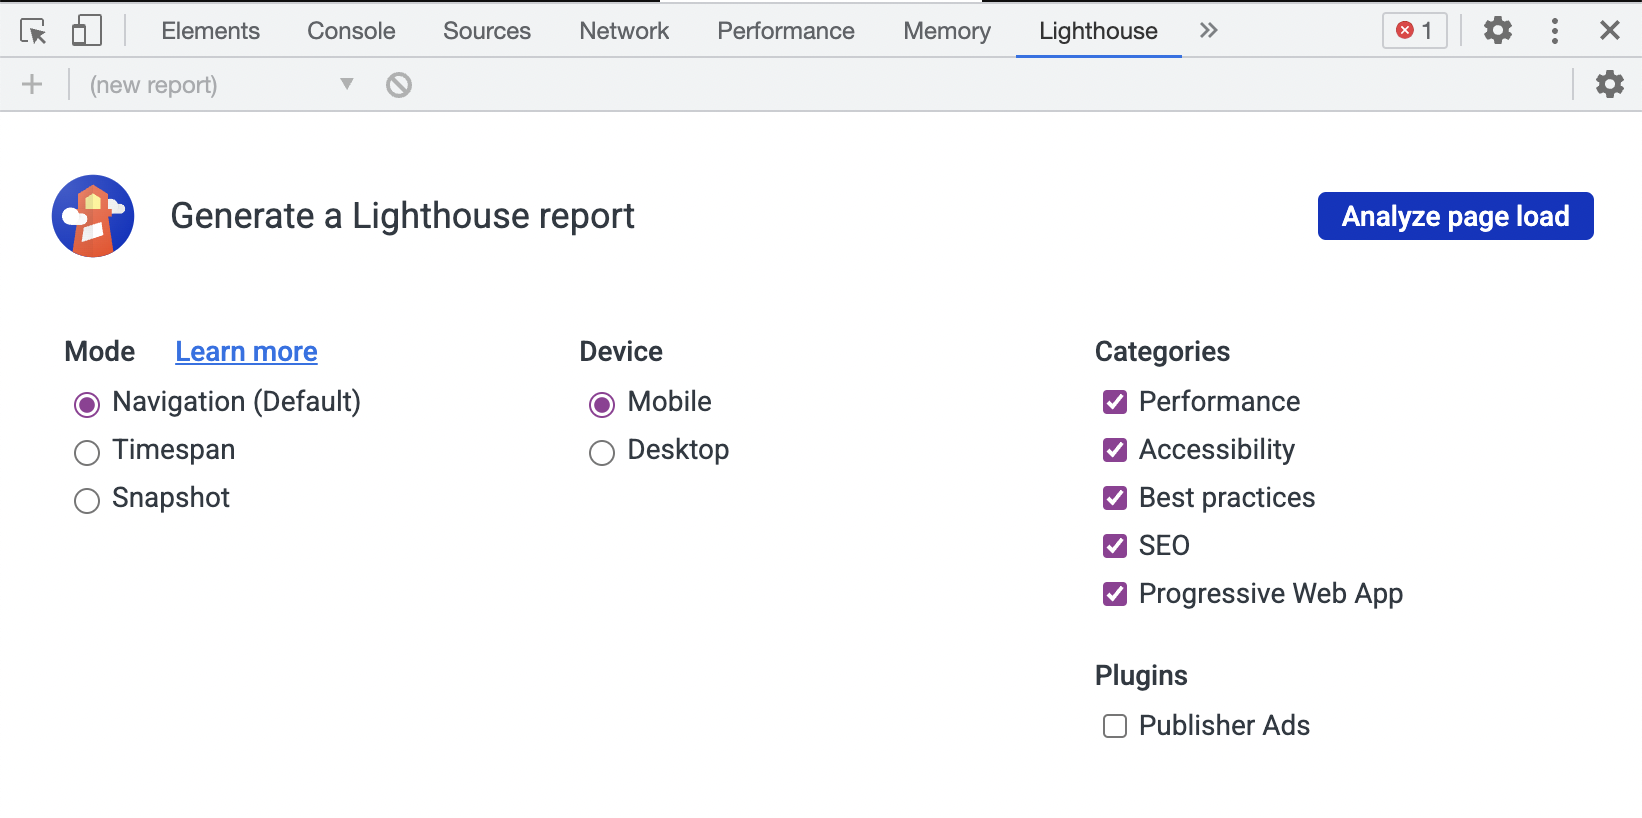
Lighthouse is integrated directly into the Chrome DevTools, under the "Lighthouse" panel.
Installation: install Chrome.
Run it: open Chrome DevTools, select the Lighthouse panel, and hit "Generate report".
Using the Chrome extension
The Chrome extension was available prior to Lighthouse being available in Chrome Developer Tools, and offers similar functionality.
Installation: install the extension from the Chrome Web Store.
Run it: follow the extension quick-start guide.
Using the Node CLI
The Node CLI provides the most flexibility in how Lighthouse runs can be configured and reported. Users who want more advanced usage, or want to run Lighthouse in an automated fashion should use the Node CLI.
[!NOTE] Lighthouse requires Node 22 (LTS) or later.
Installation:
npm install -g lighthouse
# or use yarn:
# yarn global add lighthouse
Run it: lighthouse https://airhorner.com/
By default, Lighthouse writes the report to an HTML file. You can control the output format by passing flags.
CLI options
$ lighthouse --help

lighthouse

Logging:
  --verbose  Displays verbose logging  [boolean] [default: false]
  --quiet    Displays no progress, debug logs, or errors  [boolean] [default: false]

Configuration:
  --save-assets                  Save the trace contents & devtools logs to disk  [boolean] [default: false]
  --list-all-audits              Prints a list of all available audits and exits  [boolean] [default: false]
  --list-trace-categories        Prints a list of all required trace categories and exits  [boolean] [default: false]
  --additional-trace-categories  Additional categories to capture with the trace (comma-delimited).  [string]
  --config-path                  The path to the config JSON.
                                 An example config file: core/config/lr-desktop-config.js  [string]
  --preset                       Use a built-in configuration.
                                 WARNING: If the --config-path flag is provided, this preset will be ignored.  [string] [choices: "perf", "experimental", "desktop"]
  --chrome-flags                 Custom flags to pass to Chrome (space-delimited). For a full list of flags, see https://bit.ly/chrome-flags
                                 Additionally, use the CHROME_PATH environment variable to use a specific Chrome binary. Requires Chromium version 66.0 or later. If omitted, any detected Chrome Canary or Chrome stable will be used.  [string] [default: ""]
  --port                         The port to use for the debugging protocol. Use 0 for a random port  [number] [default: 0]
  --hostname                     The hostname to use for the debugging protocol.  [string] [default: "localhost"]
  --form-factor                  Determines how performance metrics are scored and if mobile-only audits are skipped. For desktop, use --preset=desktop instead.  [string] [choices: "mobile", "desktop"]
  --screenEmulation              Sets screen emulation parameters. See also --preset. Use --screenEmulation.disabled to disable. Otherwise set these 4 parameters individually: --screenEmulation.mobile --screenEmulation.width=360 --screenEmulation.height=640 --screenEmulation.deviceScaleFactor=2
  --emulatedUserAgent            Sets useragent emulation  [string]
  --max-wait-for-load            The timeout (in milliseconds) to wait before the page is considered done loading and the run should continue. WARNING: Very high values can lead to large traces and instability  [number]
  --enable-error-reporting       Enables error reporting, overriding any saved preference. --no-enable-error-reporting will do the opposite. More: https://github.com/GoogleChrome/lighthouse/blob/main/docs/error-reporting.md  [boolean]
  --gather-mode, -G              Collect artifacts from a connected browser and save to disk. (Artifacts folder path may optionally be provided). If audit-mode is not also enabled, the run will quit early.
  --audit-mode, -A               Process saved artifacts from disk. (Artifacts folder path may be provided, otherwise defaults to ./latest-run/)
  --only-audits                  Only run the specified audits  [array]
  --only-categories              Only run the specified categories. Available categories: accessibility, best-practices, performance, seo  [array]
  --skip-audits                  Run everything except these audits  [array]
  --disable-full-page-screenshot Disables collection of the full page screenshot, which can be quite large  [boolean]

Output:
  --output       Reporter for the results, supports multiple values. choices: "json", "html", "csv"  [array] [default: ["html"]]
  --output-path  The file path to output the results. Use 'stdout' to write to stdout.
                   If using JSON output, default is stdout.
                   If using HTML or CSV output, default is a file in the working directory with a name based on the test URL and date.
                   If using multiple outputs, --output-path is appended with the standard extension for each output type. "reports/my-run" -> "reports/my-run.report.html", "reports/my-run.report.json", etc.
                   Example: --output-path=./lighthouse-results.html  [string]
  --view         Open HTML report in your browser  [boolean] [default: false]

Options:
  --version                            Show version number  [boolean]
  --help                               Show help  [boolean]
  --cli-flags-path                     The path to a JSON file that contains the desired CLI flags to apply. Flags specified at the command line will still override the file-based ones.
  --locale                             The locale/language the report should be formatted in
  --blocked-url-patterns               Block any network requests to the specified URL patterns  [array]
  --disable-storage-reset              Disable clearing the browser cache and other storage APIs before a run  [boolean]
  --throttling-m