Lets-Plot is a multiplatform plotting library built on the principles of the Grammar of Graphics, maintained as an official JetBrains open-source project for Python, Kotlin and JVM developers who need composable statistical graphics inside notebooks, IDEs and desktop applications.
What it is
Lets-Plot is a plotting library that follows the Grammar of Graphics, an approach whose design is heavily influenced by Leland Wilkinson's book The Grammar of Graphics. The project describes that grammar as a set of independent components that can be composed in many different ways, so users are not limited to a set of pre-specified graphics but can build new ones precisely tailored to their problem. The library ships under the MIT license, carries the official JetBrains project badge, and lives in the Data & Analytics / Business Intelligence & Reporting category of this registry. Its two main surfaces are a Python package, published on PyPI as lets-plot and documented at lets-plot.org/python, and a Kotlin API, developed in the lets-plot-kotlin repository and documented at lets-plot.org/kotlin.
The concrete problem it solves is the gap between R and other ecosystems for grammar-of-graphics plotting. The README describes the Python package directly as a bridge between R and ggplot2 and Python data visualization, which means Python users get the compositional ggplot2 model without leaving Python. On the Kotlin side it solves the same problem for Kotlin, JVM and Kotlin/JS code, where the library can be embedded into Swing, JavaFX, Compose Multiplatform and browser-facing applications. It also brings interactive plotting into JetBrains IDEs through the "Lets-Plot in SciView" plugin, which adds plotting support to the Scientific mode in PyCharm and IntelliJ IDEA.
Key capabilities
- A Python distribution published on PyPI as
lets-plot, documented at lets-plot.org/python with a gallery at lets-plot.org/python/pages/gallery.html.
- A Kotlin API in the
lets-plot-kotlin repository, covering both notebook and application use.
- A Compose Multiplatform frontend in
lets-plot-compose for embedding charts inside Compose Multiplatform applications.
- Chart embedding in JVM applications built with Swing or JavaFX, and in Kotlin/JS applications.
- Notebook support for Kotlin Notebook, Datalore, and Jupyter with the Kotlin Kernel, plus any other notebook that supports the Kotlin Kernel.
- The "Lets-Plot in SciView" plugin for JetBrains IDEs, published as plugin ID 14379, which adds interactive plotting to Scientific mode in PyCharm and IntelliJ IDEA.
- Geo-spatial plotting, listed among the project's topics alongside
data-visualization and ggplot.
Who uses it and how
- Python data scientists and analysts who want a ggplot2-style grammar of graphics without moving their work into R.
- Kotlin and JVM developers who need statistical charts inside Swing or JavaFX desktop applications rather than a separate reporting tool.
- Compose Multiplatform teams that embed charts directly into a multiplatform UI layer using the
lets-plot-compose frontend.
- Notebook users working in Datalore, Kotlin Notebook, or Jupyter with the Kotlin Kernel, where plots render inside the notebook session.
- PyCharm and IntelliJ IDEA users with Scientific mode enabled, who get interactive plotting through the SciView plugin; the README notes that Scientific mode is not available in community editions of JetBrains IDEs.
Getting started
Python users install the library from PyPI under the package name lets-plot, then follow the documentation at lets-plot.org/python. Kotlin users start from the lets-plot-kotlin repository for notebooks, JVM and Kotlin/JS, or from lets-plot-compose for Compose Multiplatform embedding.
How it compares
The facts name ggplot2 as the closest reference point: the Python package is explicitly positioned as a bridge between R and ggplot2 and Python data visualization, so it targets the same grammar-of-graphics model rather than a different charting paradigm. For Kotlin and JVM work the same model is carried across into Swing, JavaFX, Compose Multiplatform and Kotlin/JS, which is where the project differs from staying inside the R ecosystem.
When to use it — and when not to
Choose it when the Grammar of Graphics approach fits the task and the surrounding code is Python, Kotlin, JVM or Compose Multiplatform. Avoid it if the team works exclusively in community editions of JetBrains IDEs, because the SciView integration depends on Scientific mode, which those editions do not provide. Note also that the project's surface is split across several repositories and documentation sites, and the repository carries a substantial open-issue count, so adopters should expect to work across more than one codebase.
project readme (upstream, from github) — read inline
Lets-Plot



Lets-Plot is a multiplatform plotting library built on the principles of the Grammar of Graphics.
The library design is heavily influenced by Leland Wilkinson's work The Grammar of Graphics describing the deep features that underlie all statistical graphics.
This grammar [...] is made up of a set of independent components that can be composed in many different ways. This makes [it] very powerful because you are not limited to a set of pre-specified graphics, but you can create new graphics that are precisely tailored for your problem.
Grammar of Graphics for Python 
A bridge between R (ggplot2) and Python data visualization.
To learn more, see the documentation site at lets-plot.org/python.
Grammar of Graphics for Kotlin 
Notebooks
Create plots in Kotlin Notebook,
Datalore, Jupyter with Kotlin Kernel
or any other notebook that supports Kotlin Kernel.
To learn more, see the Lets-Plot Kotlin API project at GitHub.
Compose Multiplatform
Embed Lets-Plot charts in Compose Multiplatform applications.
To learn more, see the Lets-Plot Compose Frontend project at GitHub.
JVM and Kotlin/JS
Embed Lets-Plot charts in JVM (Swing, JavaFX) and Kotlin/JS applications.
To learn more, see the Lets-Plot Kotlin API project at GitHub.
Documentation
Kotlin API documentation site: lets-plot.org/kotlin.
"Lets-Plot in SciView" plugin


Scientific mode in PyCharm and in IntelliJ IDEA provides support for interactive scientific computing and data visualization.
Lets-Plot in SciView plugin adds
support for interactive plotting to IntelliJ-based IDEs with the Scientific mode enabled.
Note: The Scientific mode is NOT available in communinty editions of JetBrains IDEs.
Also read:
Recent Updates in the Gallery


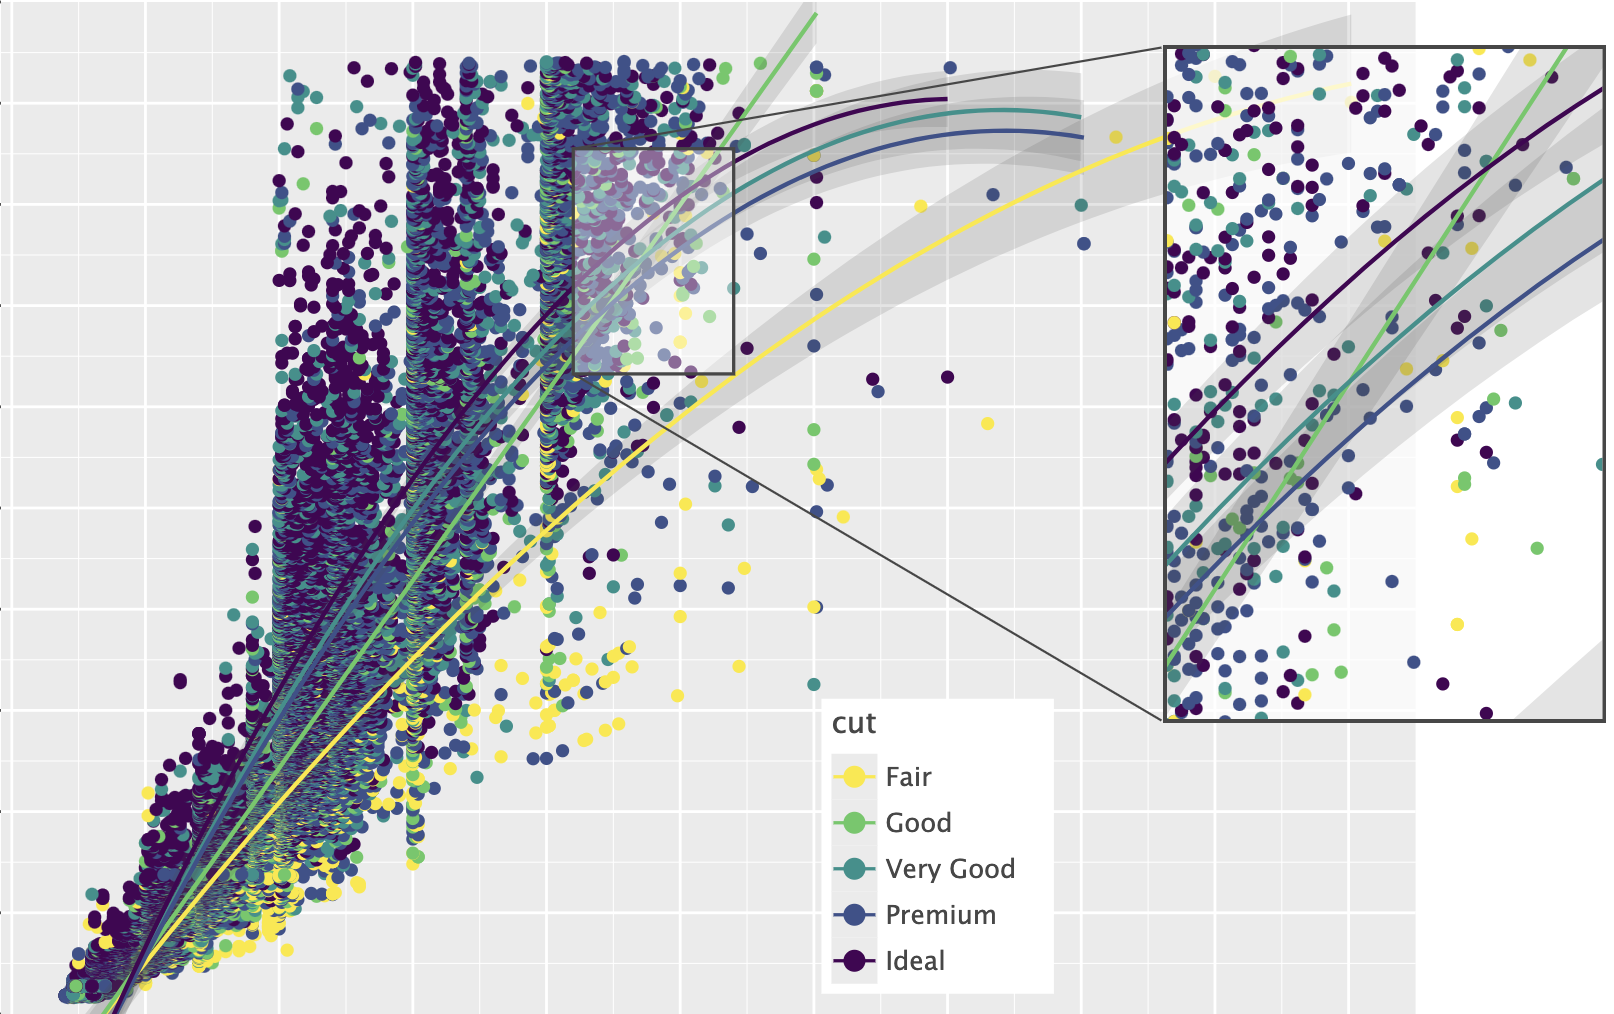
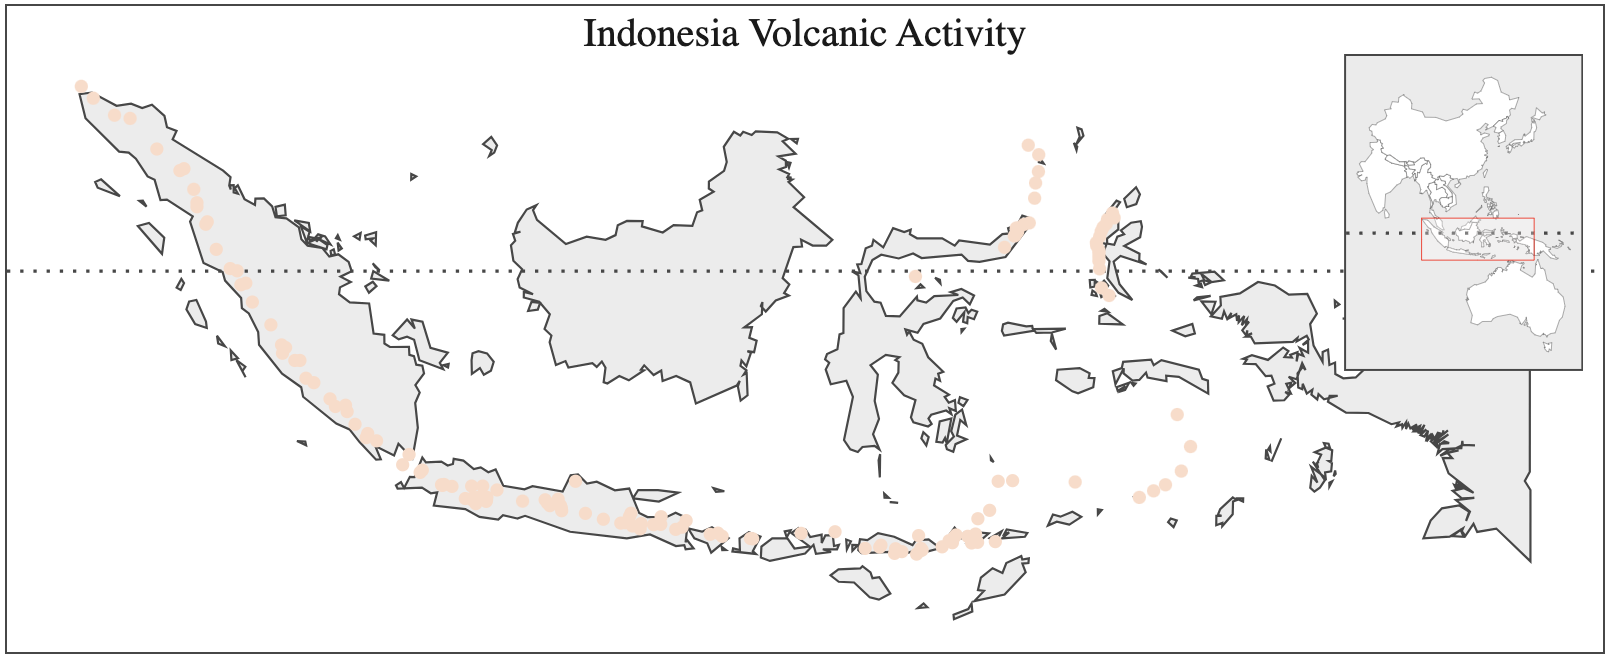


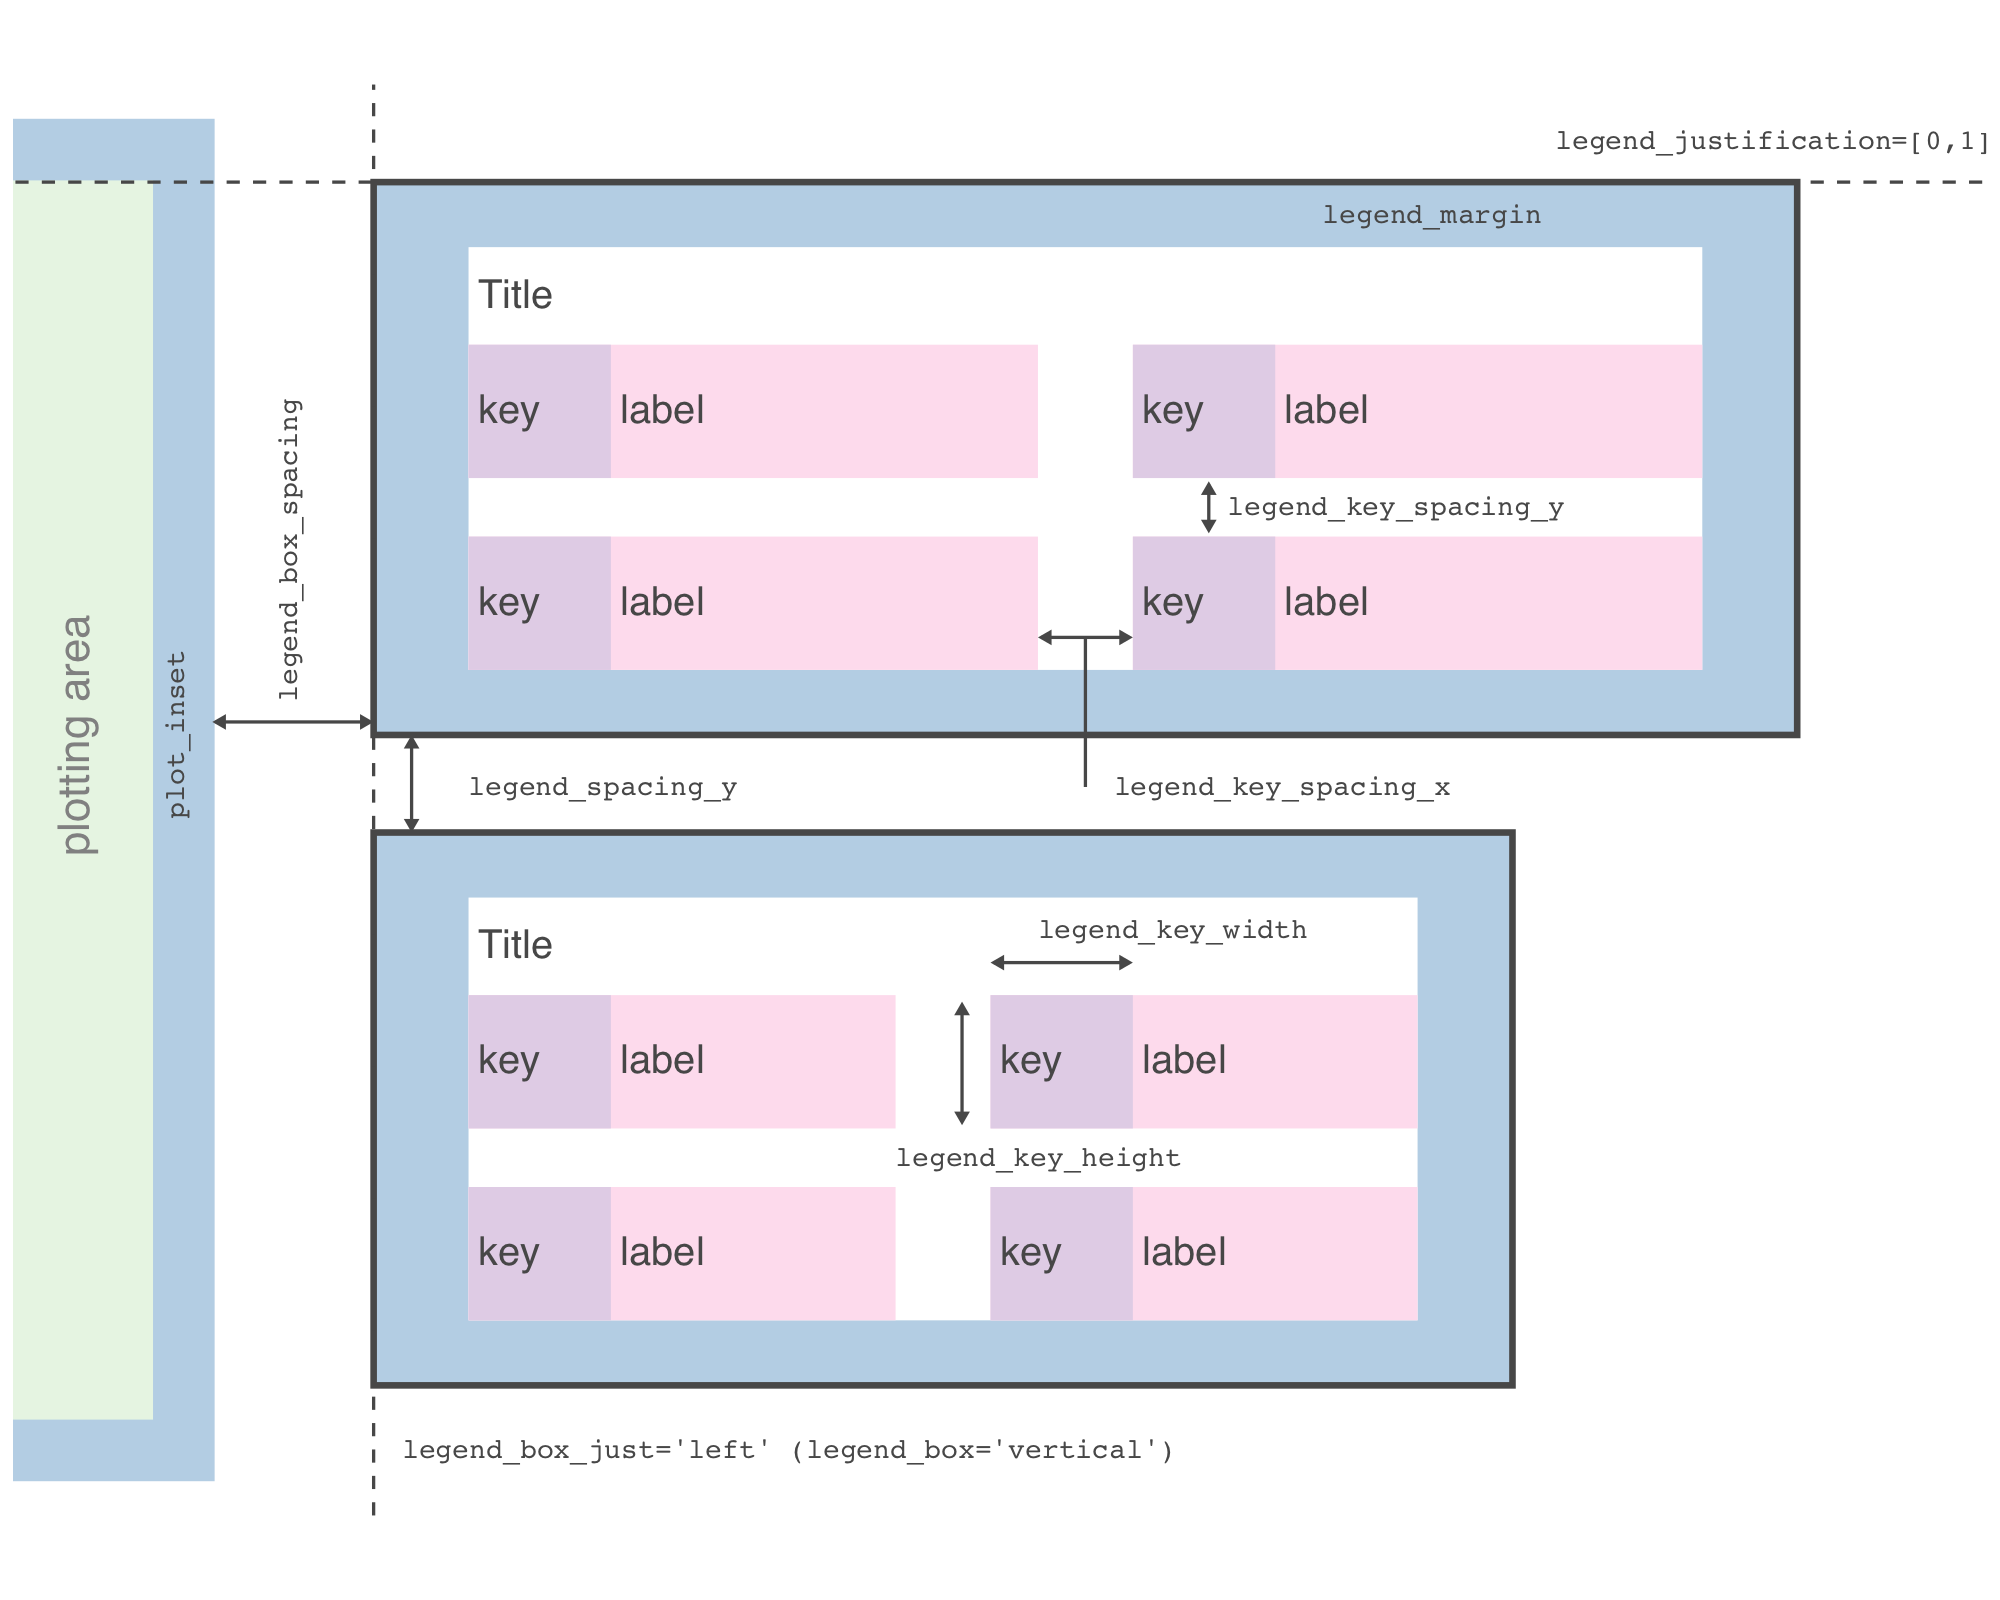
Change Log
CHANGELOG.md
Code of Conduct
This project and the corresponding community are governed by the
JetBrains Open Source and Community Code of Conduct.
Please make sure you read it.
License
Code and documentation released under the MIT license.
Copyright © 2019-2026, JetBrains s.r.o.