ktop is an Apache-2.0 licensed, Go-based terminal tool that shows live metrics for nodes, pods, and containers in a Kubernetes cluster, built for operators and developers who want top-style cluster visibility without installing anything inside the cluster.
What it is
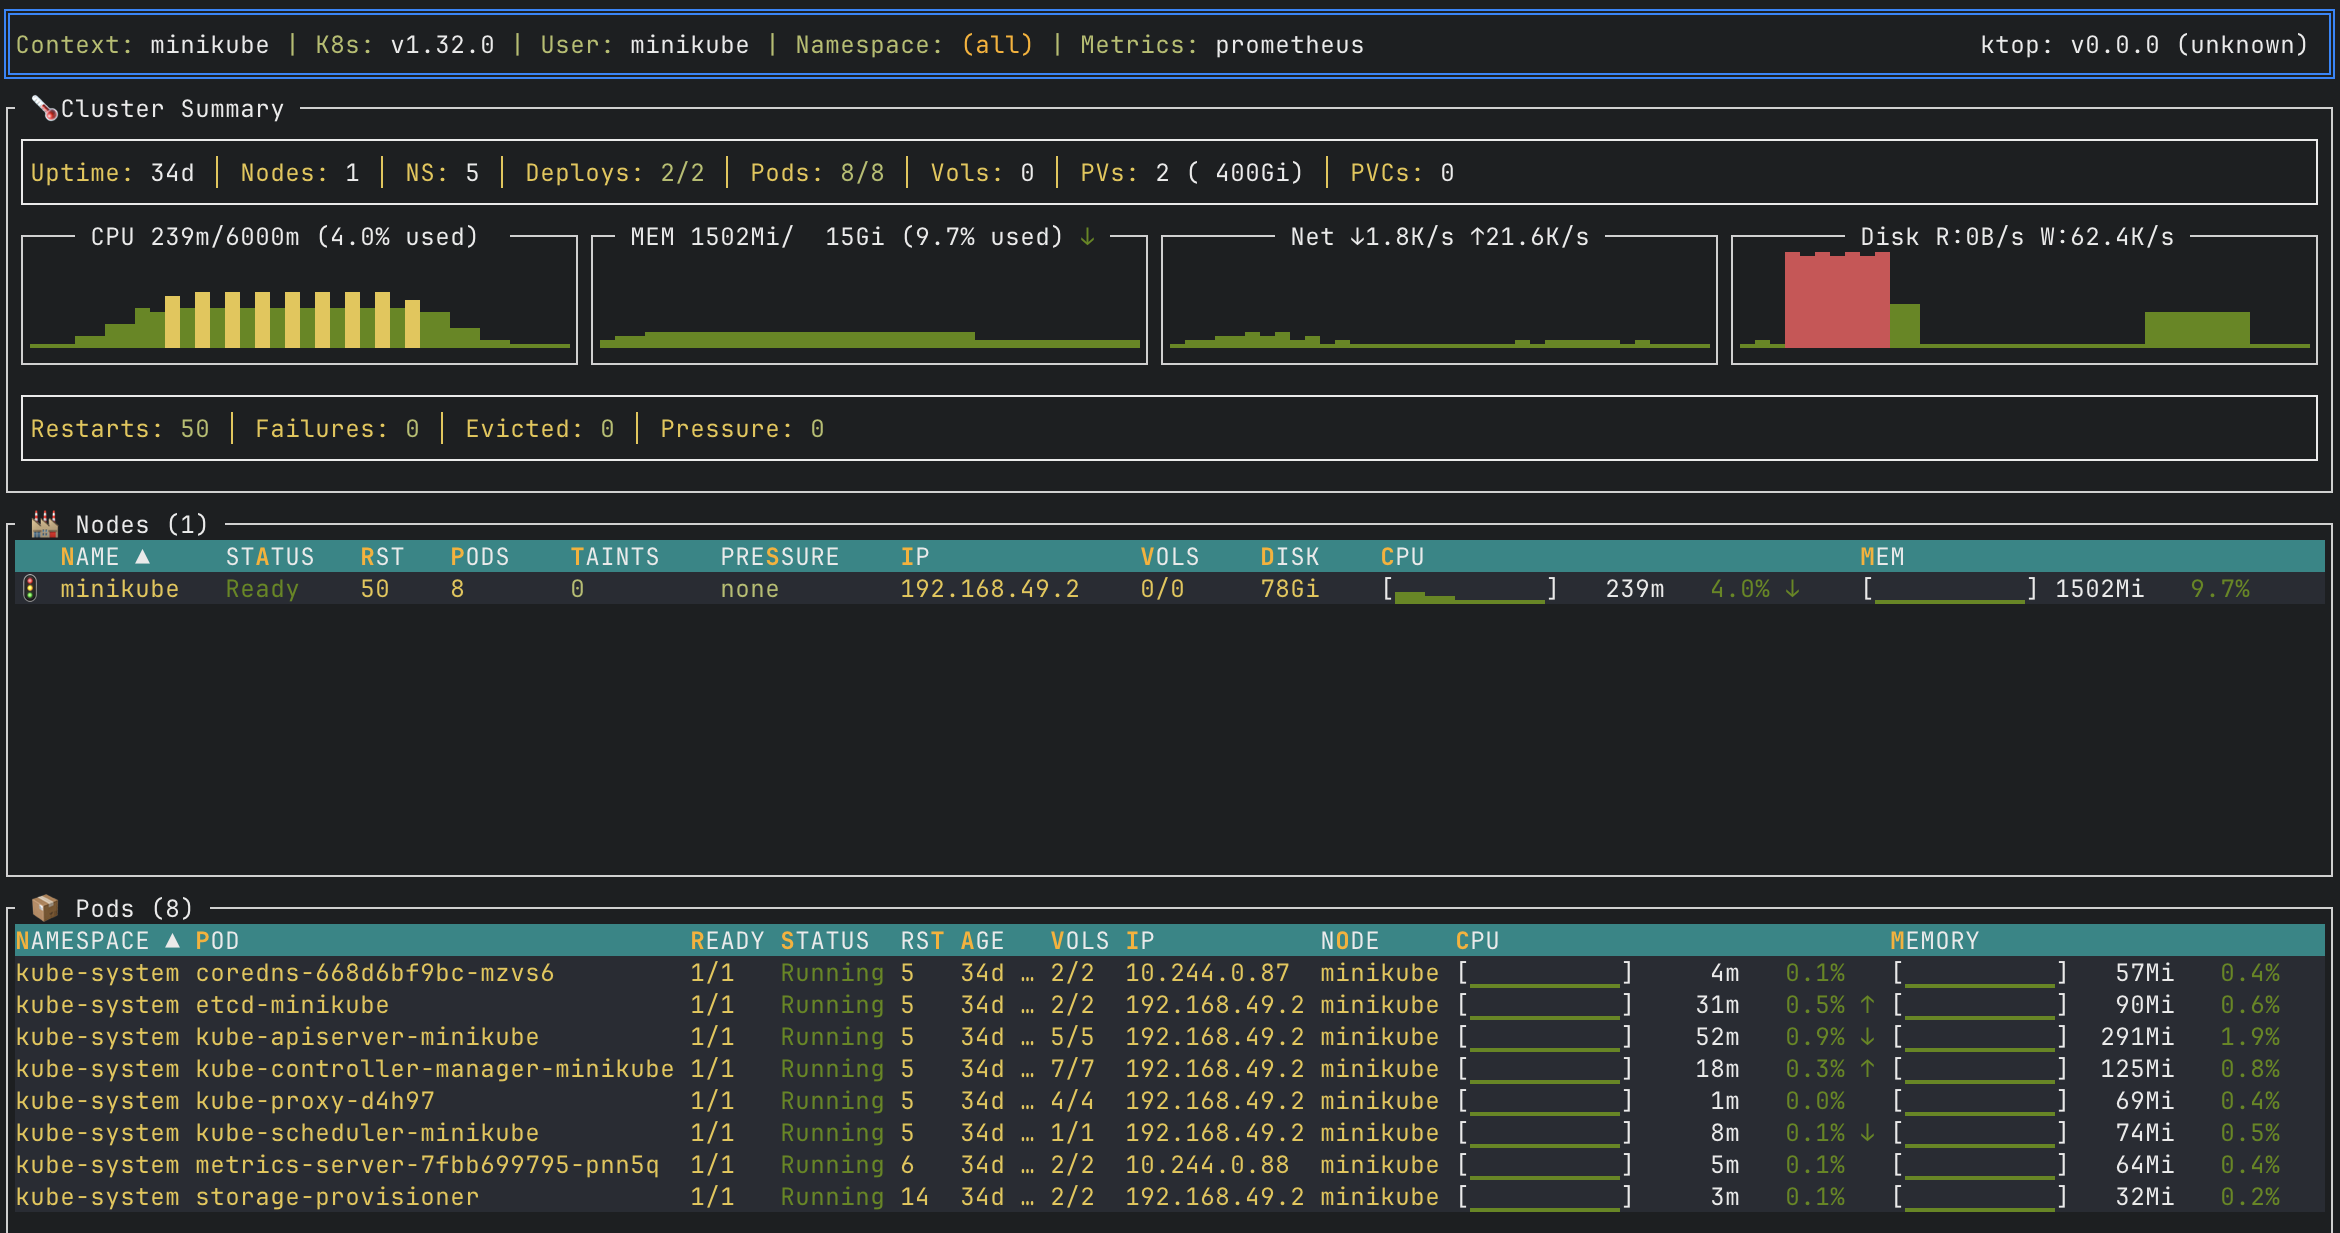
ktop is a single-binary command-line tool that follows the tradition of Unix/Linux top. It displays useful metrics information about nodes, pods, and other workload resources running in a Kubernetes cluster, and it ships as a kubectl plugin, a Homebrew formula, a go install target, and a downloadable binary on GitHub Releases. It lives in the Kubernetes ecosystem, speaks to the cluster through the Kubernetes API using a local kubeconfig, and needs no agents or server-side components.
The concrete problem it solves is the switching cost of reading cluster state. kubectl top returns a single snapshot of node and pod CPU and memory, while kubectl logs streams one container at a time; correlating those outputs across namespaces and contexts means running several commands and holding the results in your head. ktop replaces that with one continuously updated view that drills down from a cluster overview to a node, then to a pod, then to container logs, and it connects anywhere kubectl connects, so no direct node access is required.
Key capabilities
- Real-time monitoring of nodes, pods, and containers in a continuously updated view.
- Drill-down navigation from cluster overview to node to pod to container logs.
- Zero cluster installation: runs locally from a kubeconfig, with no agents or server-side components.
- Works anywhere
kubectl works, because it connects through the Kubernetes API rather than to nodes directly.
- Streaming container logs with filtering, timestamps, line wrap, and a full-screen mode.
- Multiple metrics sources: Prometheus for enhanced metrics via
--metrics-source=prometheus, Metrics-Server, or a no-metrics fallback.
- Graceful degradation that still shows resource requests and limits when no metrics infrastructure is present.
- Context and namespace scoping through
--context my-cluster and --namespace production.
Who uses it and how
- Platform and operations engineers running multi-namespace clusters use
--namespace to scope the view to a single team or application instead of the whole cluster.
- Engineers who work across several clusters use
--context to switch targets without rewriting kubeconfig or re-running discovery commands.
- Teams that already run Prometheus point ktop at it with
--metrics-source=prometheus for richer metrics, while teams without a metrics stack fall back to Metrics-Server or to the requests-and-limits view.
- Debugging workflows benefit from staying in one terminal: a user navigates to a pod and reads streaming container logs with timestamps and filtering rather than opening a second command.
- Managed or sandboxed clusters where node SSH is unavailable remain workable, because the API-only connection needs nothing beyond a valid kubeconfig.
Getting started
Install as a krew plugin with kubectl krew install ktop and run it as kubectl ktop, or use brew tap vladimirvivien/oss-tools followed by brew install ktop. Alternatives are go install github.com/vladimirvivien/ktop@latest or a binary from GitHub Releases.
How it compares
The supplied facts name no other tools in this registry that ktop competes with or replaces, so it stands alone here. Its reference point is the Unix/Linux top family rather than a named peer product, and it is positioned as an extension of the kubectl workflow rather than a replacement for it.
When to use it — and when not to
A self-hoster needs only a valid kubeconfig, taken from $KUBECONFIG or ~/.kube/config, and optionally a Prometheus or Metrics-Server endpoint for richer data. Do not pick ktop if you need retained history, dashboards, or alerting, since it is a live terminal view and the facts describe no persistence layer. Documentation lives mainly on the project website, and the README itself is brief, so expect to consult the external site before advanced use.
project readme (upstream, from github) — read inline
A top-like tool for your Kubernetes cluster.
Following the tradition of Unix/Linux top tools, ktop is a tool that displays useful metrics information about nodes, pods, and other workload resources running in a Kubernetes cluster.
Features
- Real-Time Monitoring - Continuously updated view of nodes, pods, and containers
- Drill-Down Navigation - Explore from cluster overview → node → pod → container logs
- Zero Cluster Installation - Runs locally using your kubeconfig; no agents or server-side components
- Works Anywhere kubectl Works - Connects through the Kubernetes API; no direct node access required
- Streaming Container Logs - Real-time logs with filtering, timestamps, line wrap, and full-screen mode
- Multiple Metrics Sources - Support Prometheus for enhanced metrics, Metrics-Server, or no-metrics as fallback
- Graceful Degradation - Works even without metrics infrastructure by showing resource requests/limits
- Single Binary - Download and run; no dependencies beyond a valid kubeconfig
Installation
kubectl plugin
kubectl krew install ktop
kubectl ktop
Requires krew plugin manager.
Homebrew
brew tap vladimirvivien/oss-tools
brew install ktop
Go install
go install github.com/vladimirvivien/ktop@latest
Binary download
Download from GitHub Releases.
Quick Start
With a valid kubeconfig file ($KUBECONFIG or ~/.kube/config):
# Start ktop with default settings
ktop

# Use a specific context
ktop --context my-cluster

# Filter to a namespace
ktop --namespace production

# Use Prometheus for enhanced metrics
ktop --metrics-source=prometheus
Documentation
See ktop's website for documetation.