JFreeChart
Version 2.0.0, not yet released.


Overview
JFreeChart is a comprehensive free chart library for the Java™ platform that can be used on the client-side (JavaFX and Swing) or the server side, with export to multiple formats including SVG, PNG and PDF.
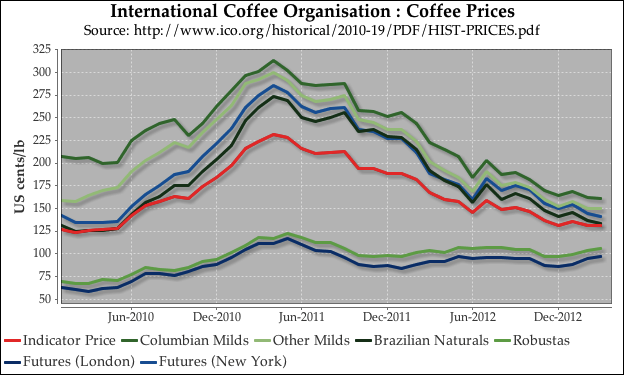
The home page for the project is:
https://www.jfree.org/jfreechart
JFreeChart requires JDK 11 or later. For Java 8 support, check the v1.5.x branch.
The library is licensed under the terms of the GNU Lesser General Public License (LGPL) version 2.1 or later.
JavaFX
JFreeChart can be used with JavaFX via the JFreeChart-FX extensions:
https://github.com/jfree/jfreechart-fx
Demos
A small set of demo applications can be found in the following projects here at GitHub:
A more comprehensive set of demos, plus the JFreeChart Developer Guide, is a reward at most tiers of the JFree sponsorship program. Thanks for supporting the JFree projects!
For Developers
Using JFreeChart
To use JFreeChart in your projects, add the following dependency to your build tool:
    org.jfree
    jfreechart
    1.5.6
Building JFreeChart
You can build JFreeChart using Maven by issuing the following command from the root directory of the project:
mvn clean install
The build requires JDK 11 or later.
Migration
When migrating from JFreeChart 1.0.x to JFreeChart 1.5.0, please be aware of the following API changes:
- all the classes from JCommon that are used by JFreeChart have integrated within the JFreeChart jar file within a different package than before (you will need to change your imports);
- many methods
getBaseXXX()/setBaseXXX()have been renamedsetDefaultXXX()/getDefaultXXX(); - the
ChartUtilitiesclass has been renamedChartUtils; - all the classes relating to pseudo-3D charts have been removed, as much better 3D charts are offered by Orson Charts so we prefer not to maintain the pseudo-3D chart code within JFreeChart;
- the
SegmentedTimelineclass has been removed due to being (a) complex, (b) not always being correct and, as a result, generating too many support requests; - the
org.jfree.chart.utils.ParamChecksclass has been renamedorg.jfree.chart.utils.Args.
Please refer to Issue 66 for additional info.
History
Version 2.0 (not yet released)
- add padding for
Crosshairlabel (#414) - add tests for
EncoderUtil(#378) - use
ThreadLocalfor calendars in time series datasets (#171); - added
valueVisibleflag toMeterPlot(#231); - modify buffer in
ChartPanelto handle high DPI displays (#170); - add options to control pan vs zoom in
ChartPanel(#172); - observe series visibility flags in
ClusteredXYBarRenderer(#89); - observe axis visibility flag in
PeriodAxis(#198); - fix for exception on extreme zoom on
NumberAxis(bug #64); - fix tick label font for
LogAxiswith number format override (#98); - remove alpha channel from copy-to-clipboard (fixes bug #182);
- apply rendering hints to overlays - fixes bug #187;
- modify
TextTitleto throwIllegalArgumentExceptionrather thanNullPointerException(#205); - fix bugs on crosshair labels (#189, #194);
- removed
ObjectUtilsclass (#163); - removed unused
URLUtilitiesclass (#162) - fixed
LayeredBarRenderer(bugs #169 and #175); - minor fix for
DefaultPieDataset(bugs #212) - fix
isJFreeSVGAvailable()method (bugs #207) - add new methods to access maps for datasets, renderers and axes in plots (#201);
- update French translations (bug #186);
- fix "Save_as" entries in localisation files (bug #184);
- add flags for visibility of outliers in
BoxAndWhiskerRenderer(#79); - added generics;
DefaultIntervalCategoryDatasetno longer allows null keys in constructor (this is a consequence of introducing generics);- update required JDK to version 11.
Version 1.5.0 (5 November 2017)
- all JavaFX classes moved to a separate project;
- added cleaner method to create histograms in
ChartFactory; - JCommon removed as a dependency, and required classes incorporated directly (including package rename);
- pull request #4 improvements to
XYStepRenderer; - bug #36 fix for crosshairs with multiple datasets / axes;
- bug #25 fix for
DateAxis.previousStandardDate()method; - bug #19 fix for default time zone in
SegmentedDateAxis; - SourceForge #1147 improve performance of
CategoryPlotmapping datasets to axes; - moved SWT code out into separate projects;
- moved demo programs to a separate project;
- dropped the Ant build;
Version 1.0.19 (31-Jul-2014)
- fixed clipping issues for combined plots in JavaFX;
- fixed a memory leak in the new JavaFX
ChartCanvasclass; CombinedDomainXYPlotandCombinedRangeXYPlotnow take into account the pannable flags in the subplots;FastScatterPlotpanning direction is corrected;- added rendering hints to sharpen gridlines and borders in most output formats;
- JFreeSVG updated to version 2.0;
- included a preview of JSFreeChart, a 2D chart library written in JavaScript that is conceptually similar to JFreeChart but runs directly in a web browser.
Version 1.0.18 (3-Jul-2014)
- added JavaFX support via
FXGraphics2D; - improved
LogAxislabelling; - improved numeric tick labelling;
- center text support in
RingPlot; stepPointattribute in theXYStepAreaRenderer;- other minor improvements and bug fixes.
Version 1.0.17 (22-Nov-2013)
- Enhanced
XYSplineRendererwith new area fill (contributed by Klaus Rheinwald); - added a notify flag to all datasets that extend
AbstractDataset; - extended
TimeSeriesCollectionto validateTimeSerieskeys for uniqueness; - added a new
DirectionalGradientPaintTransformer(by Peter Kolb); - updated
OHLCSeries; - added
HMSNumberFormat; - updated JCommon to version 1.0.21 (includes rotated text improvements) and fixed some minor bugs.
Bug Fixes
- 977 : Multithreading issue with
DateAxis; - 1084 :
BorderArrangement.add()possibleClassCastException; - 1099 :
XYSeriesCollection.removeSeries(int)does not deregister listener; - 1109 :
WaterfallBarRendereruses wrong color for diff 0.
Version 1.0.16 (13-Sep-2013)
*** THIS RELEASE REQUIRES JDK/JRE 1.6.0 OR LATER. ***
- Provided subscript/superscript support for axis labels (via
AttributedString); - new axis label positioning options;
- simplified
ChartFactorymethods; - added new methods to
DatasetUtilitiesto interpolate y-values inXYDatasets; - added URLs to labels on
CategoryAxis; - seamless integration with JFreeSVG (https://www.jfree.org/jfreesvg/) and OrsonPDF (http://www.object-refinery.com/pdf/);
- improved the consistency of the
SWTGraphics2Dimplementation;
All the JUnit tests have been upgraded to JUnit 4.
Bug Fixes
- 1107 : Fixed TimeZone issue in
PeriodAxis;
Also fixed a line drawing issue with the StackedXYAreaRenderer, and a memory
leak in the SWT ChartComposite class.
Version 1.0.15 (4-Jul-2013)
- Added support for non-visible series in
XYBarRenderer; - minor gridlines in
PolarPlot; - legend item ordering;
- chart editor enhancements;
- updates to
StandardDialScale; - localisation files for Japanese;
- refactored parame