

"To deal with hyper-planes in a 14 dimensional space, visualize a 3D space and say 'fourteen' very loudly. Everyone does it." - Geoff Hinton
Overview
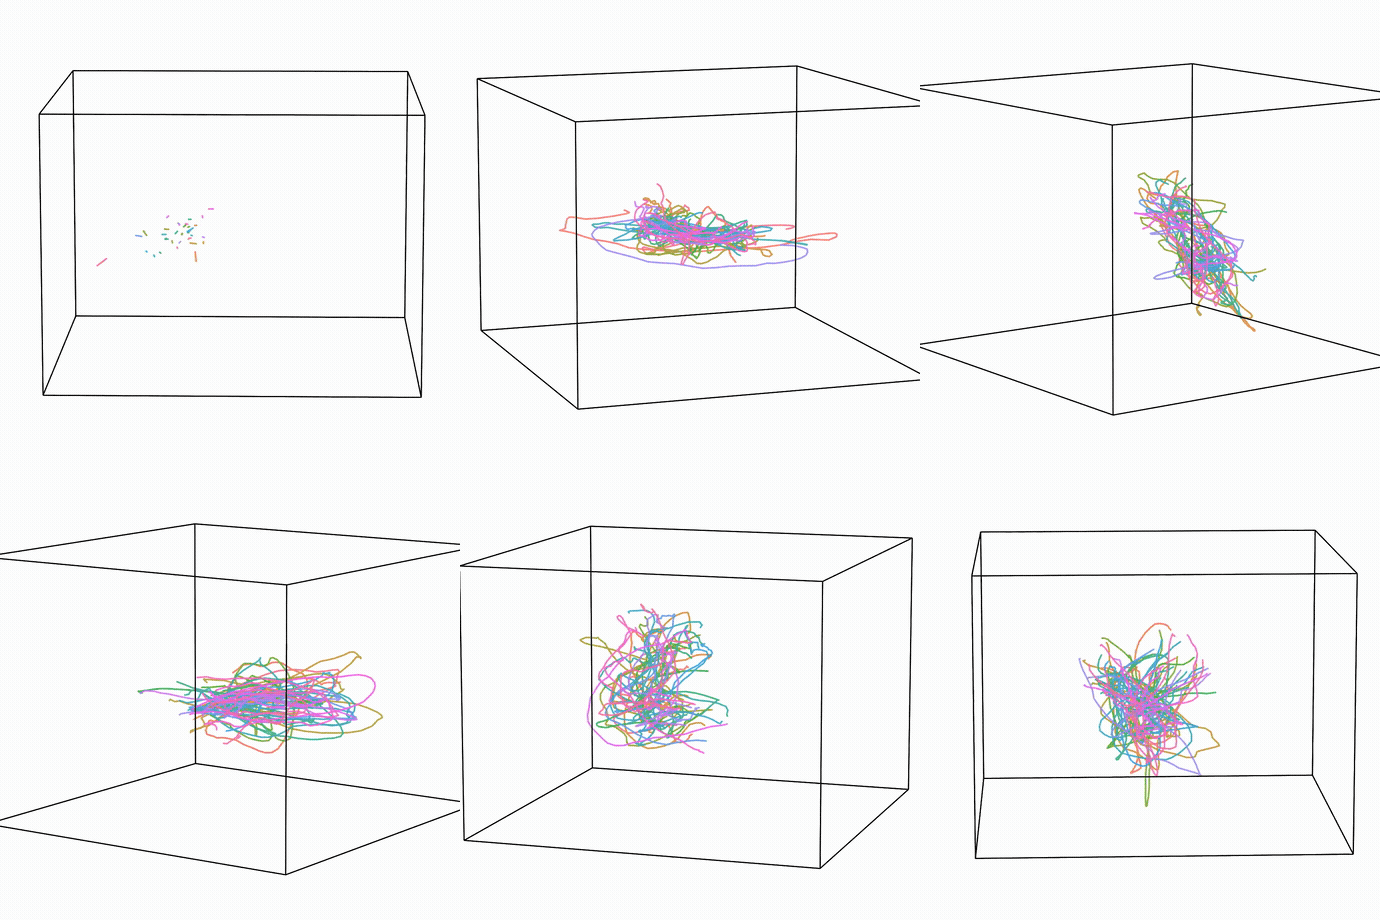
HyperTools is designed to facilitate dimensionality reduction-based visual explorations of high-dimensional data. The basic pipeline is to feed in a high-dimensional dataset (or a series of high-dimensional datasets) and, in a single function call, reduce the dimensionality of the dataset(s) and create a plot. The package is built atop many familiar friends, including matplotlib, scikit-learn and seaborn. Our package was featured in 2017 on Kaggle's now-retired "No Free Hunch" blog (archived copy). For a general overview, you may find this talk useful (given as part of the MIND Summer School at Dartmouth).
What's new in 1.1
HyperTools 1.1 makes hierarchical (MultiIndex) DataFrames a first-class
input, grows the animation API, installs optional extras on demand, and folds
into the library the code its own examples used to write by hand:
- One call, many panels:
hyp.plot([a, b, c], panels=True, title=[...])draws one panel per dataset (orreduce=['PCA', 'UMAP']one per reducer) with a shared or independent pipeline fit. - Data in one line:
hyp.load('random_walk' | 'helix' | 'lorenz' | 'blobs' | ...)generates seeded example data;hyp.load('wikipedia:'),hyp.load('yahoo:', start=, end=)andhyp.load('sec:')fetch live text and market data;cache=True/offline=Truekeep URL downloads on disk. - Forecast comparisons:
hyp.predict(x, model=['Kalman', 'ARIMA', 'GP'], holdout=30)scores every model against a naive baseline;hyp.plot(x, predict=[...], truth=held_out)overlays them with the actual continuation. - Helpers for the data you feed in:
hyp.text_windows(sliding text windows),hyp.damage(reproducible missing data),hyp.stack(hierarchical frames),Smooth(center=False)(trailing means), theDelayembedding, andhyp.align(..., return_score=True). - Animations that know where they are:
ctx.progressand populated reveal counts inon_framecallbacks, titles from a callable or a'{index:%B %Y}'date pattern,dataset_fade=,companion=panels,loop=Truemorphs, andtitle_kwargs=/title_wrap=styling.
See the changelog for the complete list, and the optional dependencies guide for how extras install themselves.
What's new in 1.0
HyperTools 1.0 modernizes the toolbox while keeping the familiar API:
- Interactive plotting (optional):
hyp.plot(..., backend='plotly')renders interactive figures. With the defaultbackend='auto', HyperTools automatically uses plotly on Google Colab and Kaggle (where interactive figures work best and plotly is preinstalled) and matplotlib everywhere else — existing workflows are unchanged. The two backends produce visually matched output: identical colors, line/marker styles and sizes, format strings, and the signature cube/square framing. - Multicolored lines: passing continuous values (or a per-observation
matrix) as
huetogether with a line format colors each trajectory continuously along its length, on both backends. hyp.apply_model: a unified stack → fit-once → unstack core for applying any scikit-learn style model (or pipeline of models) across one or more datasets, withreturn_model=Truefor reuse on held-out data.- Mixture-model ("soft") clustering:
clusterandplotsupportGaussianMixture,BayesianGaussianMixture,LatentDirichletAllocation, andNMF.hyp.clusterreturns per-observation membership proportions, andhyp.plotcolors each observation by blending component colors according to its mixture weights. - Richer coloring: the
hueargument now accepts categorical labels, continuous values, or entire matrices (e.g. mixture proportions or model weights), which are mapped to colors via the newmat2colorshelper (from hypertools.plot.colors import mat2colors). - Nested-list input:
hyp.plot([[a, b], [c]])colors datasets by their outermost grouping and renders more deeply nested datasets with thinner, fainter lines. - Hull surfaces (optional):
hyp.plot(..., surface=True)overlays a smooth, lit surface over each dataset's convex hull — a filled outline in 2D, or a shaded, Taubin-smoothed "blob" in 3D. A dict of scalar options (e.g.surface={'alpha': 0.6}) customizes all surfaces at once; a list of bools/dicts (e.g.surface=[{'alpha': 0.2}, {'alpha': 0.8}]) controls alpha/color/lighting/smoothing per dataset. - Morph animation:
hyp.plot(datasets, animate='morph')treats each dataset as a point cloud and morphs smoothly between them (Hungarian- matched, smoothstep-eased), holding on each one along the way;rotationsaccepts a per-segment list for independent camera control over each hold and transition, andsurface=Truecomposes with it to morph a lit hull instead of raw points. Seeexamples/animate_morph_zoo.pyandexamples/animate_surface_morph.py. - More animation styles, and 2-D animation: in addition to
True/'parallel',animate='spin'keeps all the data drawn and spins the camera,'serial'reveals each dataset one at a time in list order, and'window'(hyp.plot(traj, animate='window', focused=2)) slides a fixed- length, fully-opaque window along each trajectory. Every style except'spin'(which is inherently a 3-D camera move) now also works forndims=2data, using a fixed (non-rotating) viewport. hyp.Pipeline: a scikit-learn-stylePipelinechainsmanip/normalize/reduce/align/clusterstages, fit once and reused on new data without refitting --hyp.plot(A, ..., return_model=True)returns a bundle whose'pipeline'entry can be passed back in ashyp.plot(B, pipeline=bundle['pipeline'])to apply the exact same fitted transformation to a structurally-identical datasetB.hyp.manipand manip chaining:hyp.manip(data, model='ZScore')applies a manipulation (Normalize,ZScore,Smooth,Resample) to each dataset.SmoothandResamplerun independently per dataset (kernels never cross dataset boundaries);ZScoreandNormalizealso transform each dataset separately but fit one shared set of statistics across all datasets in a list (likenormalize='across'). Alistof specs chains several manipulations as aPipeline, andhyp.plot(data, manip=[...])runs the chain at the canonicalmanipstage -- first, beforenormalize/reduce/align/cluster-- e.g.hyp.plot(data, manip=[{'model': 'Smooth', 'kwargs': {'kernel_width': 5}}, 'ZScore'], reduce='PCA').- Autoencoder reducers (optional):
hyp.reduce/hyp.plot(..., reduce= 'Autoencoder')supports six torch-backed autoencoder reducers (Autoencoder,DeepAutoencoder,SparseAutoencoder,ConvolutionalAutoencoder,SequenceAutoencoder,VariationalAutoencoder), from the[torch]extra (installed on demand the first time one is fit). - gensim text vectorizers/semantic models (optional):
hyp.plot(texts, vectorizer='Word2Vec', semantic=None, reduce='PCA')(andhyp.tools.text2mat) addWord2Vec/Doc2Vec/FastTextvectorizers andLdaModel/LsiModel/HdpModelsemantic models, from the[gensim]extra (installed on demand) -- with an embedding vectorizer (gensim, or a Hugging Face model id like'all-MiniLM-L6-v2') the default LDA semantic stage is skipped automatically (gensim warns; passsemantic=Noneto silence it) andcorpusis unused. Note that non-default vectorizers train on the defaultcorpus='wiki'corpus the first time, which can take a couple of minutes even for tiny inputs; pas