The open standard for Home Assistant instance health monitoring.



Abstract
As Home Assistant matures into a mission-critical Smart Home OS, the need for a unified stability metric becomes paramount. HAGHS is a fully local, open-scoring framework designed to provide an objective Health Score (0-100). It differentiates between transient hardware load and chronic maintenance neglect, providing users with a "North Star" for instance optimization. All scoring logic is fully visible in the codebase, no hidden penalties, no black boxes.
Mission
- Short-term: Establish HAGHS as the community standard for Home Assistant instance health monitoring.
- Long-term: Propose HAGHS as a native HA Core feature, bringing unified health scoring to every Home Assistant installation by default. With user consent, HAGHS metrics should help the Home Assistant project understand how the software is being used and how healthy instances are across the ecosystem.
Featured In
- How-To Geek - "This tool gave my Home Assistant server a rating (and told me how to improve it)"
- XDA Developers - "This tool graded my Home Assistant server and told me how to make it better"
- SmartHütte Podcast - Episode 30, at 0:48 (German)
- HomeTech.fm Podcast - Episode 569, at 1:01:16 (English)
- Simon42 Youtube Video - Interview with D-N91, creator of HAGHS (German)
- Tristans Smartes Heim Youtube Video - Clean up your Home Assistant (German)
Table of Contents
- The HAGHS Standard
- Pillar 1: Hardware Performance (40%)
- Pillar 2: Application Hygiene (60%)
- Configuration
- Label Configuration
- Sensor Attributes
- Roadmap
- UI Integration
- FAQ
- Changelog
Detailed documentation
- Configuration and labels: every option, external databases, ignore labels, dynamic exclusions, pattern-based ignore, stale reporting
- Scoring: every component, threshold, penalty and cap of both pillars
- Sensor attributes: every attribute with type and meaning
- Dashboard cards: installation, entity ID, Lite vs. Pro
- FAQ: every question with its full answer
- Release summaries: one summary per release
The HAGHS Standard
The index is calculated via a weighted average of two core pillars, prioritizing long-term software hygiene over temporary hardware fluctuations.
The Global Formula
$$Score_{Global} = \lfloor (Score_{Hardware} \cdot 0.4) + (Score_{Application} \cdot 0.6) \rfloor$$
Note: We use Floor Rounding (Integer) to ensure a "Perfect 100" is only achieved by truly optimized systems. A penalty drops the score below 100 unless the Config-Audit bonus offsets it in the application pillar; zombies, open repairs and overdue watched entities always cap the application score at 99.
Pillar 1: Hardware Performance (40%)
Short version. Every threshold, tier table and the component rules are in docs/scoring.md.
The hardware score is the average of the measured components: CPU, RAM, I/O (when the kernel provides it) and Disk.
- Metric source: HAGHS reads Pressure Stall Information (PSI) from the Linux kernel where available and falls back to the CPU and RAM sensors you select. PSI measures stall time, classic sensors measure utilization, so each source has its own threshold tiers.
- Storage: disk usage is detected automatically, with thresholds per storage type (SD card and eMMC by free GB, SSD by free percent).
- Power: a reported Raspberry Pi under-voltage costs a flat 20 points.
Pillar 2: Application Hygiene (60%)
Short version. Every rule, cap and exception is in docs/scoring.md.
Measures "maintenance debt". Every missing point prints a recommendation line and sets a matching rec_* flag.
| Factor | Points | Rule |
|---|---|---|
| Zombie entities | up to −20, caps at 99 | Entities unavailable or unknown past the grace period (5 min, battery 60 min), scaled by their share. An availability signal, not a deletion list. |
| Updates and Core age | −5 per update, −20 Core lag, at most −35 | An update counts after HAGHS has seen that version pending for 7 days, also across restarts. |
| Integration health | −5 per entry, at most −15 | Config entries stuck in setup error, setup retry or failed unload. |
| Repairs | −5 each, at most −10, caps at 99 | Open repairs of other integrations; Home Assistant's "Ignore" takes one out. |
| Watched entities | −5 each, at most −10, caps at 99 | Opt-in: entities labelled directly with a stale watch label that have not reported for longer than the stale threshold (default 24 h). |
| Database | −10, or −30 | Above 1000 MB + 2.5 MB × entities, or above 2.5 times that limit. |
| Backup | −30 | Stale backup: binary_sensor.backups_stale of the Google Drive Backup add-on is on. Without the add-on no backup check. |
| Config audit | up to +10 | Recorder keeps at most 10 days (+5); user-set entity filter (+5). |
| Dead and empty devices | none | Informational: devices whose monitored entities are all unavailable, or that have no entity. |
Configuration
Short version. Every option, the integration-entry exclusion and the external database setup are in docs/configuration.md.
HAGHS is installed via the Marketplace (Home Assistant 2026.11 and later) or HACS (up to 2026.10) and configured via the UI.
1. Prerequisites
Where the Linux kernel provides PSI, nothing is needed. Otherwise add the built-in System Monitor integration and enable its processor and memory usage entities (disabled by default). Database size and disk usage are detected automatically.
2. Installation & Setup
- Home Assistant 2026.11 and later: open Settings > Marketplace, search for HAGHS and select Install; the setup opens right away, no restart needed (continue with step 3). Up to 2026.10: download HAGHS in HACS and Restart Home Assistant.
- Go to Settings > Devices & Services > Integrations > Add Integration and search for HAGHS.
- Follow the setup mask: CPU and RAM sensors (only used without PSI), storage type, ignore labels and patterns, optionally a database size sensor for an external database.
Change any of it later in Settings > Devices & Services > Integrations > HAGHS > Configure; changes apply immediately, no restart required.
Label Configuration (Smart Whitelisting)
Short version. Label tips, conditional ignore labels, automations, pattern-based ignore and stale reporting are in docs/configuration.md.
Three ways keep an entity out of the score:
- Disable the entity; disabled entities never count.
- Apply an ignore label to an area, device, entity or update entity. The
haghs_ignorelabel is created during setup; list further labels in HAGHS > Configure > Ignore labels. - Use a glob pattern for entities without a unique ID, which cannot carry a label.
Sensor Attributes
Short version. The full list of all attributes with types and meaning is in docs/attributes.md.
The most used attributes for dashboard cards, automations, and templates:
| Attribute | Type | Description |
|---|---|---|
hardware_score |
int | Hardware pillar score (0–100). |
application_score |
int | Application pillar score (0–100). |
recommendations |
string | Advisor lines naming what costs points or needs a look, or a healthy message. |
zombie_count |
int | Total number of zombie entities. |
zombie_entities |
list | Entity IDs of zombies, at most 100. |
zombie_reasons |
dict | Why each listed zombie is reported; only config_entry_missing strongly points to an orphaned entity. |
pending_updates |
list | Names of pending updates, listed at once and counted after 7 days. |
repair_count |
int | Number of open repair issues counted toward the score. |
integration_unhealthy_count |
int | Number of config entries stuck in setup error, setup retry or failed unload. |
db_size_mb |
float | Current database size in MB. |
psi_available |
bool | True when PSI provides both CPU and memory data. |
cpu_ram_source |
str/null | Where CPU and RAM come from: psi, sensors, partial or none. |
stale_watch_count |
int | Number of overdue watched entities. |
Roadmap
Planned features, declined items, and completed milestones live in ROADMAP.md. The roadmap follows the HAGHS philosophy: local-only, system-health focus, HA Core compatibility.
UI Integration
Short version. Installation, entity ID and the Lite vs. Pro comparison are in docs/cards.md.
HAGHS provides all data as sensor attributes; two ready-to-use dashboard cards show them. Both are wired to sensor.system_ha_global_health_score.
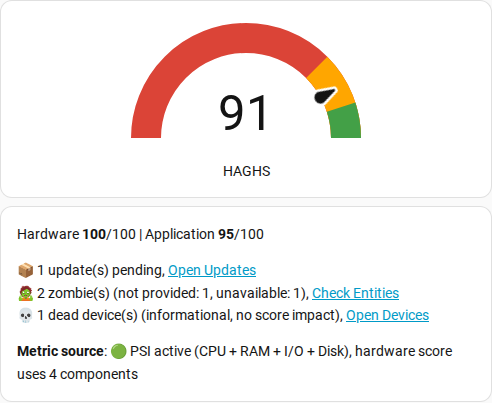
HAGHS Lite v1.4 (Quick Check): a compact card for a fast overview, score, sub-scores, and actionable links. Configuration: docs/cards/lite.yaml.
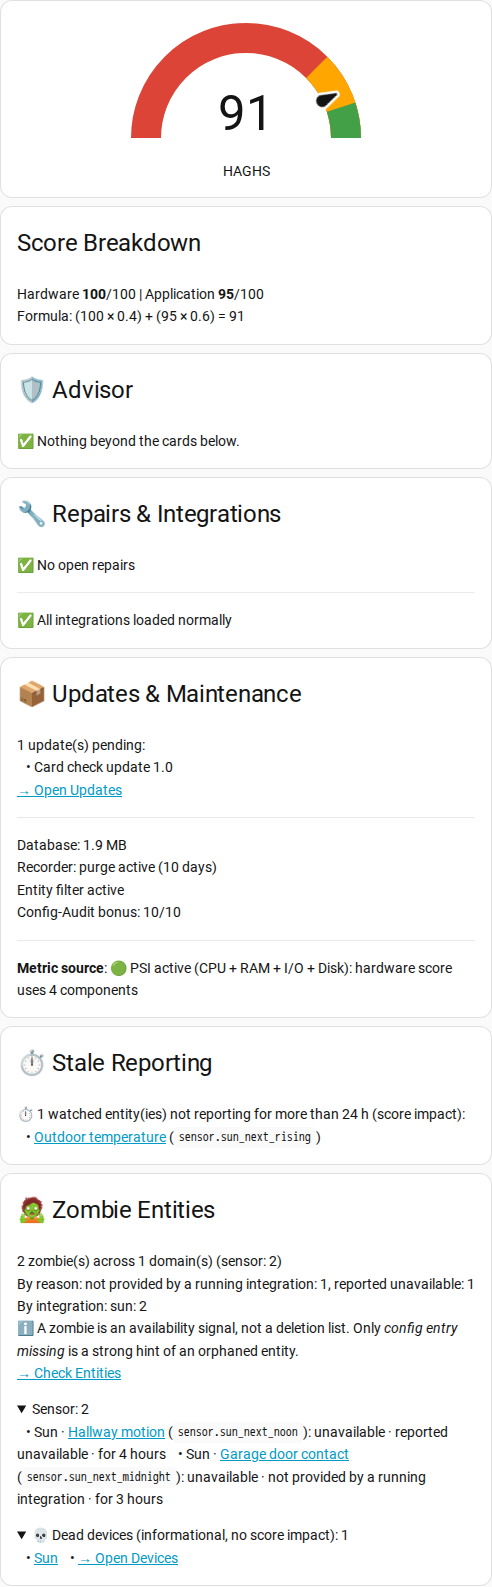
HAGHS Pro v1.4 (Command Center): a comprehensive dashboard with full score breakdown, grouped zombies, database monitoring, recorder health, and deep-links. Configuration: docs/cards/pro.yaml.
FAQ
Short version. All questions and full answers are in docs/faq.md.
Why is my score so low? Check the Advisor recommendations in the dashboard card. They tell you exactly where penalties come from (e.g., "5 update(s) pending", "Stale backup detected").
Can I delete all zombie entities?
No, not without checking them. A zombie only means that the entity has been unavailable or unknown for longer than the grace period. Check its integration, device and config entry first; zombie_reasons tells you why each one is listed.
Why did my score change after an update?
The release summaries list the behavior changes per release. The recommendations and rec_* flags show which factors cost points right now.
Does HAGHS send any data to external servers? No. All data collection is strictly local. No outbound network traffic is ever initiated by this integration.
How does PSI work and why does HAGHS use it? PSI (Pressure Stall Information) is a Linux kernel feature that measures how long tasks wait for CPU, memory, or I/O, rather than how busy a resource is. HAGHS uses it where available and falls back to classic utilization sensors otherwise.
Changelog
Short version. A summary of every release is in docs/changelog.md.
Every change in detail: v2.4.0_CHANGELOG.md (active changelog) and v2.3_CHANGELOG.md (all changes up to v2.3.0).
AI Disclosure: While the architectural concept and logic are my own, I utilized AI to assist with code optimization and documentation formatting.