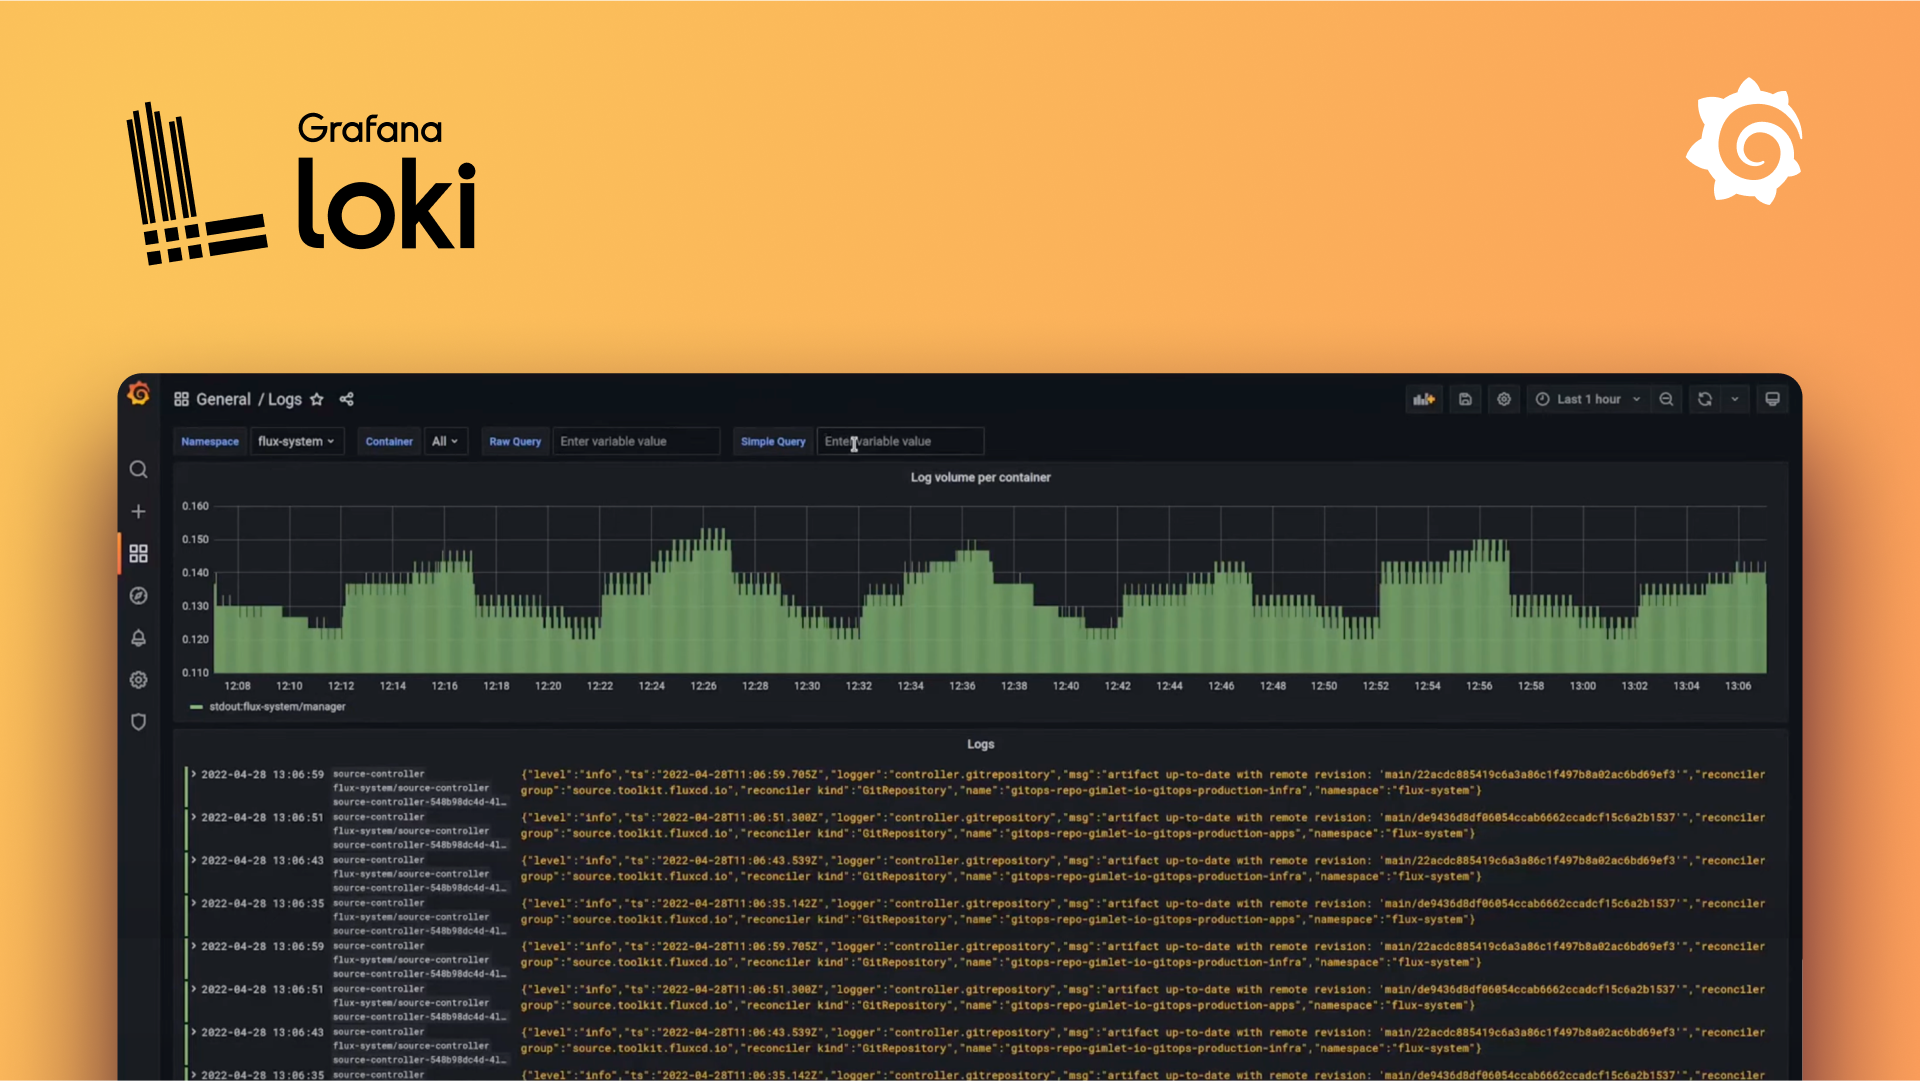




Loki: like Prometheus, but for logs.
Loki is a horizontally-scalable, highly-available, multi-tenant log aggregation system inspired by Prometheus. It is designed to be very cost effective and easy to operate. It does not index the contents of the logs, but rather a set of labels for each log stream.
Compared to other log aggregation systems, Loki:
- does not do full text indexing on logs. By storing compressed, unstructured logs and only indexing metadata, Loki is simpler to operate and cheaper to run.
- indexes and groups log streams using the same labels you’re already using with Prometheus, enabling you to seamlessly switch between metrics and logs using the same labels that you’re already using with Prometheus.
- is an especially good fit for storing Kubernetes Pod logs. Metadata such as Pod labels is automatically scraped and indexed.
- has native support in Grafana (needs Grafana v6.0).
A Loki-based logging stack consists of 3 components:
- Alloy is agent, responsible for gathering logs and sending them to Loki.
- Loki is the main service, responsible for storing logs and processing queries.
- Grafana for querying and displaying the logs.
Note that Alloy replaced Promtail in the stack, because Promtail is considered to be feature complete, and future development for logs collection will be in Grafana Alloy.
Loki is like Prometheus, but for logs: we prefer a multidimensional label-based approach to indexing, and want a single-binary, easy to operate system with no dependencies. Loki differs from Prometheus by focusing on logs instead of metrics, and delivering logs via push, instead of pull.
Getting started
⚠️ Helm Chart Migration
Effective March 16, 2026, the Grafana Loki Helm chart will be forked to a new repository grafana-community/helm-charts. The chart in the Loki repository will continue to be maintained for GEL users only. See #20705 for details.
Upgrading
Documentation
- Latest release
- Upcoming release, at the tip of the main branch
Commonly used sections:
- API documentation for getting logs into Loki.
- Labels
- Operations
- Docker Driver Client is a Docker plugin to send logs directly to Loki from Docker containers.
- LogCLI provides a command-line interface for querying logs.
- Loki Canary monitors your Loki installation for missing logs.
- Troubleshooting presents help dealing with error messages.
- Loki in Grafana describes how to set up a Loki datasource in Grafana.
Getting Help
If you have any questions or feedback regarding Loki:
- Search existing thread in the Grafana Labs community forum for Loki: https://community.grafana.com
- Ask a question on the Loki Slack channel. To invite yourself to the Grafana Slack, visit https://slack.grafana.com/ and join the #loki channel.
- File an issue for bugs, issues and feature suggestions.
- Send an email to [email protected], or use the web interface.
- UI issues should be filed directly in Grafana.
Your feedback is always welcome.
Further Reading
- The original design doc for Loki is a good source for discussion of the motivation and design decisions.
- Callum Styan's March 2019 DevOpsDays Vancouver talk "Grafana Loki: Log Aggregation for Incident Investigations".
- Grafana Labs blog post "How We Designed Loki to Work Easily Both as Microservices and as Monoliths".
- Tom Wilkie's early-2019 CNCF Paris/FOSDEM talk "Grafana Loki: like Prometheus, but for logs" (slides, video).
- David Kaltschmidt's KubeCon 2018 talk "On the OSS Path to Full Observability with Grafana" (slides, video) on how Loki fits into a cloud-native environment.
- Goutham Veeramachaneni's blog post "Loki: Prometheus-inspired, open source logging for cloud natives" on details of the Loki architecture.
- David Kaltschmidt's blog post "Closer look at Grafana's user interface for Loki" on the ideas that went into the logging user interface.
Contributing
Refer to CONTRIBUTING.md
Building from source
Loki can be run in a single host, no-dependencies mode using the following commands.
You need an up-to-date version of Go, we recommend using the version found in our Makefile
# Checkout source code
$ git clone https://github.com/grafana/loki
$ cd loki

# Build binary
$ go build ./cmd/loki

# Run executable
$ ./loki -config.file=./cmd/loki/loki-local-config.yaml
Alternatively, on Unix systems you can use make to build the binary, which adds additional arguments to the go build command.
# Build binary
$ make loki

# Run executable
$ ./cmd/loki/loki -config.file=./cmd/loki/loki-local-config.yaml
To run multiple Loki tenants locally, ensure that auth_enabled is set to true and provide a runtime config with any tenant specific overrides.
# Build binary
$ make loki

# Run executable
./loki -config.file=./cmd/loki/loki-local-multi-tenant-config.yaml -runtime-config.file=./cmd/loki/loki-overrides.yaml
Adopters
Please see ADOPTERS.md for some of the organizations using Loki today. If you would like to add your organization to the list, please open a PR to add it to the list.
License
Grafana Loki is distributed under AGPL-3.0-only. For Apache-2.0 exceptions, see LICENSING.md.