grafana-dashboards-kubernetes
Table of contents
Description
This repository contains a modern set of Grafana dashboards for Kubernetes.
They are inspired by many other dashboards from kubernetes-mixin and grafana.com.
More information about them in my article: A set of modern Grafana dashboards for Kubernetes
You can also download them on Grafana.com.
Releases
This repository follows semantic versioning for releases.
It relies on conventional commits to automate releases using semantic-release.
Features
These dashboards are made and tested for the kube-prometheus-stack chart, but they should work well with others as soon as you have kube-state-metrics and prometheus-node-exporter installed on your Kubernetes cluster.
They are not backward compatible with older Grafana versions because they try to take advantage of Grafana's newest features like:
gradient modeintroduced in Grafana 8.1 (Grafana Blog post)time seriesvisualization panel introduced in Grafana 7.4 (Grafana Blog post)$__rate_intervalvariable introduced in Grafana 7.2 (Grafana Blog post)
They also have a Prometheus Datasource variable so they will work on a federated Grafana instance.
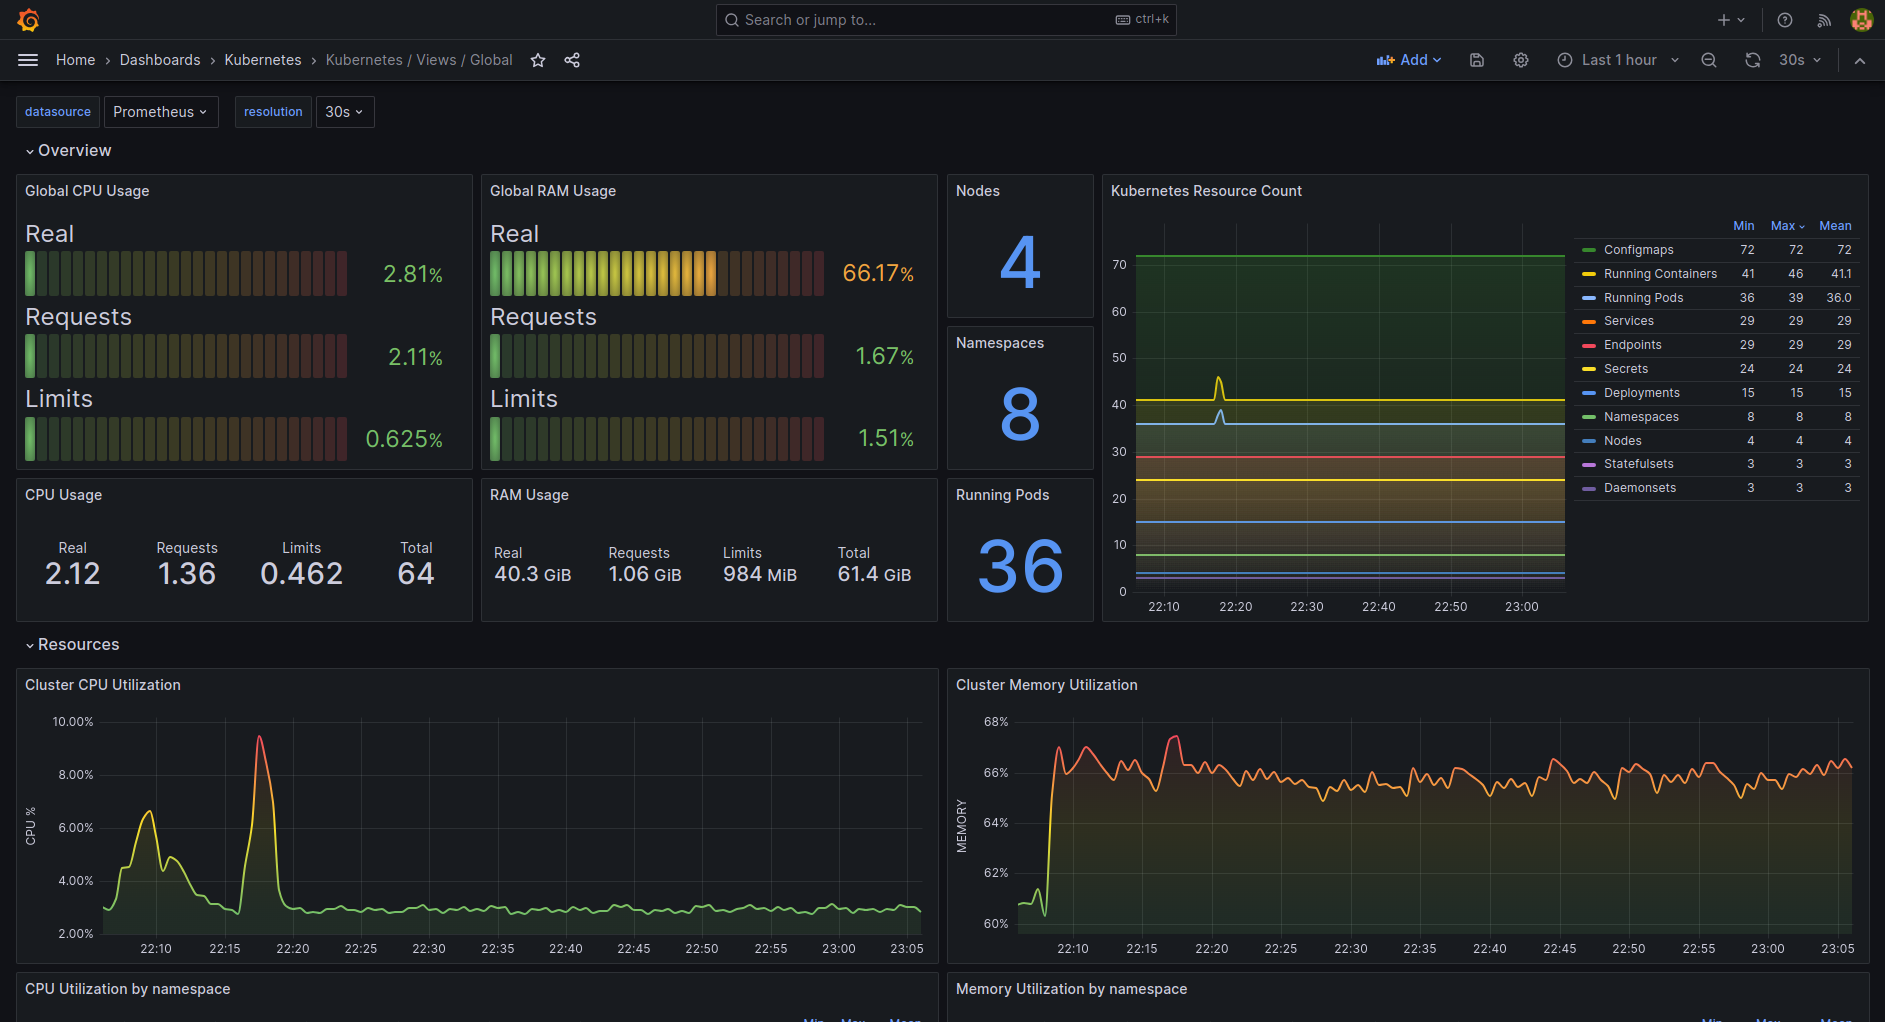
As an example, here's how the Kubernetes / Views / Global dashboard looks like:
Dashboards
| File name | Description | Screenshot |
|---|---|---|
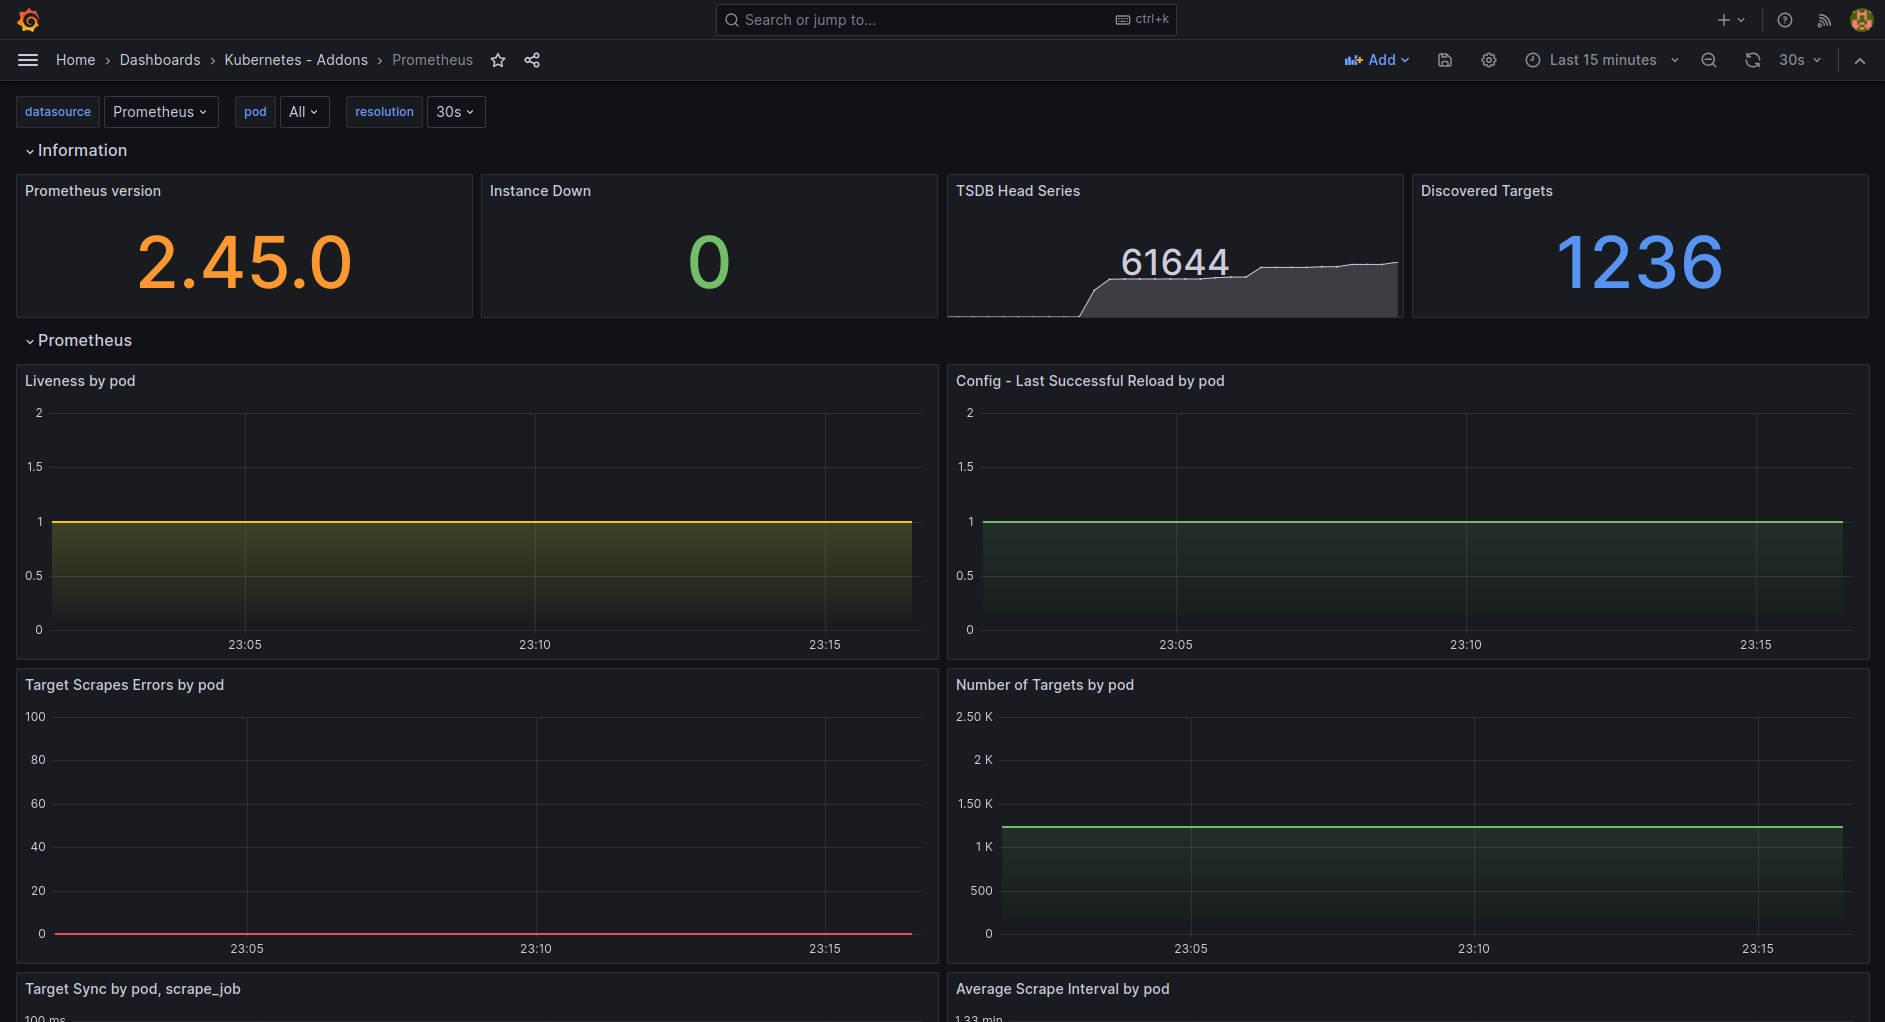
| k8s-addons-prometheus.json | Dashboard for Prometheus. | Screenshot |
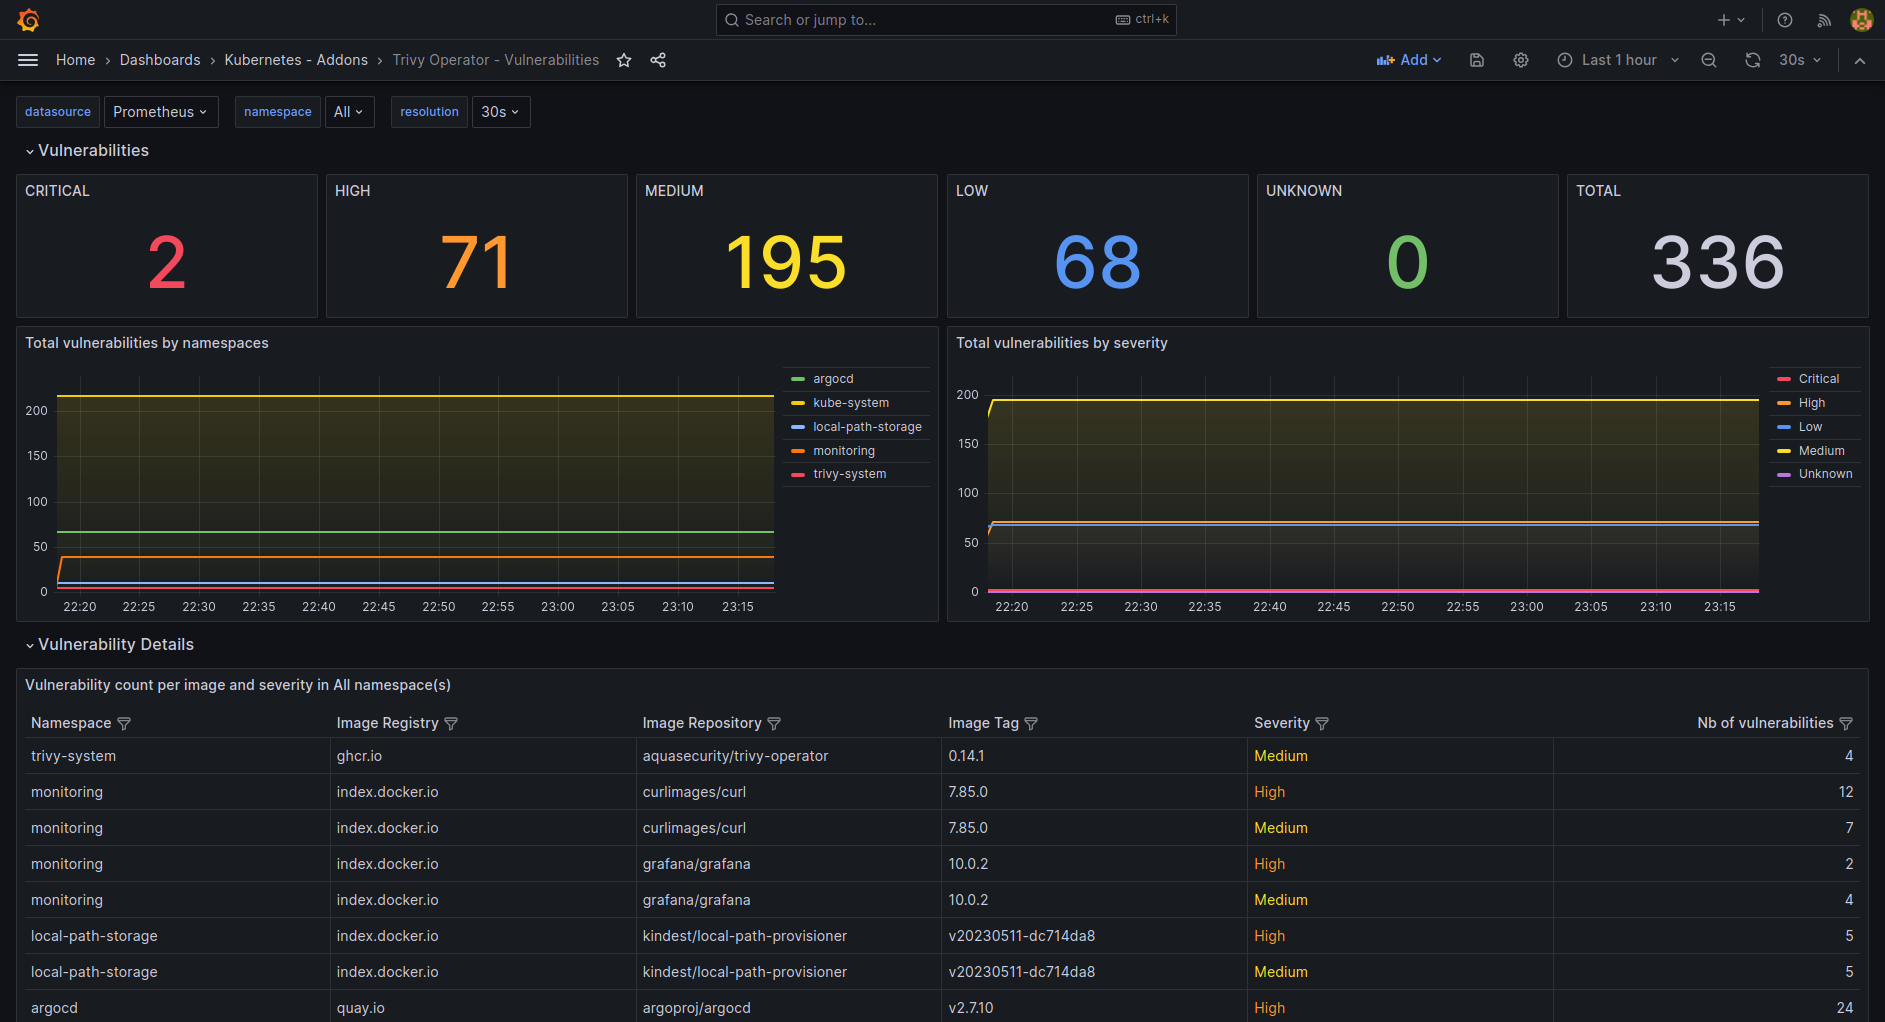
| k8s-addons-trivy-operator.json | Dashboard for the Trivy Operator from Aqua Security. | Screenshot |
| k8s-system-api-server.json | Dashboard for the API Server Kubernetes component. | Screenshot |
| k8s-system-coredns.json | Dashboard for the CoreDNS Kubernetes component. | Screenshot |
| k8s-views-global.json | Global level view dashboard for Kubernetes. |
Screenshot |
| k8s-views-namespaces.json | Namespaces level view dashboard for Kubernetes. |
Screenshot |
| k8s-views-nodes.json | Nodes level view dashboard for Kubernetes. |
Screenshot |
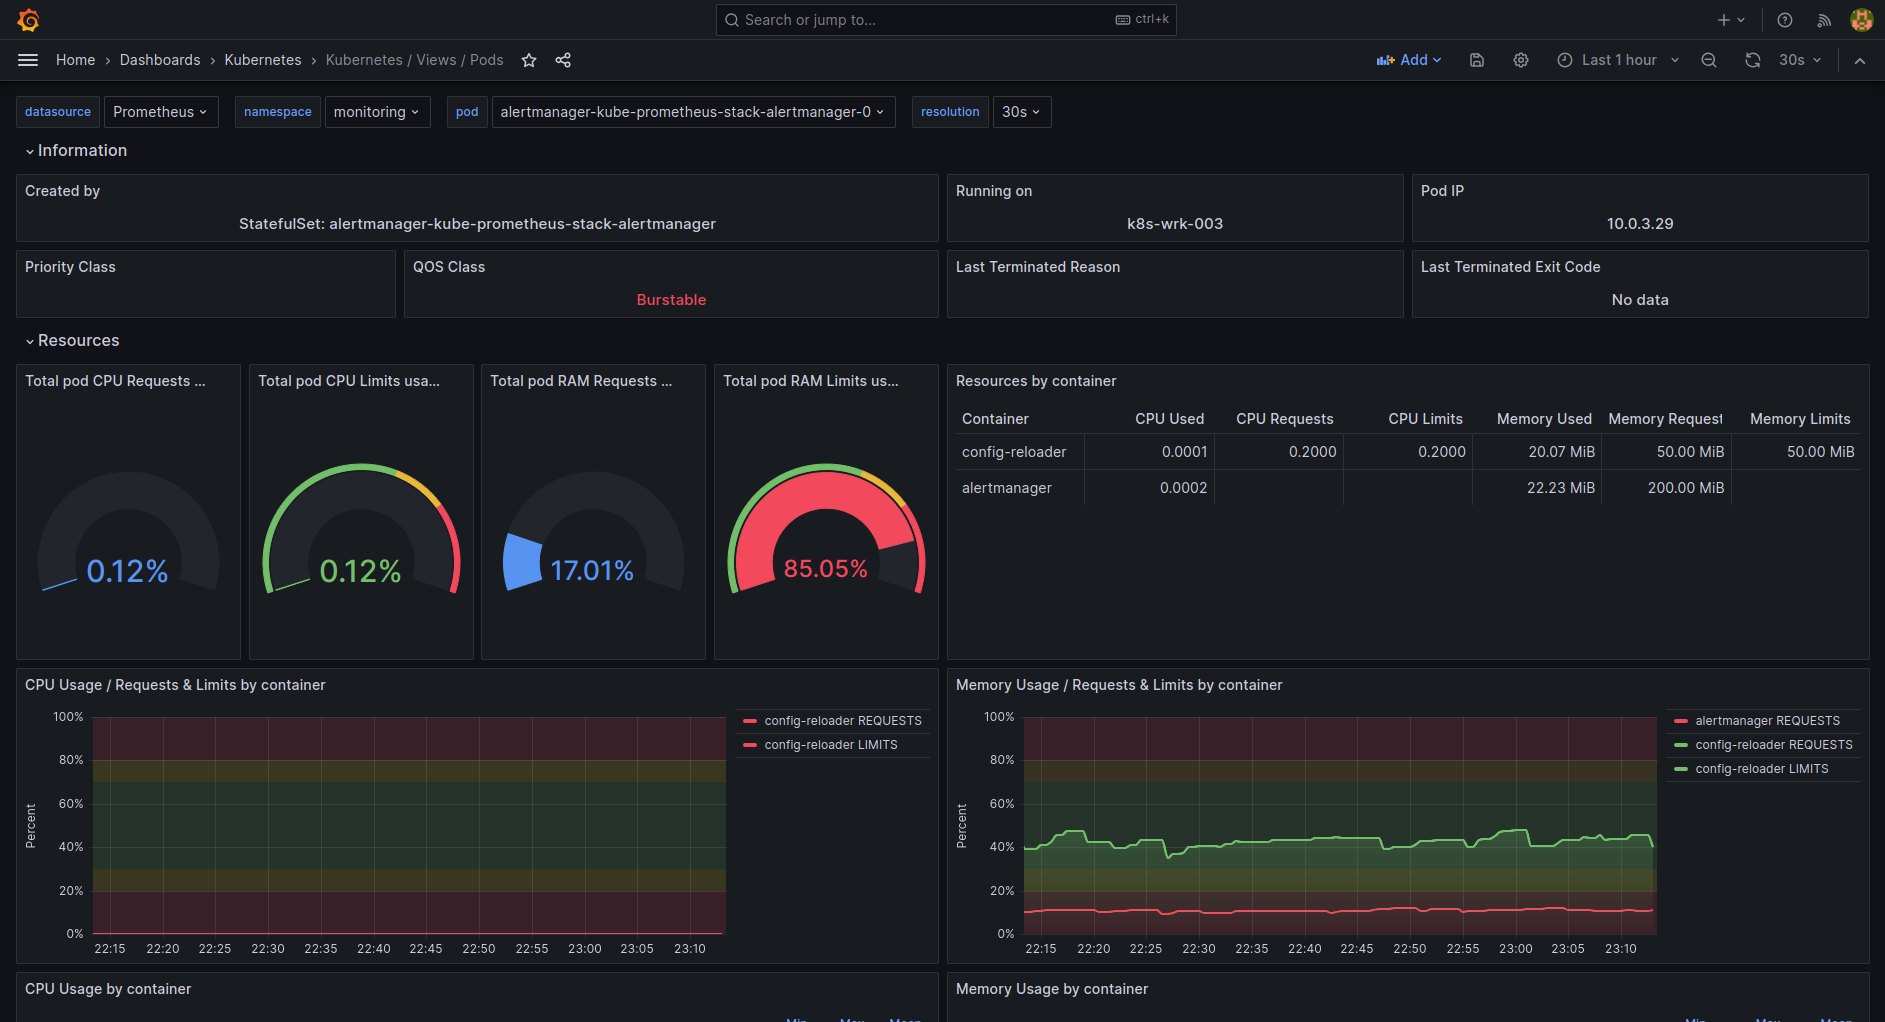
| k8s-views-pods.json | Pods level view dashboard for Kubernetes. |
Screenshot |
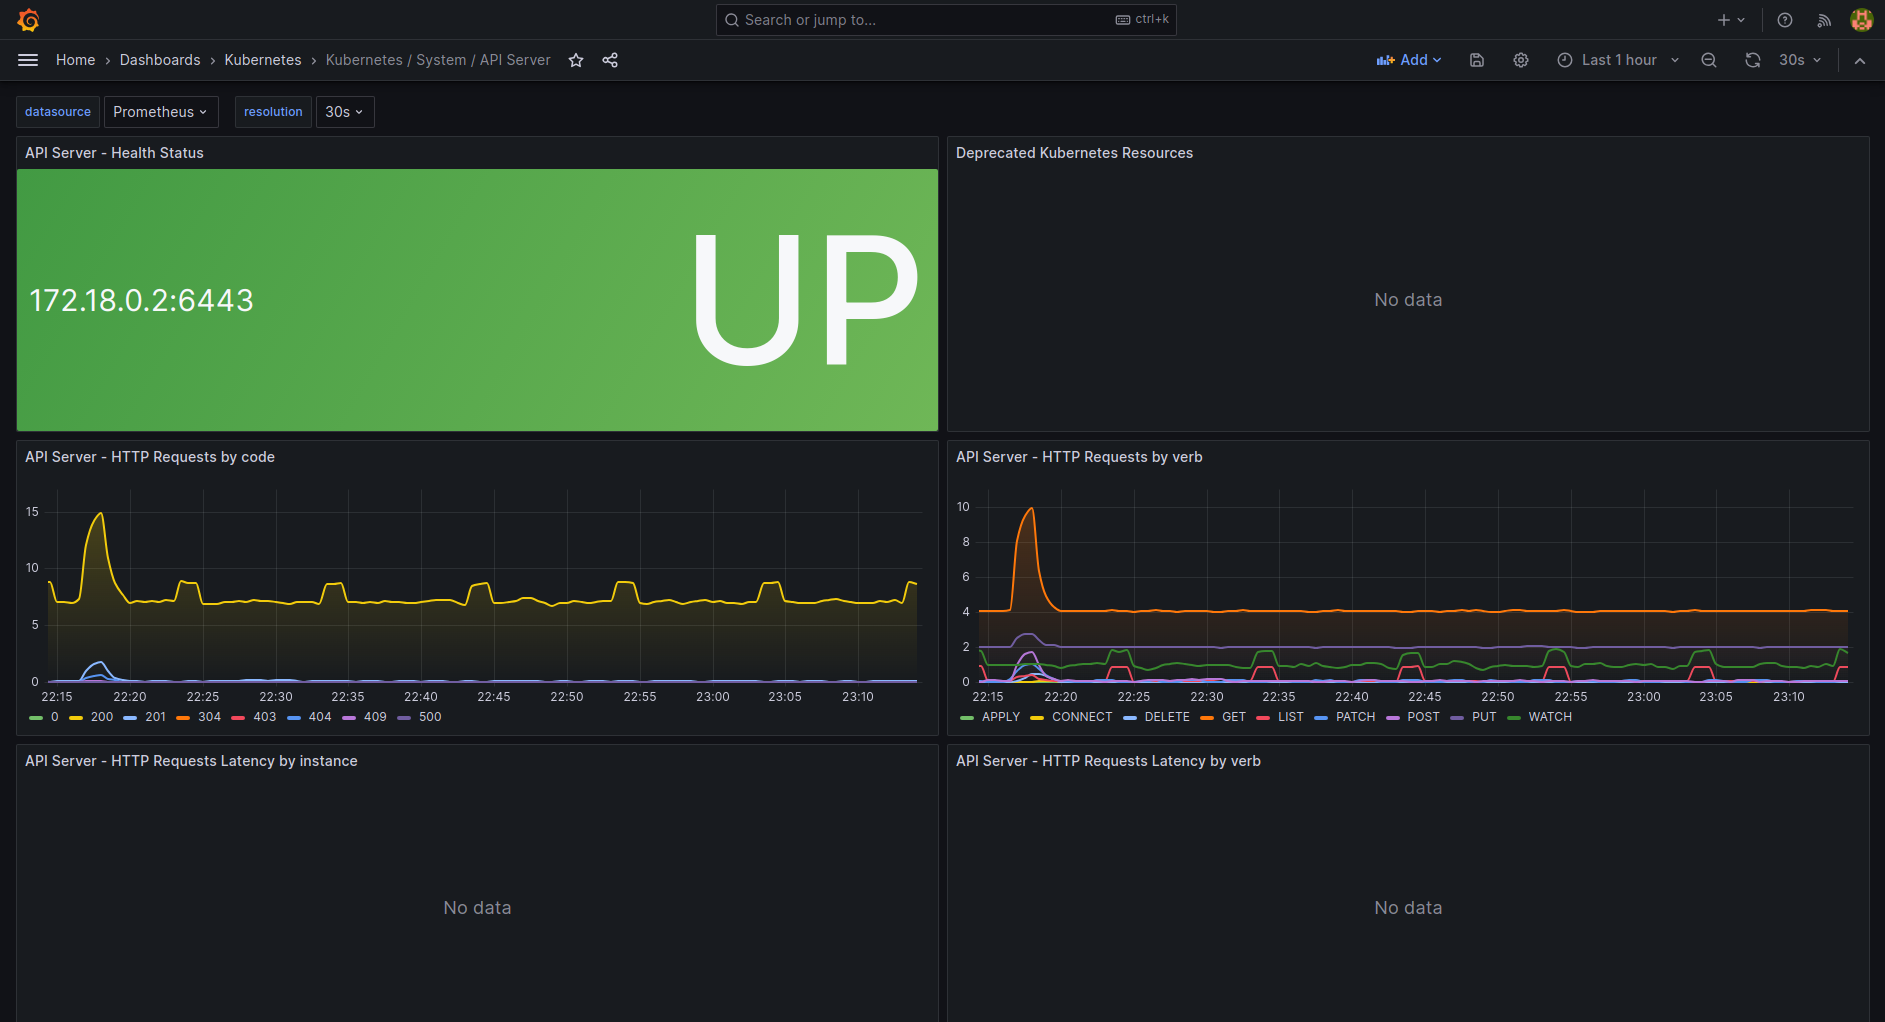
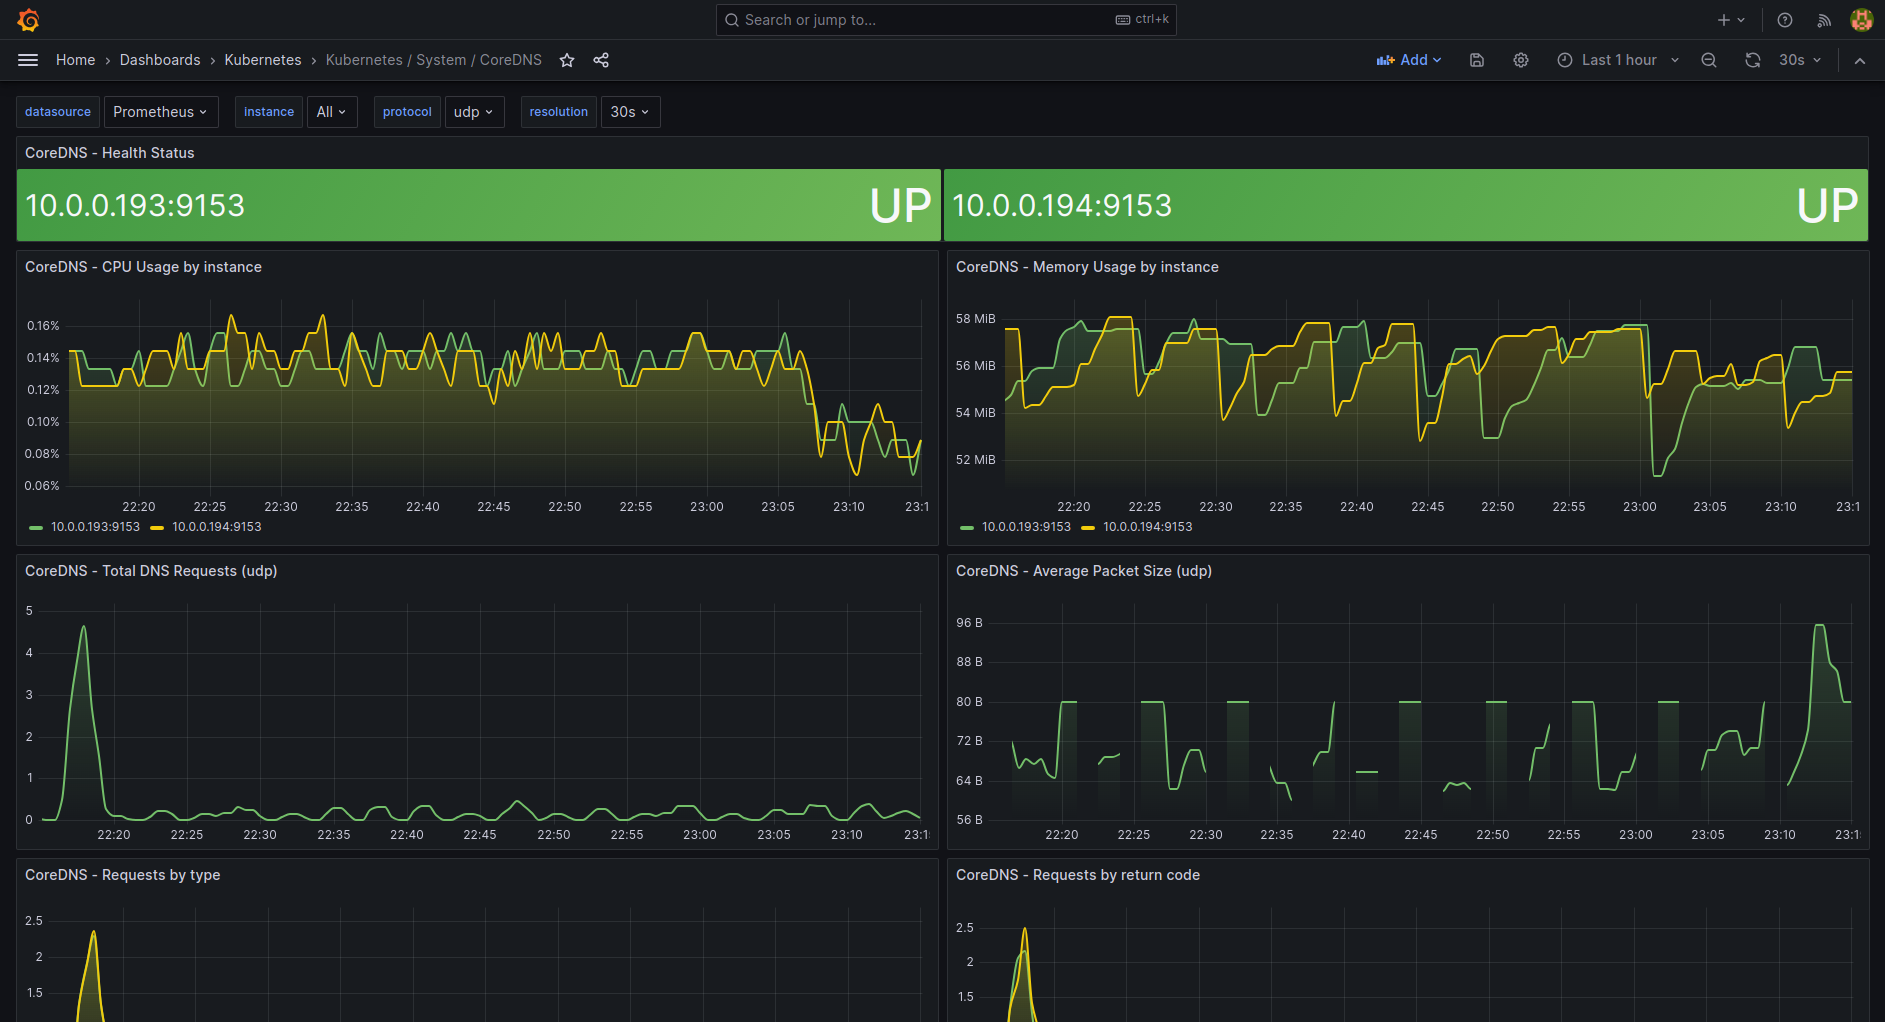
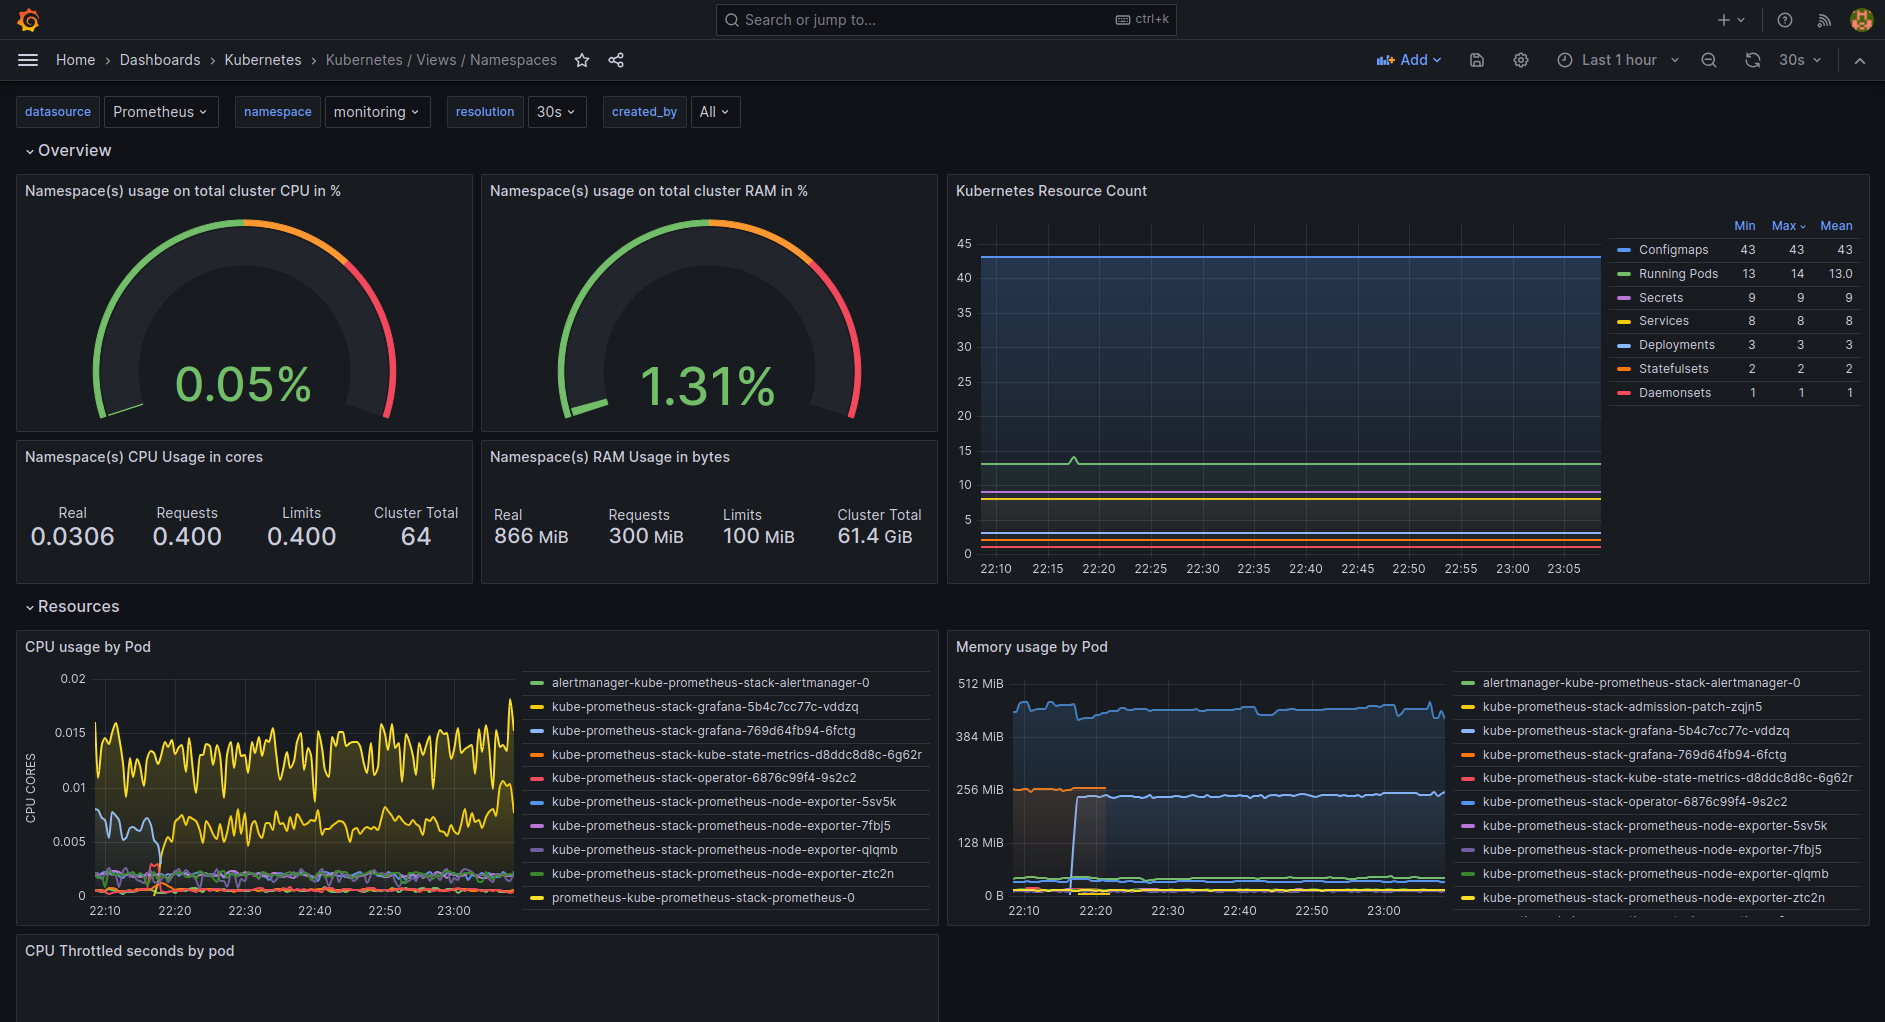
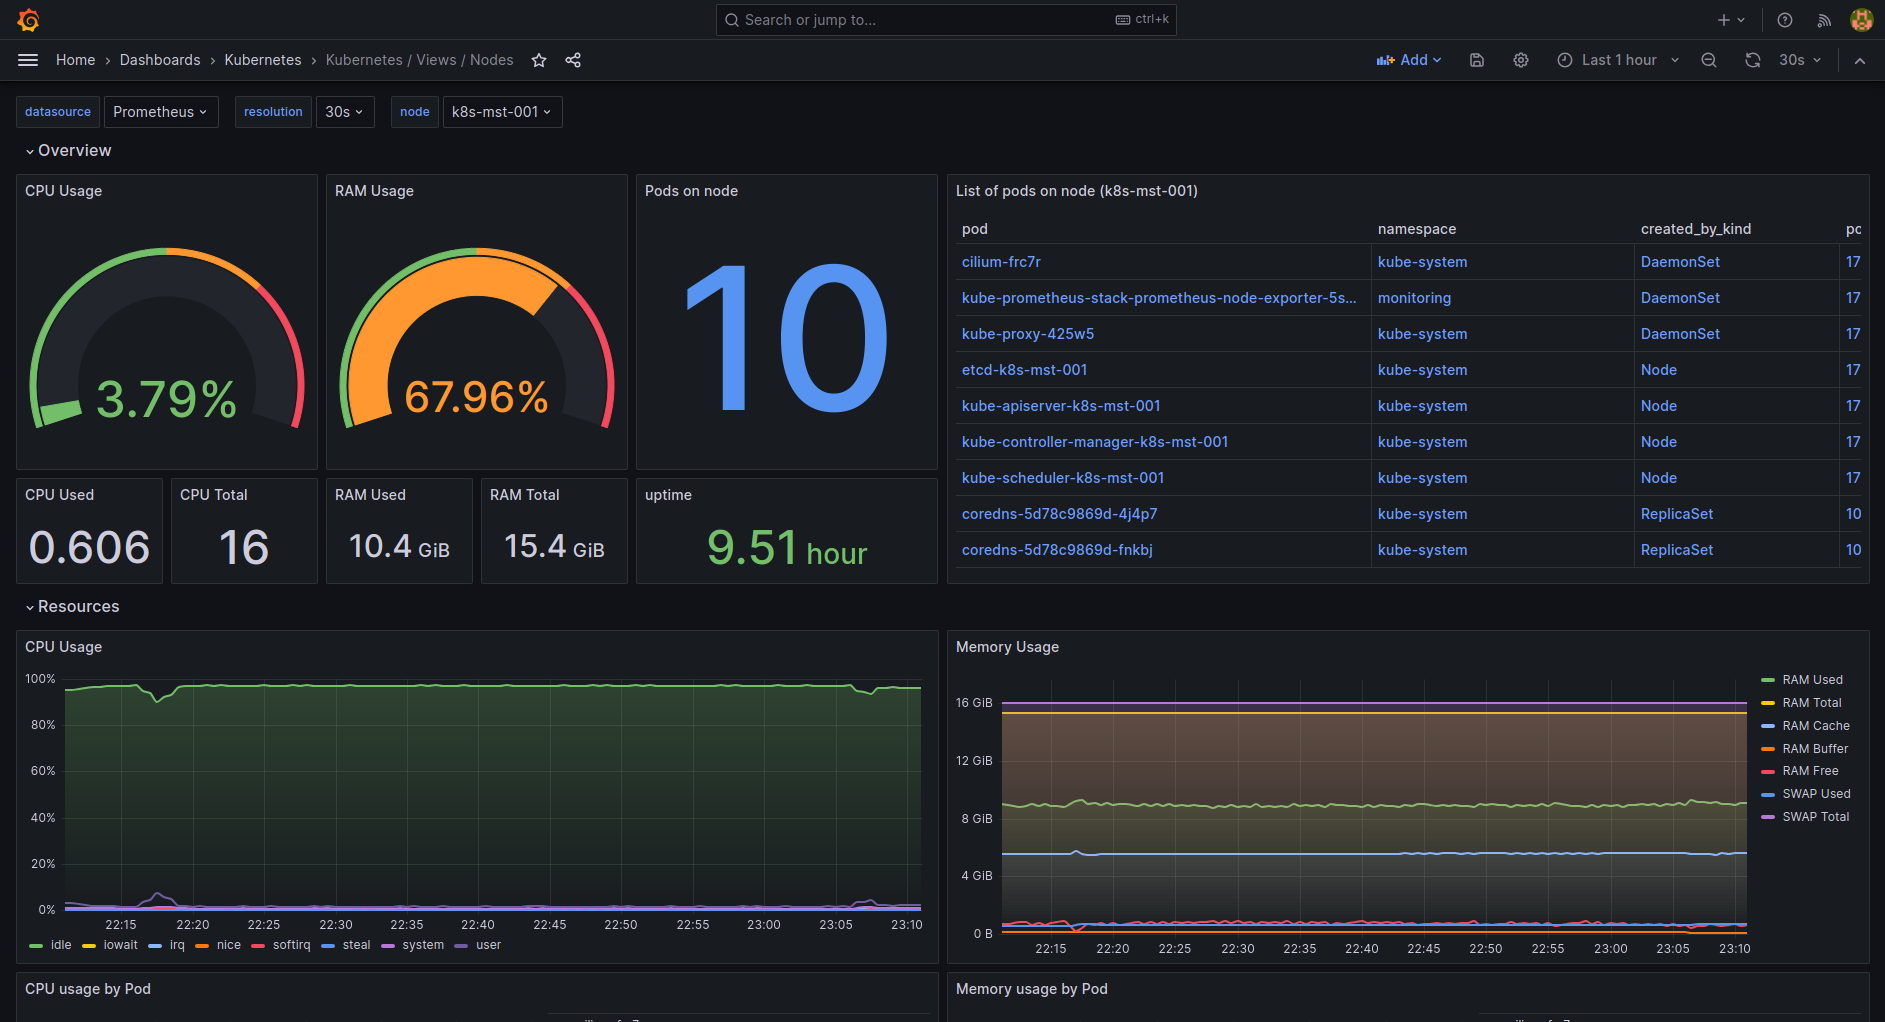
Installation
In most cases, you will need to clone this repository (or your fork):
git clone https://github.com/dotdc/grafana-dashboards-kubernetes.git
cd grafana-dashboards-kubernetes
If you plan to deploy these dashboards using ArgoCD, ConfigMaps or Terraform, you will also need to enable and configure the dashboards sidecar on the Grafana Helm chart to get the dashboards loaded in your Grafana instance:
# kube-prometheus-stack values
grafana:
  sidecar:
    dashboards:
      enabled: true
      defaultFolderName: "General"
      label: grafana_dashboard
      labelValue: "1"
      folderAnnotation: grafana_folder
      searchNamespace: ALL
      provider:
        foldersFromFilesStructure: true
Install manually
In your Grafana instance, put your mouse over the + sign on the left menu, then click on Import.
Once you are on the Import page, you can upload the JSON files one by one from your local copy using the Upload JSON file button.
Install via grafana.com
In your Grafana instance, put your mouse over the + sign on the left menu, then click on Import.
Once you are on the Import page, you can put the grafana.com dashboard ID (see table below) under Import via grafana.com then click on the Load button. Repeat for each dashboard.
Grafana.com dashboard id list:
| Dashboard | ID |
|---|---|
| k8s-addons-prometheus.json | 19105 |
| k8s-addons-trivy-operator.json | 16337 |
| k8s-system-api-server.json | 15761 |
| k8s-system-coredns.json | 15762 |
| k8s-views-global.json | 15757 |
| k8s-views-namespaces.json | 15758 |
| k8s-views-nodes.json | 15759 |
| k8s-views-pods.json | 15760 |
Install with ArgoCD
If you are using ArgoCD, this will deploy the dashboards in the default project of ArgoCD:
kubectl apply -f argocd-app.yml
You will also need to enable and configure the Grafana dashboards sidecar as described in Installation.
Install with Helm values
If you use the official Grafana helm chart or kube-prometheus-stack, you can install the dashboards directly using the dashboardProviders & dashboards helm chart values.
Depending on your setup, add or merge the following block example to your helm chart values.
The example is for kube-prometheus-stack, for the official Grafana helm chart, remove the first line (grafana:), and reduce the indentation level of the entire block.
grafana:
  # Provision grafana-dashboards-kubernetes
  dashboardProviders:
    dashboardproviders.yaml:
      apiVersion: 1
      providers:
      - name: 'grafana-dashboards-kubernetes'
        orgId: 1
        folder: 'Kubernetes'
        type: file
        disableDeletion: true
        editable: true
        options:
          path: /var/lib/grafana/dashboards/grafana-dashboards-kubernetes
  dashboards:
    grafana-dashboards-kubernetes:
      k8s-system-api-server:
        url: https://raw.githubusercontent.com/dotdc/grafana-dashboards-kubernetes/master/dashboards/k8s-system-api-server.json
        token: ''
      k8s-system-coredns:
        url: https://raw.githubusercontent.com/dotdc/grafana-da