geemap is an MIT-licensed Python package that brings interactive geospatial analysis and visualization with Google Earth Engine into Jupyter-based environments, and it is built for students, researchers, and existing Earth Engine users who want to explore satellite imagery with the Python ecosystem.
What it is
geemap is a Python package for interactive geospatial analysis and visualization with Google Earth Engine (GEE), the cloud computing platform that serves a multi-petabyte catalog of satellite imagery and geospatial datasets. It lives in the Python geospatial and Jupyter ecosystem rather than the browser: the package is built upon ipyleaflet and ipywidgets, which lets users analyze and visualize Earth Engine datasets interactively inside a Jupyter-based environment. It is distributed as geemap through PyPI and conda-forge under the MIT licence, documented at geemap.org, and supported by NASA under Grant No. 80NSSC22K1742 through the Open Source Tools, Frameworks, and Libraries 2020 Program.
The concrete problem it solves is a gap between Google Earth Engine's two APIs. GEE offers both a JavaScript API and a Python API, but the JavaScript side has comprehensive documentation and an interactive IDE in the GEE JavaScript Code Editor, while the Python API has relatively little documentation and limited functionality for visualizing results interactively. geemap was created specifically to fill that gap, so a Python user does not have to switch to the Code Editor merely to see a layer on a map. In practice it replaces that browser-based round trip for interactive exploration, and gives scientific Python users a way to inspect Earth Engine imagery and derived layers in the same notebook where the rest of their analysis runs.
Key capabilities
- Interactive map display inside Jupyter notebooks, built on
ipyleaflet and ipywidgets so Earth Engine datasets can be explored as live widgets rather than static exports.
- Visualization and analysis against Earth Engine's multi-petabyte catalog of satellite imagery and geospatial datasets.
- Ready-to-run notebook environments: the README ships "Open in Colab", "Open in Binder", and "Open In Studio Lab" badges pointing at published example notebooks.
- A large body of worked examples, cited in the README as 360+ GEE notebook examples, backed by GEE tutorials on YouTube.
- Distribution through two package channels, PyPI (
geemap) and the conda-forge geemap feedstock, alongside the hosted documentation at geemap.org.
- Image processing and dataviz workflows listed among the project's topics, alongside
folium, earth-engine, earthengine, gis, and colab.
- A published, citable description of the software in the Journal of Open Source Software, and a Discord server for community support.
Who uses it and how
- Students and researchers who want to use the wider Python ecosystem of libraries and tools to explore Google Earth Engine data, typically from a notebook.
- Existing GEE users who already work in the JavaScript API or the Code Editor and want to transition their work into Python.
- Environmental applications at local, regional, and global scales, which the README names as the kind of work Earth Engine has enabled in the geospatial community.
- Self-study and teaching, using the 360+ GEE notebook examples and the book Earth Engine and Geemap: Geospatial Data Science with Python, published by Locate Press in July 2023.
- Teams and individuals working in hosted notebooks such as Google Colab, Binder, or SageMaker Studio Lab, where no local geospatial stack needs to be assembled.
Getting started
geemap is installed from the geemap package on PyPI or from the conda-forge feedstock, and the README also links directly to Colab, Binder, and Studio Lab versions of its notebooks for running it without a local setup. Documentation and examples are hosted at geemap.org.
How it compares
Within the facts provided, the closest point of comparison is Google Earth Engine's own tooling: the JavaScript API and its Code Editor remain the well-documented, interactive option, while the Python API that geemap builds on is comparatively thinly documented for interactive visualization. geemap is not a standalone mapping library either, since it is layered on ipyleaflet and ipywidgets (with folium listed among its topics), so it is best understood as an interactive analysis layer for Earth Engine rather than a competitor to general Python plotting or mapping packages.
When to use it — and when not to
A self-hoster needs a working Python and Jupyter environment, an Earth Engine account, and network access to Earth Engine's servers, because the package computes against a cloud platform and offers no offline mode. Anyone who does not work with Earth Engine data, or who is content in the JavaScript Code Editor or a desktop GIS, will get little from it. The project's own README is candid that the underlying Python API is the weaker of the two interfaces, and the repository carries 53 open issues, so users who need stable, fully documented behaviour for every operation should check the issue tracker and the Python API's documentation before committing.
project readme (upstream, from github) — read inline
geemap













A Python package for interactive geospatial analysis and visualization with Google Earth Engine
- GitHub repo:
- Documentation:
- PyPI:
- Conda-forge:
- 360+ GEE notebook examples:
- GEE Tutorials on YouTube:
- Free software: MIT license
Join our Discord server 👇

Acknowledgment: The geemap project is supported by the National Aeronautics and Space Administration (NASA) under Grant No. 80NSSC22K1742 issued through the Open Source Tools, Frameworks, and Libraries 2020 Program.
Announcement
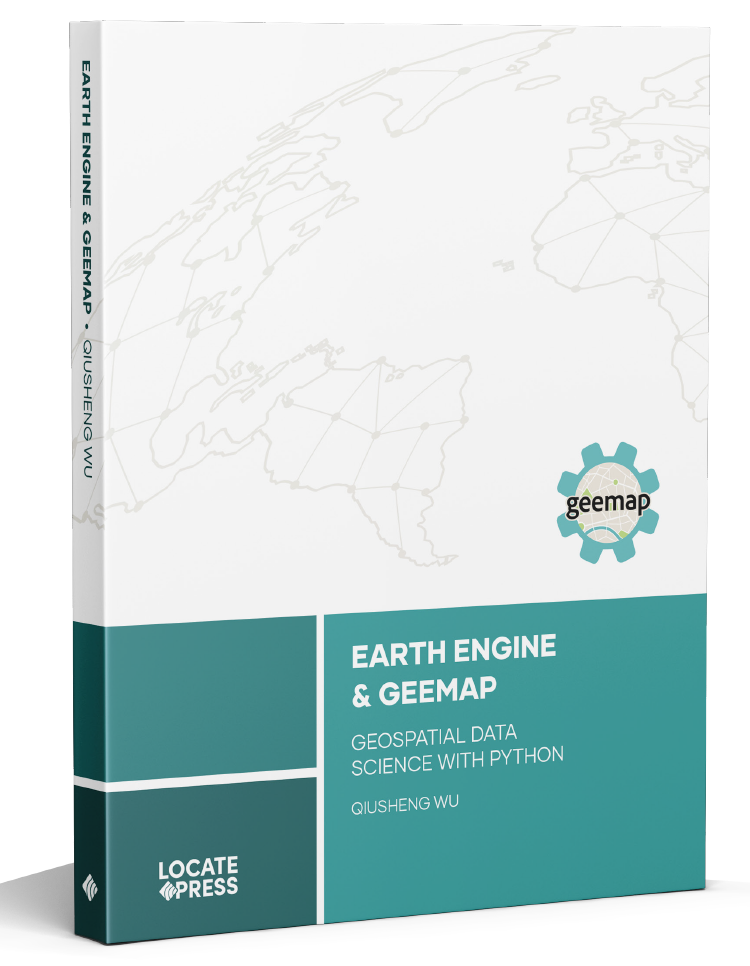
The book Earth Engine and Geemap: Geospatial Data Science with Python, written by Qiusheng Wu, has been published by Locate Press in July 2023. If you're interested in purchasing the book, please visit this URL: .
Introduction
Geemap is a Python package for interactive geospatial analysis and visualization with Google Earth Engine (GEE), which is a cloud computing platform with a multi-petabyte catalog of satellite imagery and geospatial datasets. During the past few years, GEE has become very popular in the geospatial community and it has empowered numerous environmental applications at local, regional, and global scales. GEE provides both JavaScript and Python APIs for making computational requests to the Earth Engine servers. Compared with the comprehensive documentation and interactive IDE (i.e., GEE JavaScript Code Editor) of the GEE JavaScript API, the GEE Python API has relatively little documentation and limited functionality for visualizing results interactively. The geemap Python package was created to fill this gap. It is built upon ipyleaflet and ipywidgets, and enables users to analyze and visualize Earth Engine datasets interactively within a Jupyter-based environment.
Geemap is intended for students and researchers, who would like to utilize the Python ecosystem of diverse libraries and tools to explore Google Earth Engine. It is also designed for existing GEE users who would like to transition from the GEE JavaScript API to Python API. The automated JavaScript-to-Python conversion module of the geemap package can greatly reduce the time needed to convert existing GEE JavaScripts to Python scripts and Jupyter notebooks.
For video tutorials and notebook examples, please visit the examples page. For complete documentation on geemap modules and methods, please visit the API Reference.
If you find geemap useful in your research, please consider citing the following papers to support my work. Thank you for your support.
- Wu, Q., (2020). geemap: A Python package for interactive mapping with Google Earth Engine. The Journal of Open Source Software, 5(51), 2305.
- Wu, Q., Lane, C. R., Li, X., Zhao, K., Zhou, Y., Clinton, N., DeVries, B., Golden, H. E., & Lang, M. W. (2019). Integrating LiDAR data and multi-temporal aerial imagery to map wetland inundation dynamics using Google Earth Engine. Remote Sensing of Environment, 228, 1-13. (pdf | source code)
Check out the geemap workshop presented at the GeoPython Conference 2021. This workshop gives a comprehensive introduction to the key features of geemap.
Key Features
Below is a partial list of features available for the geemap package. Please check the examples page for notebook examples, GIF animations, and video tutorials.
- Convert Earth Engine JavaScripts to Python scripts and Jupyter notebooks.
- Display Earth Engine data layers for interactive mapping.
- Support Earth Engine JavaScript API-styled functions in Python, such as
Map.addLayer(), Map.setCenter(), Map.centerObject(), Map.setOptions().
- Create split-panel maps with Earth Engine data.
- Retrieve Earth Engine data interactively using the Inspector Tool.
- Interactive plotting of Earth Engine data by simply clicking on the map.
- Convert data format between GeoJSON and Earth Engine.
- Use drawing tools to interact with Earth Engine data.
- Use shapefiles with Earth Engine without having to upload data to one's GEE account.
- Export Earth Engine FeatureCollection to other formats (i.e., shp, csv, json, kml, kmz).
- Export Earth Engine Image and ImageCollection as GeoTIFF.
- Extract pixels from an Earth Engine Image into a 3D numpy array.
- Calculate zonal statistics by group.
- Add a customized legend for Earth Engine data.
- Convert Earth Engine JavaScripts to Python code directly within Jupyter notebook.
- Add animated text to GIF images generated from Earth Engine data.
- Add colorbar and images to GIF animations generated from Earth Engine data.
- Create Landsat timelapse animations with animated text using Earth Engine.
- Search places and datasets from Earth Engine Data Catalog.
- Use timeseries inspector to visualize landscape changes over time.
- Export Earth Engine maps as HTML files and PNG images.
- Search Earth Engine API documentation within Jupyter notebooks.
- Import Earth Engine assets from personal account.
- Publish interactive GEE maps directly within Jupyter notebook.
- Add local raster datasets (e.g., GeoTIFF) to the map.
- Perform image classification and accuracy assessment.
- Extract pixel values interactively and export as shapefile and csv.
