G6 is a TypeScript graph visualization engine, published as @antv/g6 under the MIT licence, that provides the drawing, layout, analysis, interaction, animation, theme and plugin primitives developers need to build their own graph visualization and analysis applications.
What it is
G6 is a graph visualization engine written in TypeScript and maintaining it in the AntV ecosystem, the Ant Group visualization family that also contains G2, X6 and L7. It is installed as the @antv/g6 package from npm or Yarn and exposes a Graph object that takes a data structure of nodes and edges, a container, and configuration for elements, layout and behaviors, then draws the result when graph.render() is called. The engine renders through G, which supports Canvas, SVG and WebGL output as well as server-side rendering with Node.js, and plugin packages add WebGL-based 3D rendering and spatial interactions.
The concrete problem it solves is the hand-written graph drawing layer that teams otherwise build for themselves: node and edge geometry, layout mathematics, hit testing, zooming, dragging and theming, all reimplemented per project on top of general-purpose drawing libraries. G6 replaces that work with built-in node, edge and Combo elements, more than ten built-in interaction behaviors, more than ten graph layouts, and two themes with palettes, so relational data can be turned into an explorable graph without a bespoke rendering stack.
Key capabilities
- Built-in node, edge and Combo UI elements with extensive style configuration and data callbacks, plus extension mechanism for custom elements.
- More than 10 built-in interaction behaviors, including
drag-canvas and drag-node, backed by a rich event model for custom interactions.
- More than 10 common graph layouts, some using GPU acceleration and Rust parallel computing, selectable through options such as
layout: { type: 'force' }, with support for custom layouts.
- Multiple rendering environments through G: Canvas, SVG and WebGL, plus server-side rendering under Node.js.
- Two built-in themes, light and dark, integrating over 20 popular community color palettes based on the AntV color scheme, applied through options such as
palette: { type: 'group', field: 'cluster' }.
- React nodes that enrich node presentation using the React front-end ecosystem, alongside optimized built-in plugins with extensibility for custom business capabilities.
- WebGL-based plugin packages providing 3D rendering and spatial interactions.
Who uses it and how
- Teams building graph visualization and analysis applications directly on the
Graph object, where data arrives as node and edge lists and the layout runs in the browser.
- React-oriented front ends, either through React nodes inside G6 or through Graphin, the React wrapper and SDK built on G6.
- Applications that need rendering outside the browser, using the Node.js server-side rendering path the engine supports.
- Large or dense networks that depend on the high-performance layouts leveraging GPU and Rust parallel computing.
- Products requiring three-dimensional graph views or spatial interaction, which are served by the WebGL plugin packages.
Getting started
Install the package with a package manager such as npm or Yarn: npm install @antv/g6. Then import Graph from @antv/g6, construct it with a container, data, layout and behaviors, and call graph.render().
How it compares
No list of paid products is given in these facts, so the closest comparisons are the sibling tools named in the README: G6 is the lower-level engine, while Graphin is a React wrapper and SDK built on top of it, and Ant Design Charts is a React chart library based on G2, G6, X6 and L7. Those projects consume G6 rather than compete with it, which places G6 as the rendering and layout layer a team adopts before adding a framework-specific wrapper.
When to use it — and when not to
G6 is a library rather than a service, so adopting it means writing and maintaining TypeScript application code around it; there is no database, storage or mail service to operate. Teams that want a finished React component out of the box are better served by Graphin or Ant Design Charts, which wrap G6 rather than requiring direct use of it. Two honest facts sit alongside the project's activity: the repository carries 333 open issues, and the README excerpt available here cuts off mid-sentence in the contribution guide, so the contributing documentation should be checked at the source before planning to submit changes.
project readme (upstream, from github) — read inline
 English | 简体中文
G6: A Graph Visualization Framework in TypeScript






Introduction •
Examples •
Quick Start •
API
G6 is a graph visualization engine. It provides basic capabilities for graph visualization and analysis such as drawing, layout, analysis, interaction, animation, themes, and plugins. With G6, users can quickly build their own graph visualization and analysis applications, making relational data simple, transparent, and meaningful.




✨ Features
G6, as a professional graph visualization engine, boasts the following features:
- Rich Elements: It comes with a variety of built-in node, edge, and Combo UI elements with extensive style configurations, supports data callbacks, and has a flexible mechanism for extending custom elements.
- Controllable Interactions: It includes more than 10 built-in interaction behaviors and offers a rich array of events, facilitating the expansion of custom interactive behaviors.
- High-Performance Layout: The engine features more than 10 common graph layouts, some of which leverage GPU and Rust parallel computing for enhanced performance, and it supports custom layout development.
- Convenient Plugins: Optimized built-in plugin functionality and performance, with flexible extensibility, making it easier to implement customized business capabilities.
- Multiple Theme and Palettes: Provides two sets of built-in themes, light and dark, that integrate over 20 popular community color palettes based on the AntV new color scheme.
- Multi-Environment Rendering: Harnessing the power of G, it supports rendering in Canvas, SVG, and WebGL, as well as server-side rendering with Node.js; it also offers plugin packages that provide powerful 3D rendering and spatial interactions based on WebGL.
- React Ecosystem: By utilizing the React front-end ecosystem, it supports React nodes, significantly enriching the presentational styles of G6 nodes.
🔨 Getting Started
G6 is usually installed via a package manager such as npm or Yarn.
$ npm install @antv/g6
The Graph object then can be imported from G6.
<div id="container"></div>
import { Graph } from '@antv/g6';

// Get the Data.
const data = {
  nodes: [
    /* your nodes data */
  ],
  edges: [
    /* your edges data */
  ],
};

// Create the Graph instance.
const graph = new Graph({
  container: 'container',
  data,
  node: {
    palette: {
      type: 'group',
      field: 'cluster',
    },
  },
  layout: {
    type: 'force',
  },
  behaviors: ['drag-canvas', 'drag-node'],
});

// Render the Graph.
graph.render();
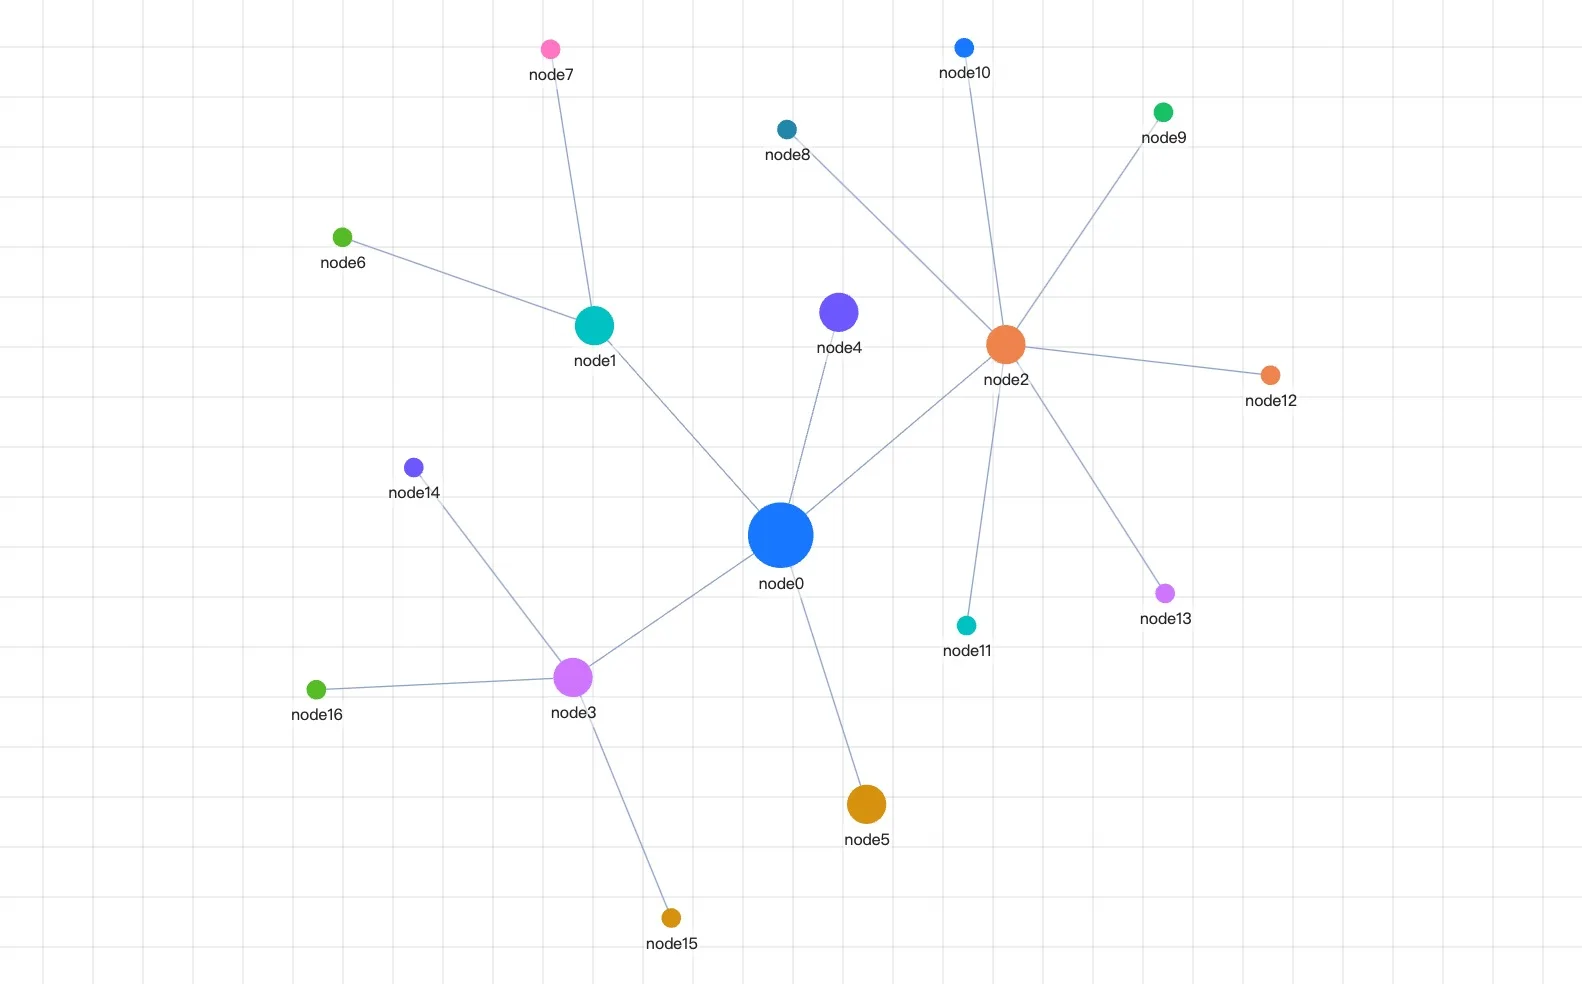
All goes well, you can get the following lovely graph!
🌍 Ecosystem
- Ant Design Charts: A React chart library based on G2, G6, X6, L7.
- Graphin: A simple React wrapper based on G6, as well as an SDK for developing graph visualization applications.
For more ecosystem open-source projects, contributions are welcome. Please feel free to submit a PR for inclusion.
📮 Contributing
This project exists thanks to all the people who contribute.
And thank you to all our backers! 🙏

- Issue Reporting: If you encounter any issues with G6 during use, please feel free to submit an issue, along with the minimal sample code that can reproduce the problem.
- Contribution Guide: Information on how to get involved in the development and contribution to G6.
- Ideas Discussion: Discuss your ideas on GitHub Discussions or in the DingTalk group.

📄 License
MIT.