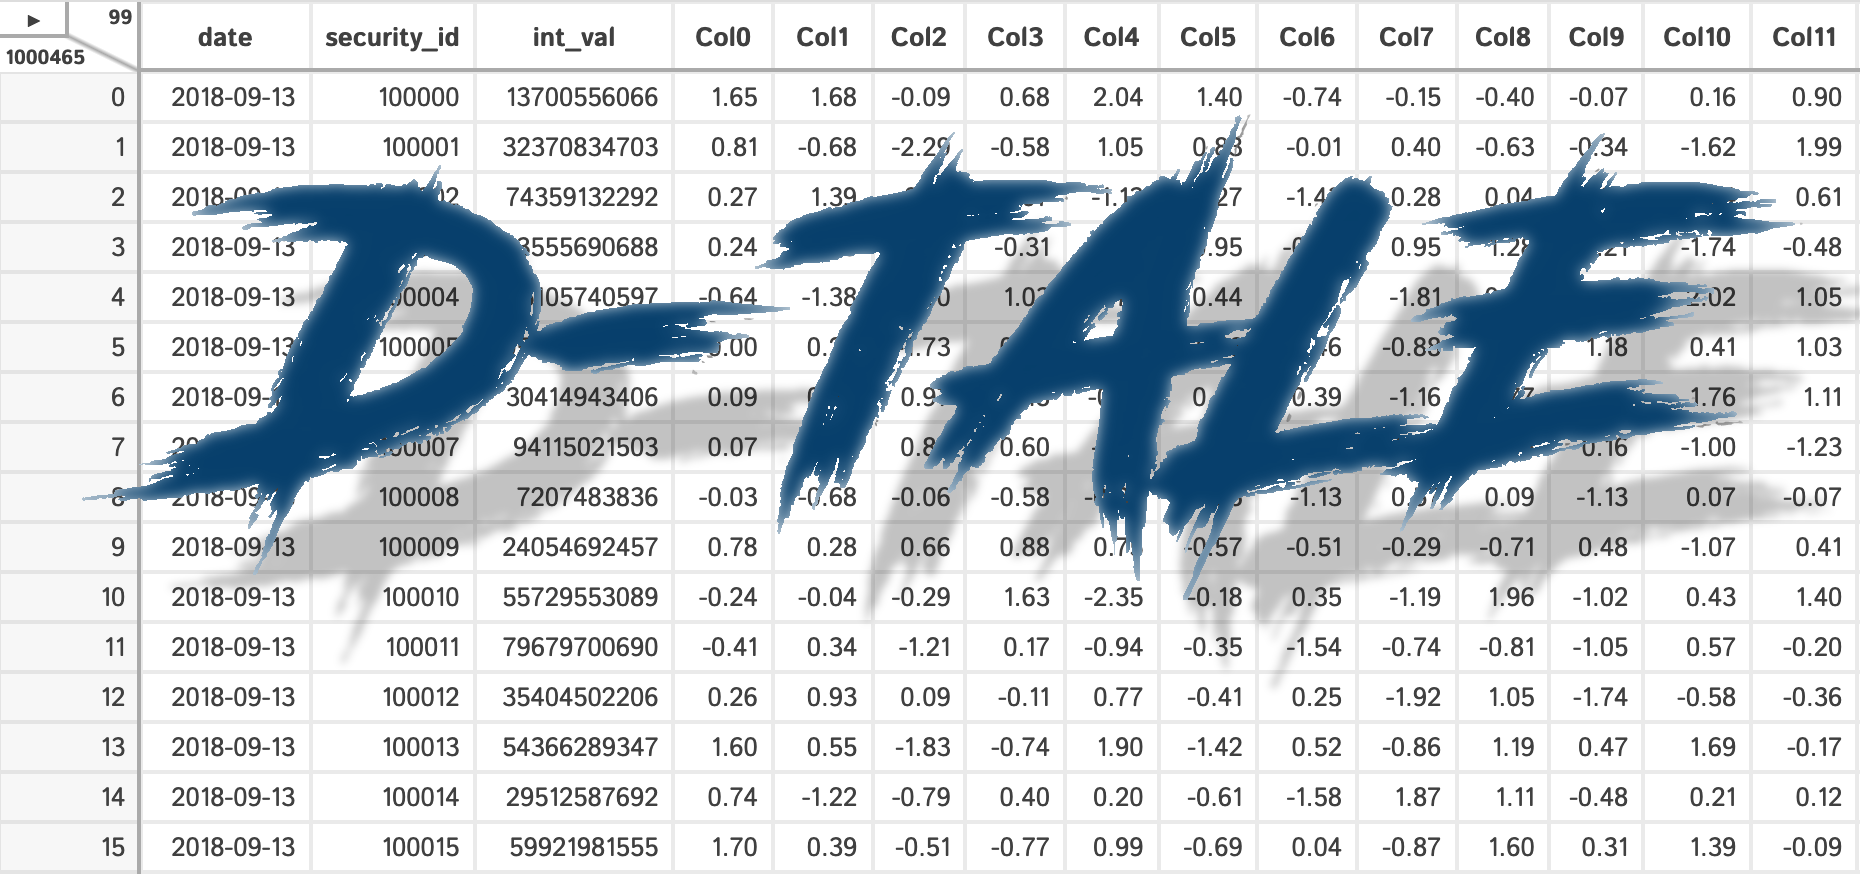







What is it?
D-Tale is the combination of a Flask back-end and a React front-end to bring you an easy way to view & analyze Pandas data structures. It integrates seamlessly with ipython notebooks & python/ipython terminals. Currently this tool supports such Pandas objects as DataFrame, Series, MultiIndex, DatetimeIndex & RangeIndex.
Origins
D-Tale was the product of a SAS to Python conversion. What was originally a perl script wrapper on top of SAS's insight function is now a lightweight web client on top of Pandas data structures.
In The News
- 4 Libraries that can perform EDA in one line of python code
- React Status
- KDNuggets
- Man Institute (warning: contains deprecated functionality)
- Python Bytes
- FlaskCon 2020
- San Diego Python
- Medium: towards data science
- Medium: Exploratory Data Analysis – Using D-Tale
- EOD Notes: Using python and dtale to analyze correlations
- Data Exploration is Now Super Easy w/ D-Tale
- Practical Business Python
Tutorials
- Pip Install Python YouTube Channel
- machine_learning_2019
- D-Tale The Best Library To Perform Exploratory Data Analysis Using Single Line Of Code🔥🔥🔥🔥
- Explore and Analyze Pandas Data Structures w/ D-Tale
- Data Preprocessing simplest method 🔥
Related Resources
- Adventures In Flask While Developing D-Tale
- Adding Range Selection to react-virtualized
- Building Draggable/Resizable Modals
- Embedding Flask Apps within Streamlit
Contents
- Where To Get It
- Getting Started
- Python Terminal
- As A Script
- Jupyter Notebook
- Jupyterhub w/ Jupyter Server Proxy
- Jupyterhub w/ Kubernetes
- Docker Container
- Google Colab
- Kaggle
- Binder
- R with Reticulate
- Startup with No Data
- Command-line
- Custom Command-line Loaders
- Embedding Within Your Own Flask App
- Embedding Within Your Own Django App
- Embedding Within Streamlit
- Running D-Tale On Gunicorn w/ Redis
- Configuration
- Authentication
- Predefined Filters
- Using Swifter
- Behavior for Wide Dataframes
- UI
- Dimensions/Ribbon Menu/Main Menu
- Header
- Resize Columns
- Editing Cells
- Copy Cells Into Clipboard
- Main Menu Functions
- XArray Operations, Describe, Outlier Detection, Custom Filter, Dataframe Functions, Merge & Stack, Summarize Data, Duplicates, Missing Analysis, Correlations, Predictive Power Score, Heat Map, Highlight Dtypes, Highlight Missing, Highlight Outliers, Highlight Range, Low Variance Flag, Instances, Code Exports, Export CSV, Load Data & Sample Datasets, Refresh Widths, About, Theme, Reload Data, Unpin/Pin Menu, Language, Shutdown
- Column Menu Functions
- Charts
- Network Viewer
- Hotkeys
- Menu Functions Depending on Browser Dimensions
- For Developers
- Global State/Data Storage
- Startup Behavior
- Documentation
- Dependencies
- Acknowledgements
- License
Where To get It
The source code is currently hosted on GitHub at: https://github.com/man-group/dtale
Binary installers for the latest released version are available at the Python package index and on conda using conda-forge.
# conda
conda install dtale -c conda-forge
# if you want to also use "Export to PNG" for charts
conda install -c plotly python-kaleido
# or PyPI
pip install dtale
Getting Started
| PyCharm | jupyter |
|---|---|
| ![](https://raw.githubusercontent.com/aschonfeld/dt |