debug


A tiny JavaScript debugging utility modelled after Node.js core's debugging technique. Works in Node.js and web browsers.
Installation
$ npm install debug
Usage
debug exposes a function; simply pass this function the name of your module, and it will return a decorated version of console.error for you to pass debug statements to. This will allow you to toggle the debug output for different parts of your module as well as the module as a whole.
Example app.js:
var debug = require('debug')('http')
  , http = require('http')
  , name = 'My App';

// fake app

debug('booting %o', name);

http.createServer(function(req, res){
  debug(req.method + ' ' + req.url);
  res.end('hello\n');
}).listen(3000, function(){
  debug('listening');
});

// fake worker of some kind

require('./worker');
Example worker.js:
var a = require('debug')('worker:a')
  , b = require('debug')('worker:b');

function work() {
  a('doing lots of uninteresting work');
  setTimeout(work, Math.random() * 1000);
}

work();

function workb() {
  b('doing some work');
  setTimeout(workb, Math.random() * 2000);
}

workb();
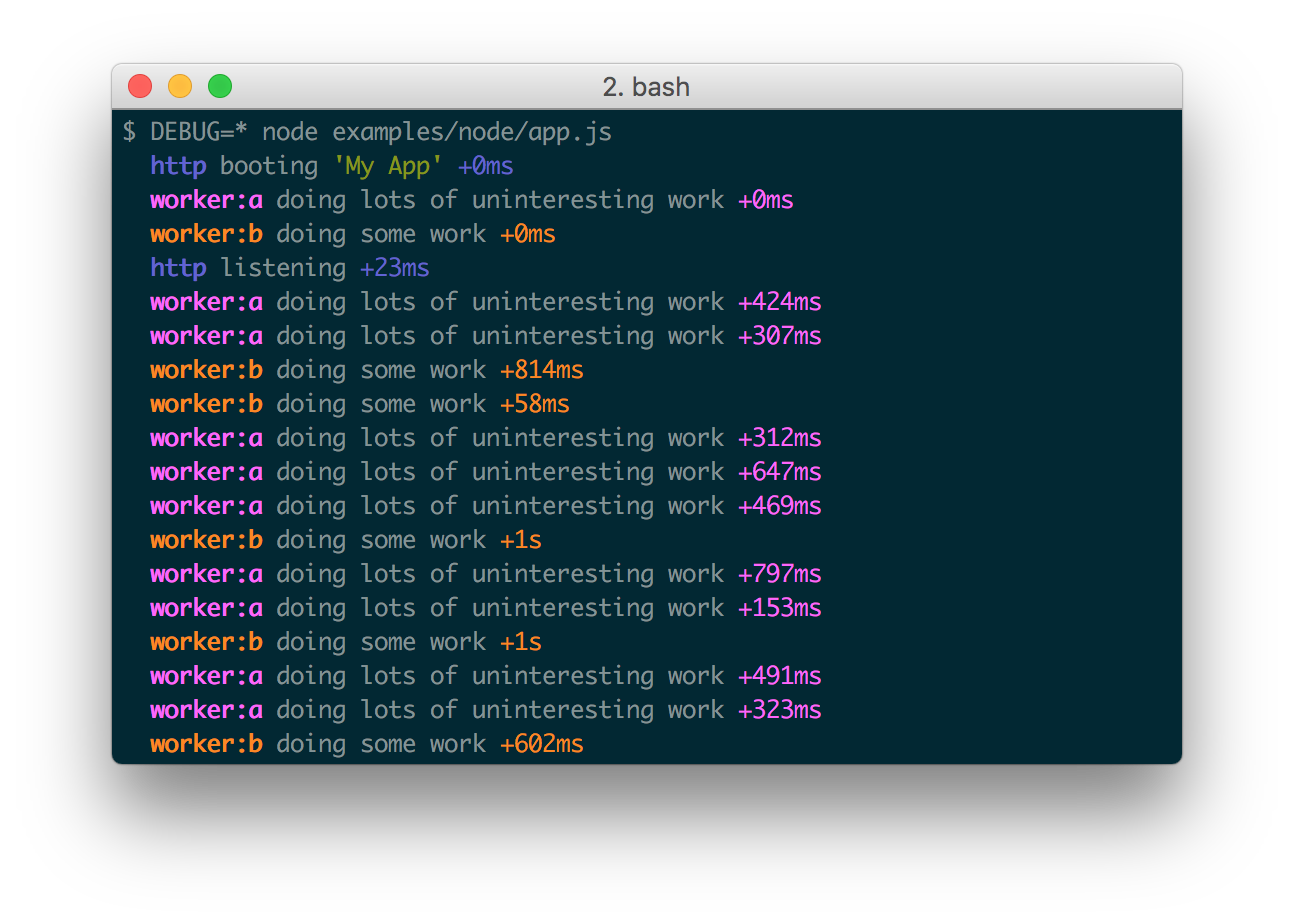
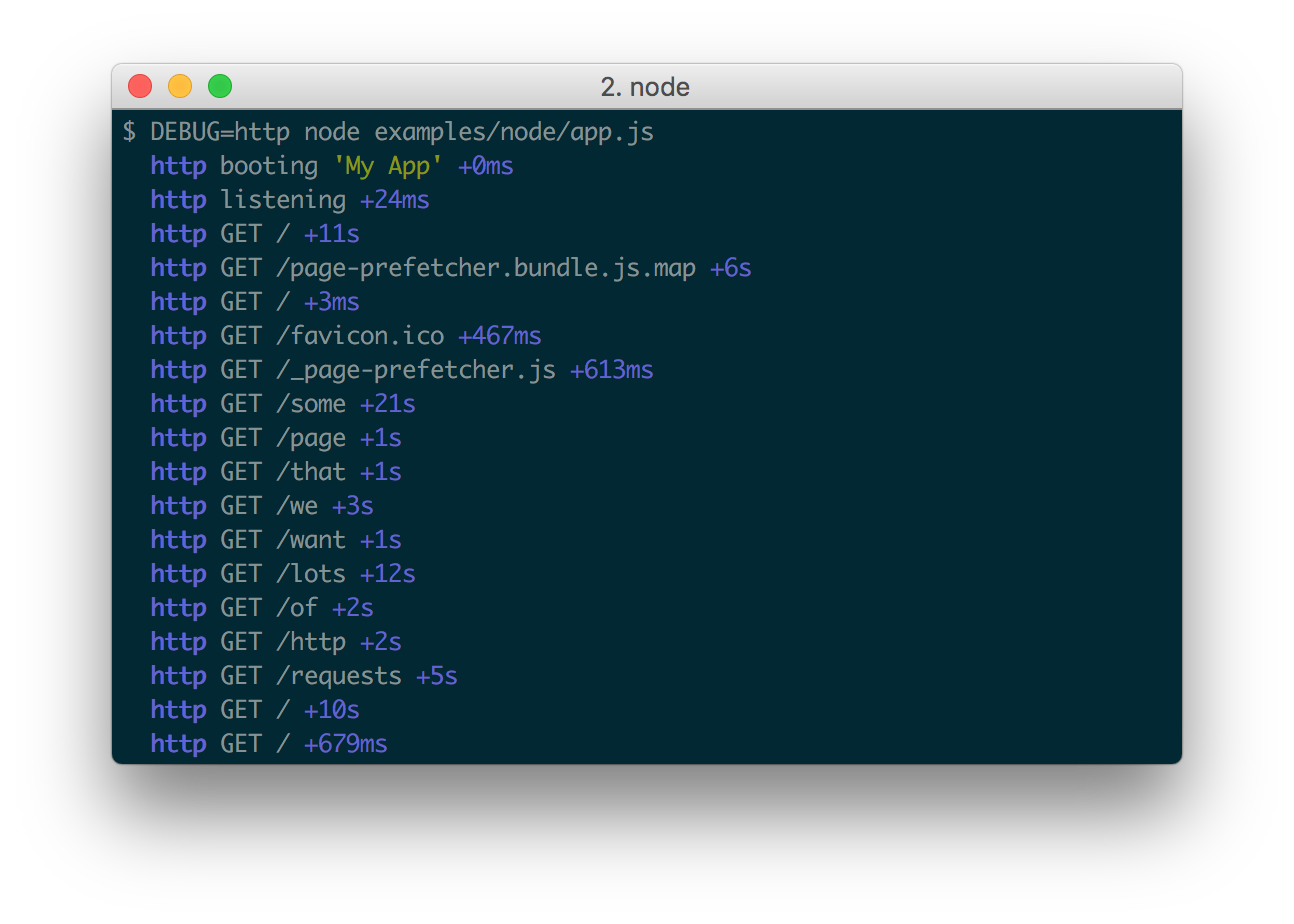
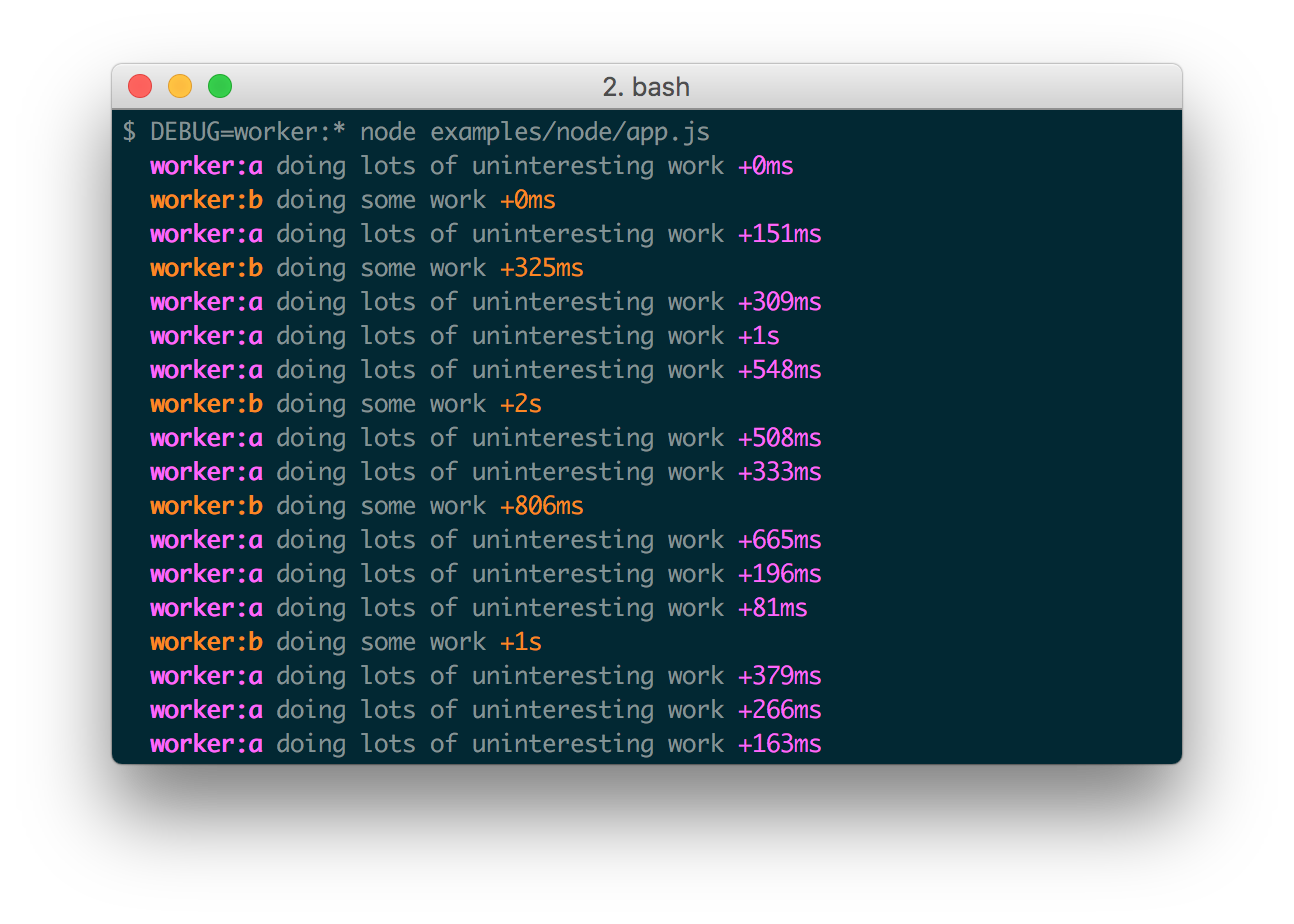
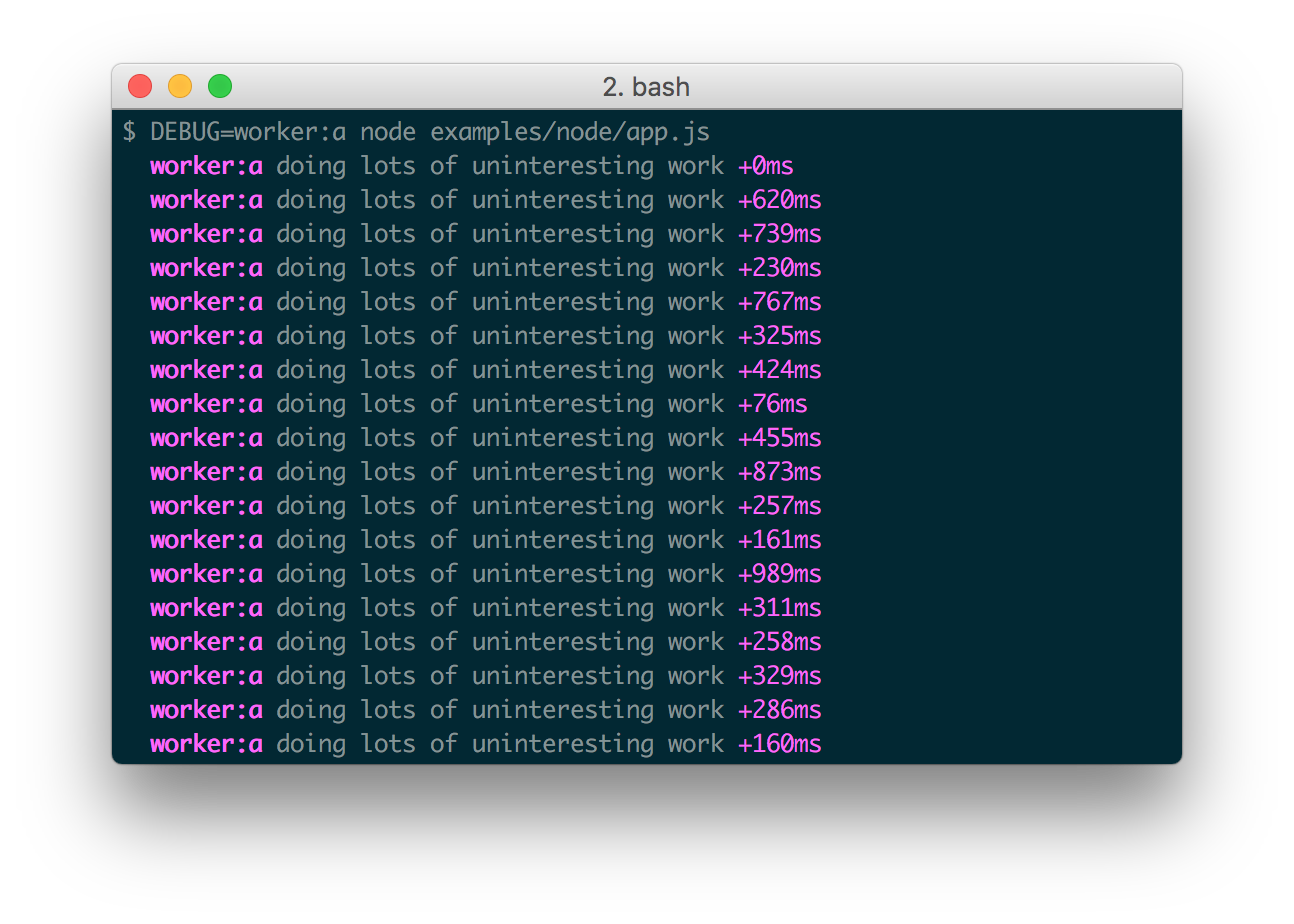
The DEBUG environment variable is then used to enable these based on space or
comma-delimited names.
Here are some examples:
Windows command prompt notes
CMD
On Windows the environment variable is set using the set command.
set DEBUG=*,-not_this
Example:
set DEBUG=* & node app.js
PowerShell (VS Code default)
PowerShell uses different syntax to set environment variables.
$env:DEBUG = "*,-not_this"
Example:
$env:DEBUG='app';node app.js
Then, run the program to be debugged as usual.
npm script example:
"windowsDebug": "@powershell -Command $env:DEBUG='*';node app.js",
Namespace Colors
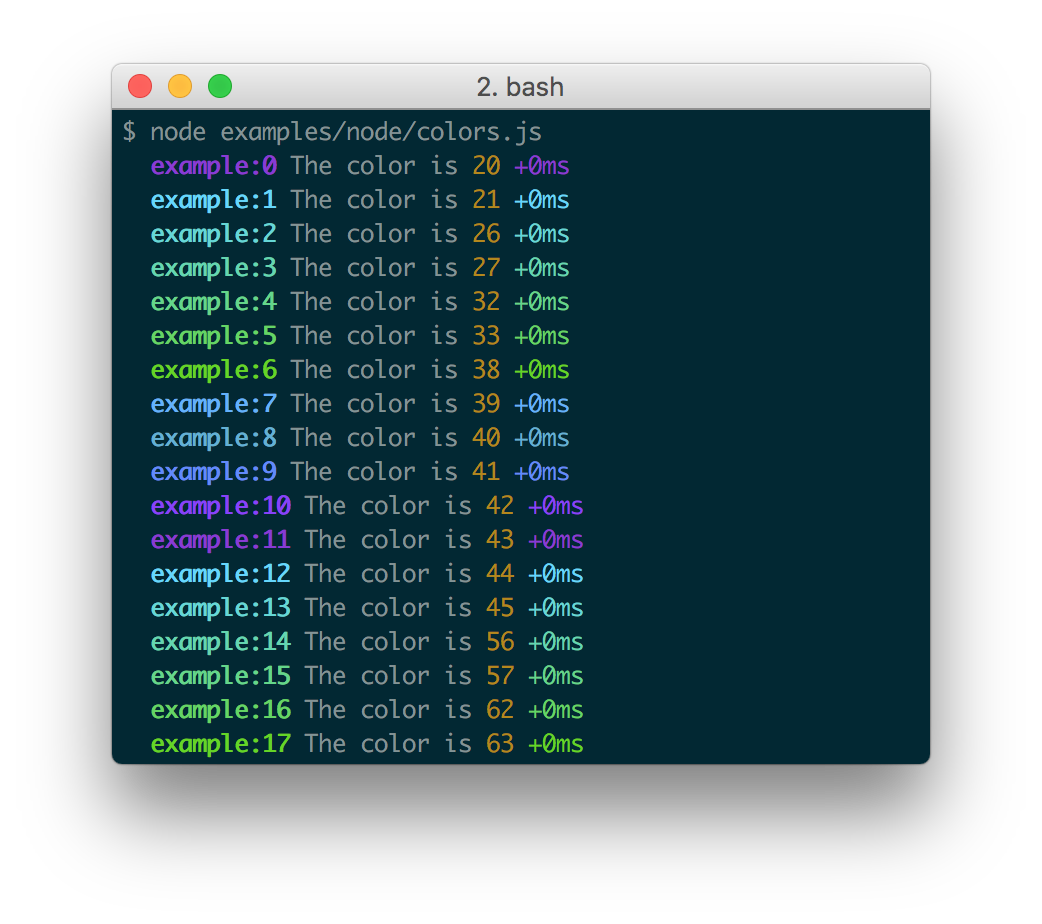
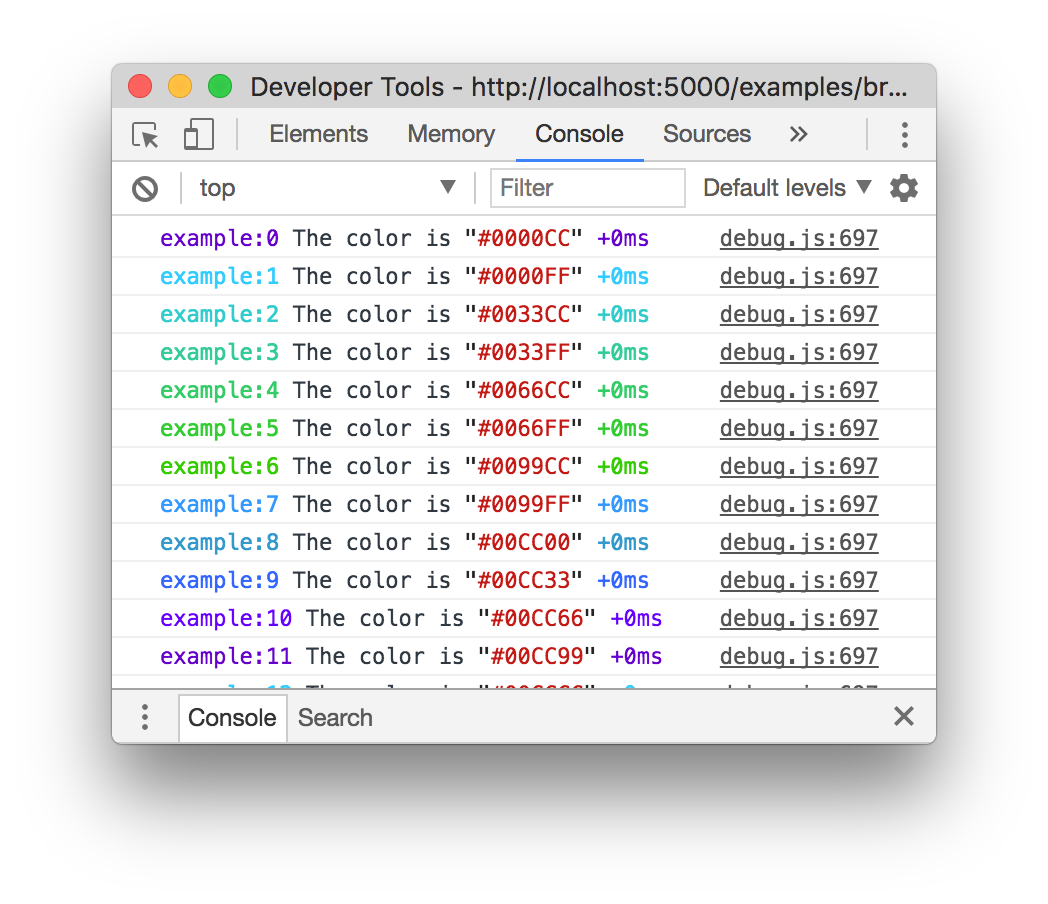
Every debug instance has a color generated for it based on its namespace name. This helps when visually parsing the debug output to identify which debug instance a debug line belongs to.
Node.js
In Node.js, colors are enabled when stderr is a TTY. You also should install
the supports-color module alongside debug,
otherwise debug will only use a small handful of basic colors.
Web Browser
Colors are also enabled on "Web Inspectors" that understand the %c formatting
option. These are WebKit web inspectors, Firefox (since version
31)
and the Firebug plugin for Firefox (any version).
Millisecond diff
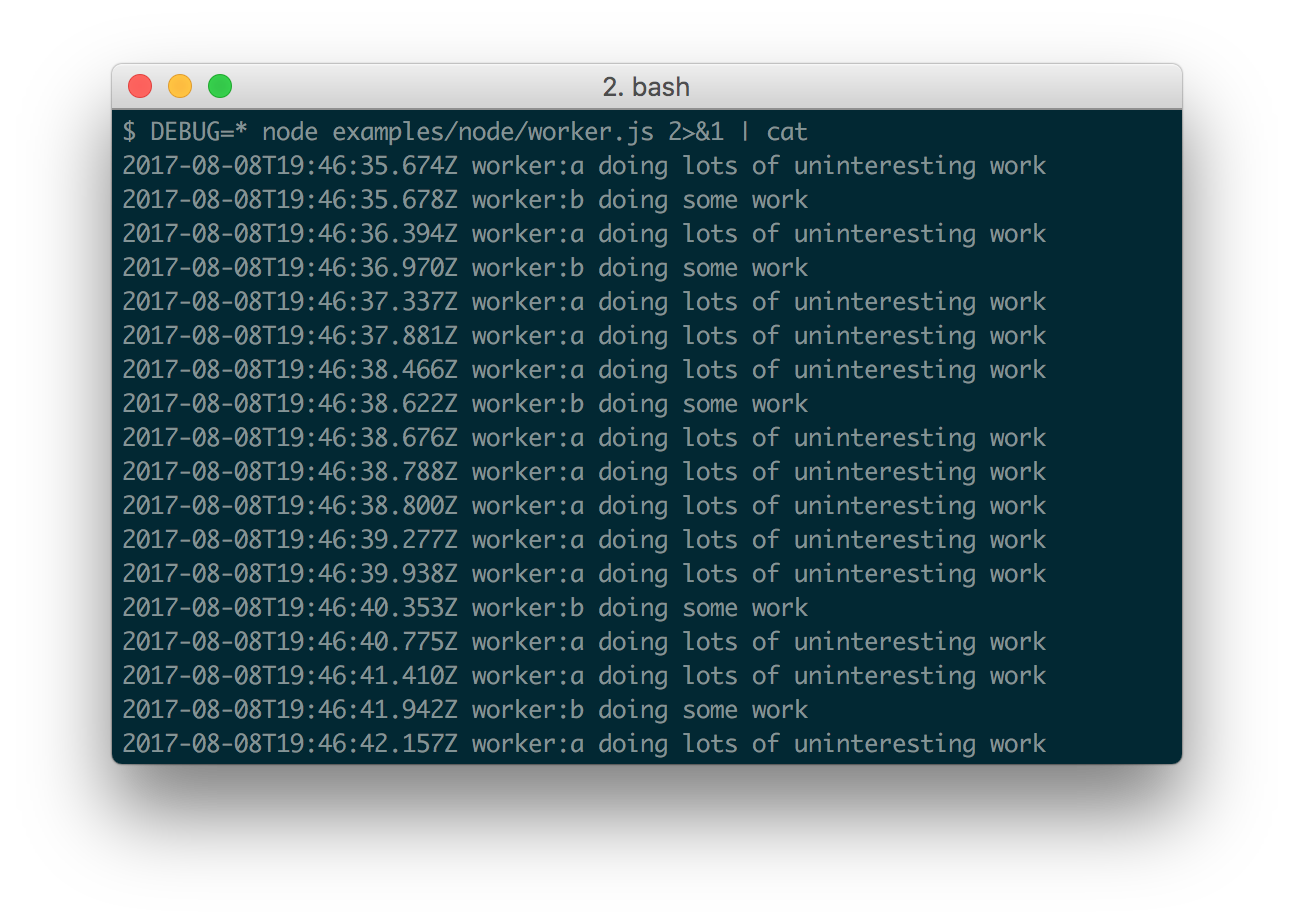
When actively developing an application it can be useful to see when the time spent between one debug() call and the next. Suppose for example you invoke debug() before requesting a resource, and after as well, the "+NNNms" will show you how much time was spent between calls.
When stdout is not a TTY, Date#toISOString() is used, making it more useful for logging the debug information as shown below:
Conventions
If you're using this in one or more of your libraries, you should use the name of your library so that developers may toggle debugging as desired without guessing names. If you have more than one debuggers you should prefix them with your library name and use ":" to separate features. For example "bodyParser" from Connect would then be "connect:bodyParser". If you append a "*" to the end of your name, it will always be enabled regardless of the setting of the DEBUG environment variable. You can then use it for normal output as well as debug output.
Wildcards
The * character may be used as a wildcard. Suppose for example your library has
debuggers named "connect:bodyParser", "connect:compress", "connect:session",
instead of listing all three with
DEBUG=connect:bodyParser,connect:compress,connect:session, you may simply do
DEBUG=connect:*, or to run everything using this module simply use DEBUG=*.
You can also exclude specific debuggers by prefixing them with a "-" character.
For example, DEBUG=*,-connect:* would include all debuggers except those
starting with "connect:".
Environment Variables
When running through Node.js, you can set a few environment variables that will change the behavior of the debug logging:
| Name | Purpose |
|---|---|
DEBUG |
Enables/disables specific debugging namespaces. |
DEBUG_HIDE_DATE |
Hide date from debug output (non-TTY). |
DEBUG_COLORS |
Whether or not to use colors in the debug output. |
DEBUG_DEPTH |
Object inspection depth. |
DEBUG_SHOW_HIDDEN |
Shows hidden properties on inspected objects. |
Note: The environment variables beginning with DEBUG_ end up being
converted into an Options object that gets used with %o/%O formatters.
See the Node.js documentation for
util.inspect()
for the complete list.
Formatters
Debug uses printf-style formatting. Below are the officially supported formatters:
| Formatter | Representation |
|---|---|
%O |
Pretty-print an Object on multiple lines. |
%o |
Pretty-print an Object all on a single line. |
%s |
String. |
%d |
Number (both integer and float). |
%j |
JSON. Replaced with the string '[Circular]' if the argument contains circular references. |
%% |
Single percent sign ('%'). This does not consume an argument. |
Custom formatters
You can add custom formatters by extending the debug.formatters object.
For example, if you wanted to add support for rendering a Buffer as hex with
%h, you could do something like:
const createDebug = require('debug')
createDebug.formatters.h = (v) => {
  return v.toString('hex')
}

// …elsewhere
const debug = createDebug('foo')
debug('this is hex: %h', new Buffer('hello world'))
//   foo this is hex: 68656c6c6f20776f726c6421 +0ms
Browser Support
You can build a browser-ready script using browserify, or just use the browserify-as-a-service build, if you don't want to build it yourself.
Debug's enable state is currently persisted by localStorage.
Consider the situation shown below where you have worker:a and worker:b,
and wish to debug both. You can enable this using localStorage.debug:
localStorage.debug = 'worker:*'
And then refresh the page.
a = debug('worker:a');
b = debug('worker:b');

setInterval(function(){
  a('doing some work');
}, 1000);

setInterval(function(){
  b('doing some work');
}, 1200);
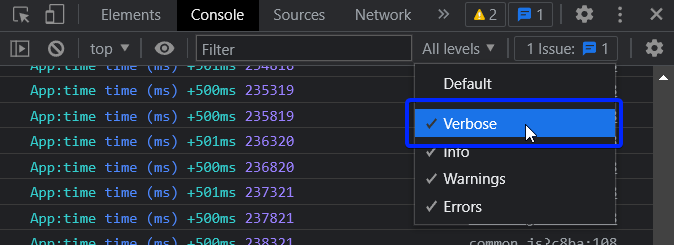
In Chromium-based web browsers (e.g. Brave, Chrome, and Electron), the JavaScript console will—by default—only show messages logged by debug if the "Verbose" log level is enabled.
Output streams
By default debug will log to stderr, however this can be configured per-namespace by overriding the log method:
Example stdout.js:
var debug = require('debug');
var error = debug('app:error');

// by default stderr is used
error('goes to stderr!');

var log = debug('app:log');
// set this namespace to log via console.log
log.log = console.log.bind(console); // don't forget to bind to console!
log('goes to stdout');
error('still goes to stderr!');

// set all output to go via c