chartdb is a free, open source databases project written in TypeScript and released under AGPL-3.0. It has 22,919 GitHub stars, 1,482 forks and 170 open issues, and was last pushed 5 days ago. On this registry it ranks #28 of 81 tracked projects in Databases, with 5 head-to-head comparisons available. It gained 10 stars over the last 3 tracked days.

What is chartdb?

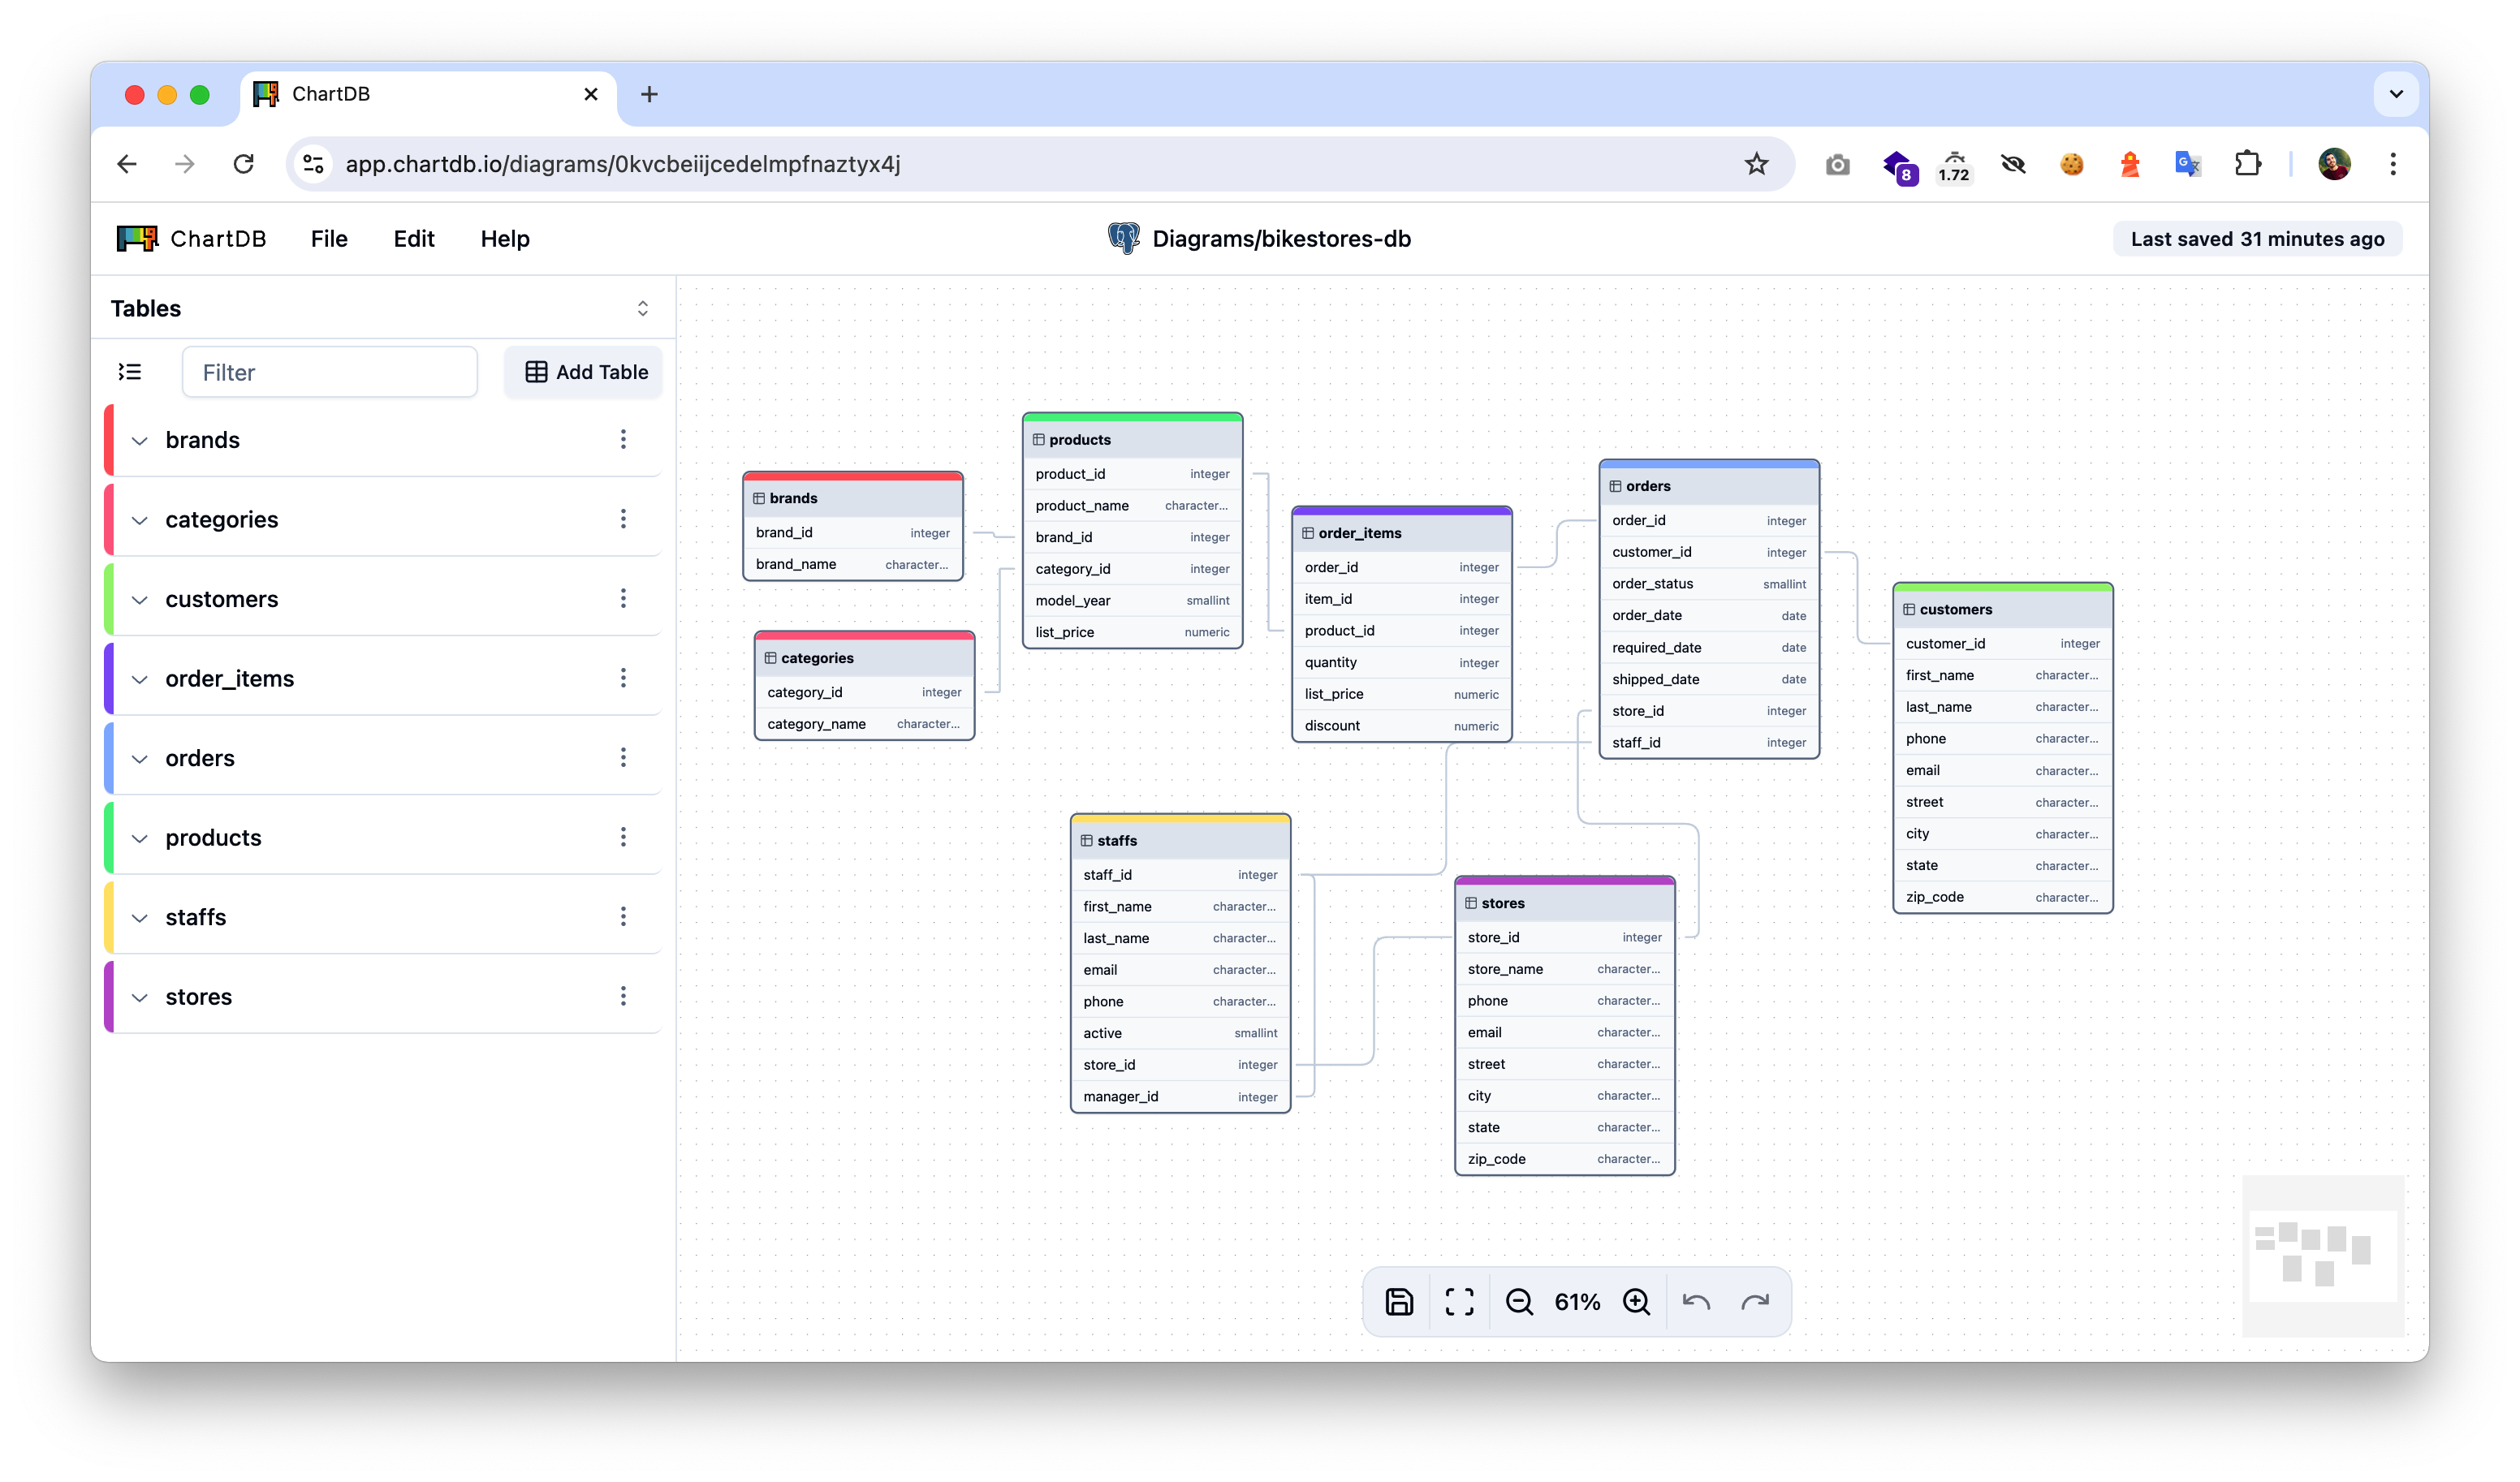
ChartDB is an open-source, web-based database diagram editor that visualizes and designs a database schema from a single SQL query, and it is built for developers, DBAs, and data teams who need entity-relationship diagrams without installing a desktop client or handing database credentials to a third-party service.

What it is

ChartDB is a TypeScript application that runs in the browser and turns a database schema into a diagram. It lives in the JavaScript and React ecosystem, with React Flow handling the interactive canvas, and it is published under the GNU Affero General Public License v3.0. The project is currently in Public Beta, distributed both as a hosted cloud application and as a self-deployable package. Instead of connecting to a database directly, ChartDB asks the user to run one query against their own database and paste the resulting JSON back into the editor.

The concrete problem it solves is the friction of getting a schema into a visual form. Conventional diagramming approaches require either a desktop installation or a live connection that demands a database password and network access. ChartDB removes both: no installation is required, no database password is required, and no account is required. It also replaces the slow manual work of documenting a schema by hand, and it replays that documentation back out as a DDL script when a migration or a handoff is needed.

Key capabilities

  • Smart Query schema import: run a single query, receive the schema as JSON, paste it into the editor to render the full diagram.
  • AI-powered DDL export that generates a script in the target dialect, covering moves such as MySQL to PostgreSQL or SQLite to MariaDB.
  • Interactive editing and annotation, so tables, relationships, and complex structures can be adjusted and labeled inside the diagram.
  • Broad engine coverage: PostgreSQL, MySQL, SQL Server, MariaDB, SQLite (including Cloudflare D1), CockroachDB, and ClickHouse.
  • Custom inference server support through VITE_OPENAI_API_ENDPOINT and VITE_LLM_MODEL_NAME, with a documented local vLLM example using Qwen/Qwen2.5-32B-Instruct-AWQ.
  • Docker deployment via the published image ghcr.io/chartdb/chartdb:latest, exposed on port 8080.
  • Privacy controls: analytics run through Fathom and can be turned off with DISABLE_ANALYTICS=true or VITE_DISABLE_ANALYTICS=true.

Who uses it and how

  • Teams documenting an existing production schema, where the diagram becomes a shared reference for onboarding and design discussions.
  • Engineers planning a migration between engines, using the AI export to produce a DDL script in the destination dialect.
  • DBAs and backend developers who want to inspect and annotate a schema without granting an external tool live database access.
  • Self-hosters who need the editor inside their own network and deploy it as a container or as a Node build.
  • Shops with an existing local model deployment, who point ChartDB at a vLLM endpoint instead of a public API.

Getting started

Use the hosted app at chartdb.io, or deploy locally. Local runs use npm install followed by npm run dev, or the Docker image ghcr.io/chartdb/chartdb:latest on port 8080; AI features require either OPENAI_API_KEY or the custom OPENAI_API_ENDPOINT and LLM_MODEL_NAME pair, and the two options must not be mixed.

How it compares

No comparable tools are named in the registry entry, so ChartDB stands alone here. Its differentiators are the AGPL-3.0 licence, the option to run entirely self-hosted from a public container image, and a data path in which the schema JSON is produced by the user's own database rather than by a vendor connection.

When to use it — and when not to

Choose ChartDB when the goal is a fast, credential-free diagram of an existing schema and a willingness to operate either a Node build or a Docker container. Self-hosters must supply that runtime themselves, and AI export depends on an external LLM, whether OpenAI or a self-run inference server. It is not the right pick for teams that need the AI migration path to work with no third-party model service at all, nor for those unwilling to accept the AGPL-3.0 licence or the project's Public Beta status.

project readme (upstream, from github) — read inline

ChartDB ChartDB

Open-source database diagrams editor
No installations • No Database password required.

CommunityWebsiteExamplesDemo

ChartDB is released under the AGPL license. PRs welcome! Discord community channel


🎉 ChartDB

ChartDB is a powerful, web-based database diagramming editor. Instantly visualize your database schema with a single "Smart Query." Customize diagrams, export SQL scripts, and access all features—no account required. Experience seamless database design here.

What it does:

  • Instant Schema Import Run a single query to instantly retrieve your database schema as JSON. This makes it incredibly fast to visualize your database schema, whether for documentation, team discussions, or simply understanding your data better.

  • AI-Powered Export for Easy Migration Our AI-driven export feature allows you to generate the DDL script in the dialect of your choice. Whether you're migrating from MySQL to PostgreSQL or from SQLite to MariaDB, ChartDB simplifies the process by providing the necessary scripts tailored to your target database.

  • Interactive Editing Fine-tune your database schema using our intuitive editor. Easily make adjustments or annotations to better visualize complex structures.

Status

ChartDB is currently in Public Beta. Star and watch this repository to get notified of updates.

Supported Databases

  • ✅ PostgreSQL ( + + )
  • ✅ MySQL
  • ✅ SQL Server
  • ✅ MariaDB
  • ✅ SQLite ( + Cloudflare D1)
  • ✅ CockroachDB
  • ✅ ClickHouse

Getting Started

Use the cloud version or deploy locally:

How To Use

npm install
npm run dev

Build

npm install
npm run build

Or like this if you want to have AI capabilities:

npm install
VITE_OPENAI_API_KEY=<YOUR_OPEN_AI_KEY> npm run build

Run the Docker Container

docker run -e OPENAI_API_KEY=<YOUR_OPEN_AI_KEY> -p 8080:80 ghcr.io/chartdb/chartdb:latest
Build and Run locally
docker build -t chartdb .
docker run -e OPENAI_API_KEY=<YOUR_OPEN_AI_KEY> -p 8080:80 chartdb
Using Custom Inference Server
# Build
docker build \
  --build-arg VITE_OPENAI_API_ENDPOINT=<YOUR_ENDPOINT> \
  --build-arg VITE_LLM_MODEL_NAME=<YOUR_MODEL_NAME> \
  -t chartdb .

# Run
docker run \
  -e OPENAI_API_ENDPOINT=<YOUR_ENDPOINT> \
  -e LLM_MODEL_NAME=<YOUR_MODEL_NAME> \
  -p 8080:80 chartdb

Privacy Note: ChartDB includes privacy-focused analytics via Fathom Analytics. You can disable this by adding -e DISABLE_ANALYTICS=true to the run command or --build-arg VITE_DISABLE_ANALYTICS=true when building.

Note: You must configure either Option 1 (OpenAI API key) OR Option 2 (Custom endpoint and model name) for AI capabilities to work. Do not mix the two options.

Open your browser and navigate to http://localhost:8080.

Example configuration for a local vLLM server:

VITE_OPENAI_API_ENDPOINT=http://localhost:8000/v1
VITE_LLM_MODEL_NAME=Qwen/Qwen2.5-32B-Instruct-AWQ

Try it on our website

  1. Go to ChartDB.io
  2. Click "Go to app"
  3. Choose the database that you are using.
  4. Take the magic query and run it in your database.
  5. Copy and paste the resulting JSON set into ChartDB.
  6. Enjoy Viewing & Editing!

💚 Community & Support

  • Discord (For live discussion with the community and the ChartDB team)
  • GitHub Issues (For any bugs and errors you encounter using ChartDB)
  • Twitter (Get news fast)

Contributing

We welcome community contributions, big or small, and are here to guide you along the way. Message us in the ChartDB Community Discord.

For more information on how to contribute, please see our Contributing Guide.

This project is released with a Contributor Code of Conduct. By participating in this project, you agree to follow its terms.

Thank you for helping us make ChartDB better for everyone :heart:.

License

ChartDB is licensed under the GNU Affero General Public License v3.0

Frequently asked questions

Is chartdb free to use?

chartdb is open source under the AGPL-3.0 licence. There is no licence fee and no seat count — you can self-host it or, where the project offers one, pay a vendor for a managed version instead.

What does chartdb do?

Database diagrams editor that allows you to visualize and design your DB with a single query.

What is chartdb written in?

chartdb is primarily written in TypeScript. Its source is publicly available at https://github.com/chartdb/chartdb, and it has 22,919 GitHub stars.