Bklit UI is an MIT-licensed collection of open-source React charts and utility components, distributed as a shadcn registry for TypeScript teams that want to copy visualization code into their own projects and extend it.
What it is
Bklit UI is a library of chart components and utility components written in TypeScript, published as a shadcn registry rather than as a conventional npm package that you import and version. The registry contains fourteen named chart components: Area Chart, Bar Chart, Candlestick Chart, Choropleth Chart, Composed Chart, Funnel Chart, Gauge, Line Chart, Live Line Chart, Pie Chart, Radar Chart, Ring Chart, Scatter Chart, and Sankey Chart. The repository is organised into packages/ui (the chart components that ship through the shadcn registry) and packages/studio (the interactive playground hosted at ui.bklit.com/studio). The project builds on Base UI, visx, and motion, and its topics place it firmly in the React, shadcn-ui, and data-visualization ecosystems.
The concrete problem it solves is the gap between a charting dependency and a chart you actually control. Installing a registry component with npx shadcn@latest add @bklit/line-chart places the component source directly into the project, so styling, animation, and markup can be edited in place instead of being overridden through a third-party API. In that sense it replaces the pattern of importing an opaque, versioned chart package that resists local modification, and it substitutes for hand-building individual chart types against visx or Base UI primitives. Each chart entry links to both documentation and the Studio, so the path from "pick a chart" to "own the code" is short.
Key capabilities
- Fourteen chart types covering Area, Bar, Candlestick, Choropleth, Composed, Funnel, Gauge, Line, Live Line, Pie, Radar, Ring, Scatter, and Sankey.
- Distribution as a shadcn registry, added with
npx shadcn@latest add @bklit/line-chart after npx shadcn@latest init.
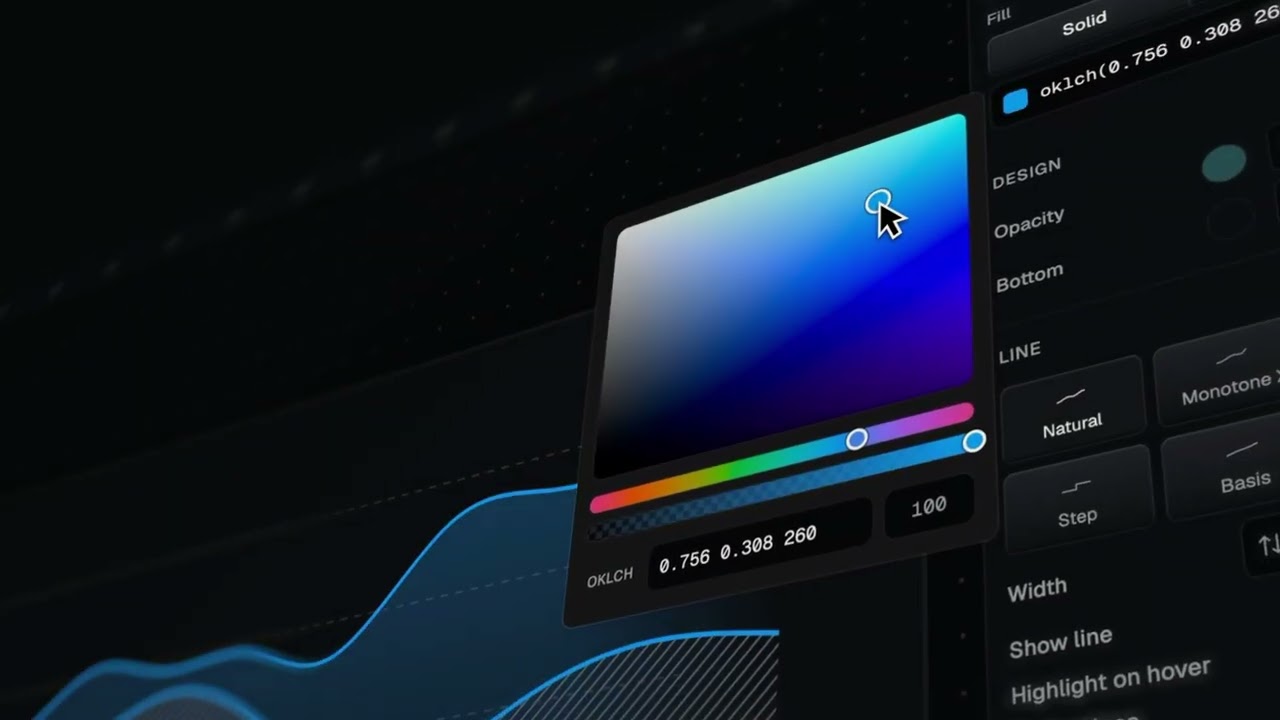
- Bklit Studio, an interactive chart playground where styling and animation controls are adjusted in real time.
- Studio exports: generated React code for direct use, or a registry JSON for a project.
- Built on Base UI, visx, and motion, per the repository topics.
- MIT licence covering the chart components in
packages/ui and the shadcn registry.
- A separate
LICENSE-STUDIO.md governing the proprietary packages/studio code.
Who uses it and how
- React and TypeScript product teams already standardised on shadcn-ui, who add chart components through the registry they already use for other UI parts.
- Developers who prefer to own component source, since registry installation writes the chart into the repository rather than hiding it behind an import.
- Designers and front-end engineers iterating on chart styling and animation in Studio, then copying the generated React code into the project.
- Teams that need less common visualisations, such as Sankey, Choropleth, Candlestick, or Gauge, which are offered as first-class named entries rather than add-ons.
- Projects with a strict licence posture, because the chart components are MIT while the hosted Studio remains proprietary and separately licensed.
Getting started
Initialise shadcn in the project with npx shadcn@latest init, then add a component with npx shadcn@latest add @bklit/line-chart. The Studio playground is available directly at ui.bklit.com/studio, and the project homepage is bklit.com.
How it compares
The facts do not supply a list of paid products this project replaces, so comparison rests on the tools named in the repository: Base UI, visx, and motion, all of which Bklit UI builds on, plus the shadcn registry it distributes through. Against those, Bklit UI positions itself as the assembled output rather than the primitives, offering ready chart components in the same registry mechanism shadcn users already run. It therefore sits alongside shadcn-style component registries rather than competing with the underlying rendering libraries it depends on.
When to use it — and when not to
Adopt it when the project is a React and TypeScript codebase already using shadcn, and when owning chart source matters more than receiving automatic upstream updates through a package manager. Do not adopt it if the intent is to reuse, resell, or redistribute Bklit Studio, which is proprietary and explicitly restricted by LICENSE-STUDIO.md without written permission. Note also that self-hosting nothing is required for the registry components, but the repository README is short and points outward to ui.bklit.com for installation detail, so teams wanting extensive in-repo documentation should check the external docs first.