ali is a free, open source monitoring & observability project written in Go and released under MIT. It has 3,939 GitHub stars, 151 forks and 25 open issues, and was last pushed 8 months ago. On this registry it ranks #105 of 271 tracked projects in Monitoring & Observability, with 5 head-to-head comparisons available.

What is ali?

ali is a Go command-line load-testing tool that generates HTTP traffic against a target and plots the resulting metrics live in an embedded terminal UI, built for developers and operators who need to watch how a service behaves while the load is still running instead of reading a report afterwards.

What it is

ali lives in the Go CLI and terminal-UI ecosystem and ships as a single binary through binary releases, Homebrew, MacPorts, APT, RPM, Pacman, APK, a Docker image named nakabonne/ali, and go install. It is inspired by vegeta and jplot. The tool issues HTTP requests at a chosen rate for a chosen duration against one or more targets, and draws latency and related charts inside the terminal while the attack is in progress.

The concrete problem it solves is the gap between load generation and load interpretation. In the vegeta and jplot lineage, vegeta produces the traffic and writes result data, and jplot turns that data into plots afterwards, so the workflow is two tools and one batch step. ali merges both halves into one process and one view, so a rate change can be made and its effect on latency observed in the same terminal session without exporting, re-plotting, or waiting for the run to finish.

Key capabilities

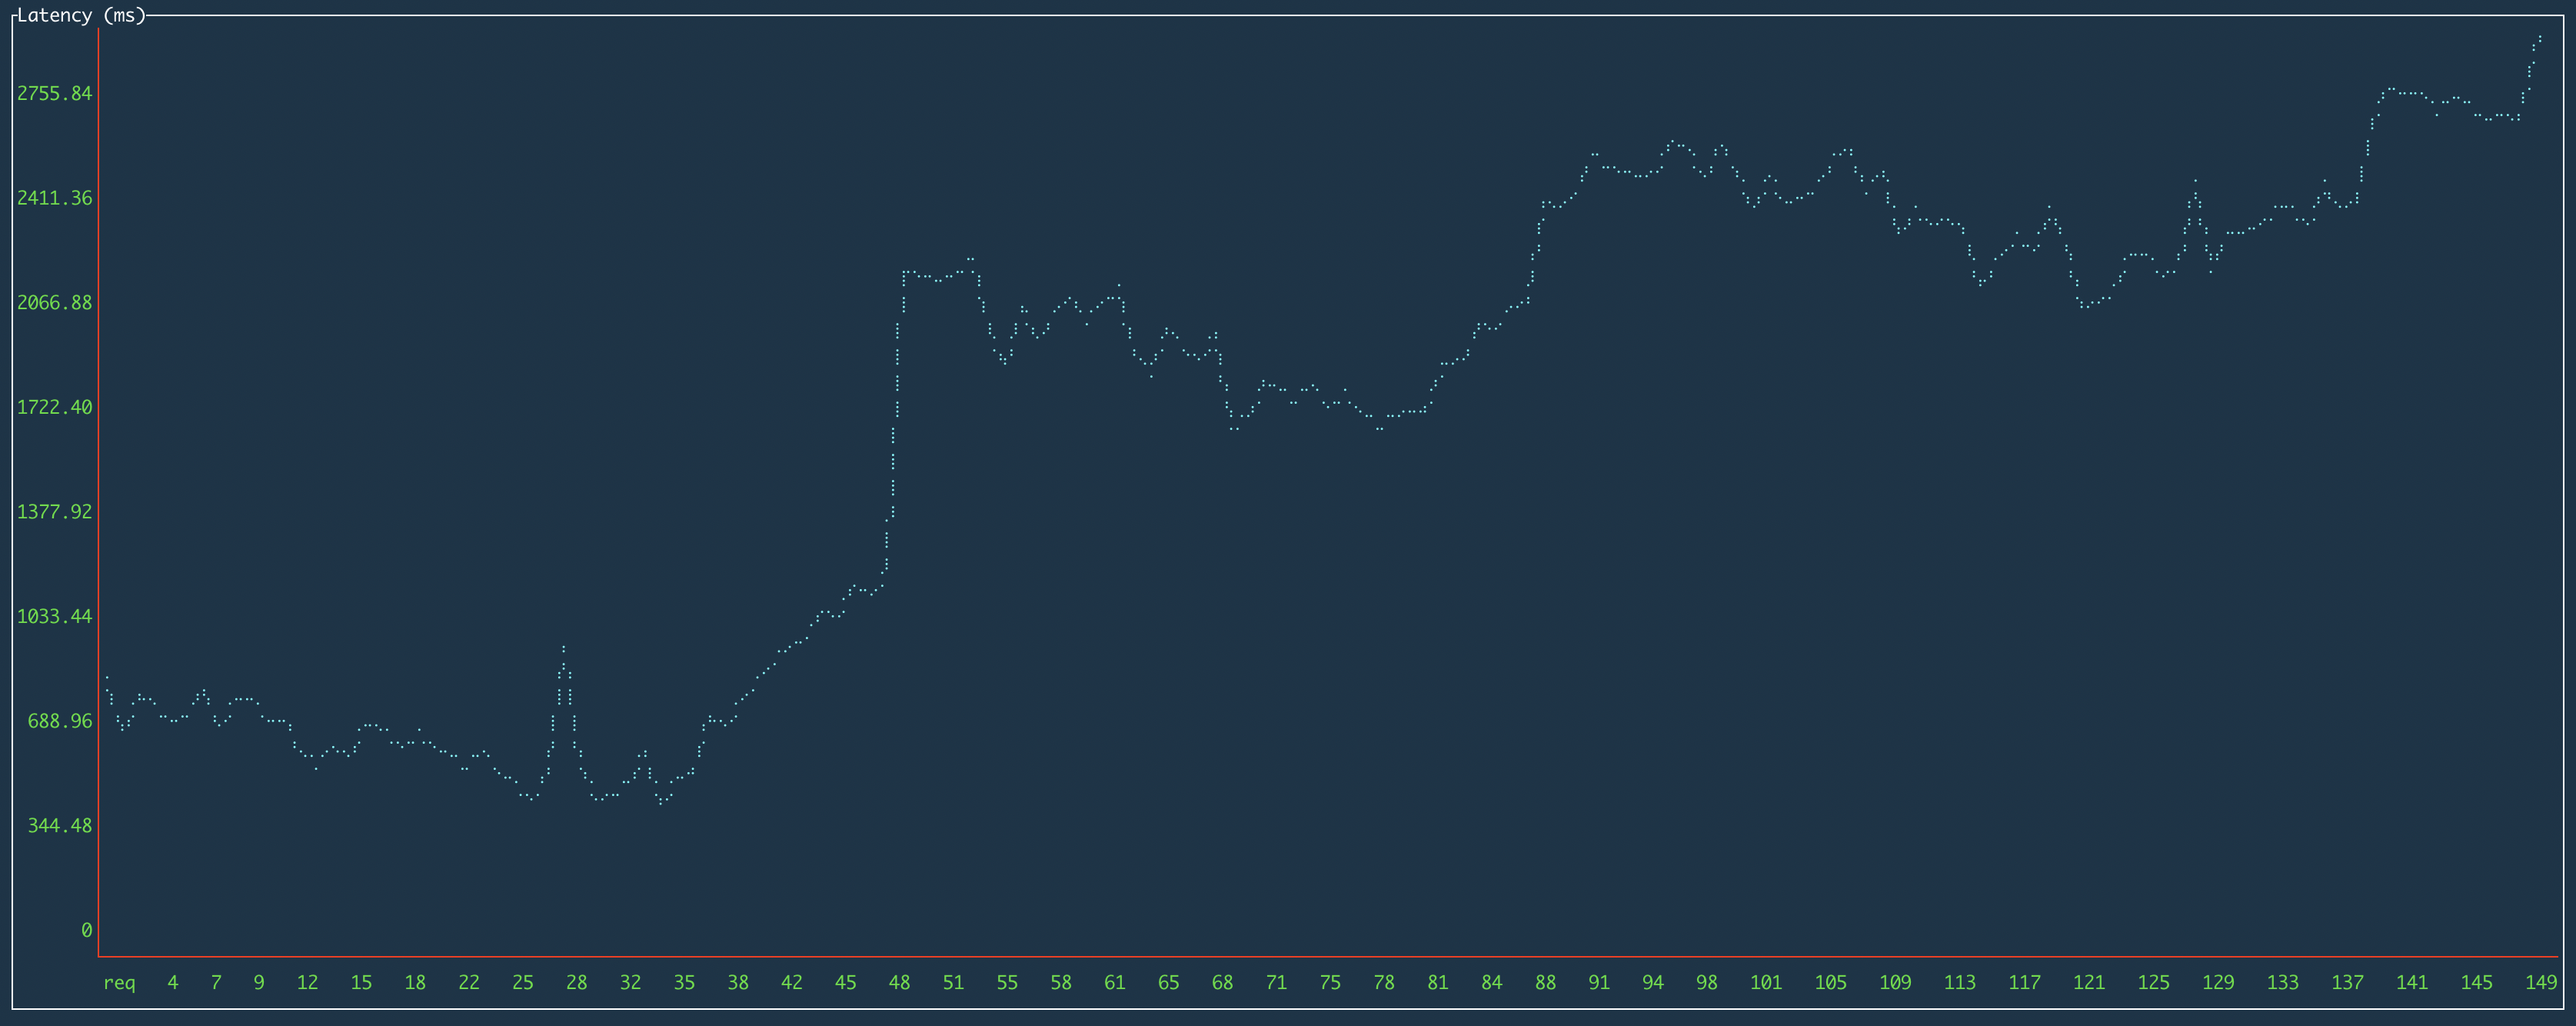
  • Embedded terminal UI charts; press l (or h) to switch the displayed chart, and click and drag on any chart to select a region and zoom in. The latency chart plots request counts on the X-axis.
  • Attack control through --rate and --duration, where --duration=0 produces an infinite attack and valid time units are ns, us, ms, s, m, and h.
  • Request shaping through --method (default GET), --body, --body-file, and -H/--header, which can be repeated to send multiple headers.
  • TLS handling through --cert, --key, --cacert, --insecure, and --no-http2.
  • Connection and concurrency tuning through -c/--connections (default 10000), -w/--workers (default 10), -W/--max-workers, -K/--no-keepalive, and --resolvers for a comma-separated list of custom DNS resolver addresses.
  • Result capture through --export-to, which writes results to a given directory, plus --query-range (default 30s), --redraw-interval (default 250ms), -M/--max-body (default -1 for no limit), and -t/--timeout (default 30s).

Who uses it and how

  • Developers benchmarking a local or staging HTTP endpoint from a laptop, for example ali --rate=500 --duration=5m http://host.xz.
  • Engineers running a quick interactive check by starting ali http://host.xz, pressing Enter when the UI appears, and letting the default rate of 50 requests per second run for 10 seconds.
  • Operators running soak or long-haul tests with --duration=0, watching latency drift rather than a fixed burst.
  • Teams testing JSON APIs that need a POST load profile, using --body-file=/path/to/foo.json together with --method=POST.
  • Environments installing from a system package manager, including Pacman, APT, RPM, and APK after enabling the Alpine community repository, or Docker where no package exists.

Getting started

Install through the package manager of choice, such as brew install nakabonne/ali/ali, or run the container with docker run --rm -it nakabonne/ali ali. Then point it at a target with ali http://host.xz and press Enter in the UI to start the attack with default options.

How it compares

The only comparable tools named in the facts are vegeta and jplot, which ali cites as its inspiration. vegeta covers load generation and jplot covers plotting after the fact, so ali differs by folding generation and real-time visualisation into one binary and one terminal. It stands alongside those tools rather than replacing their output pipelines.

When to use it — and when not to

ali is a single binary with no server component, database, or message queue to operate, so the running cost is essentially the terminal session and the machine issuing the traffic. It is a poor fit for teams that need distributed load generation from many machines, and for pipelines that require scripted assertions against machine-readable results, since the provided facts document only --export-to as a directory target without a stated output format. The go install path also carries a documented caveat that it may download an untagged binary.

project readme (upstream, from github) — read inline

ali

Release Go Reference

A load testing tool capable of performing real-time analysis, inspired by vegeta and jplot.
Screenshot

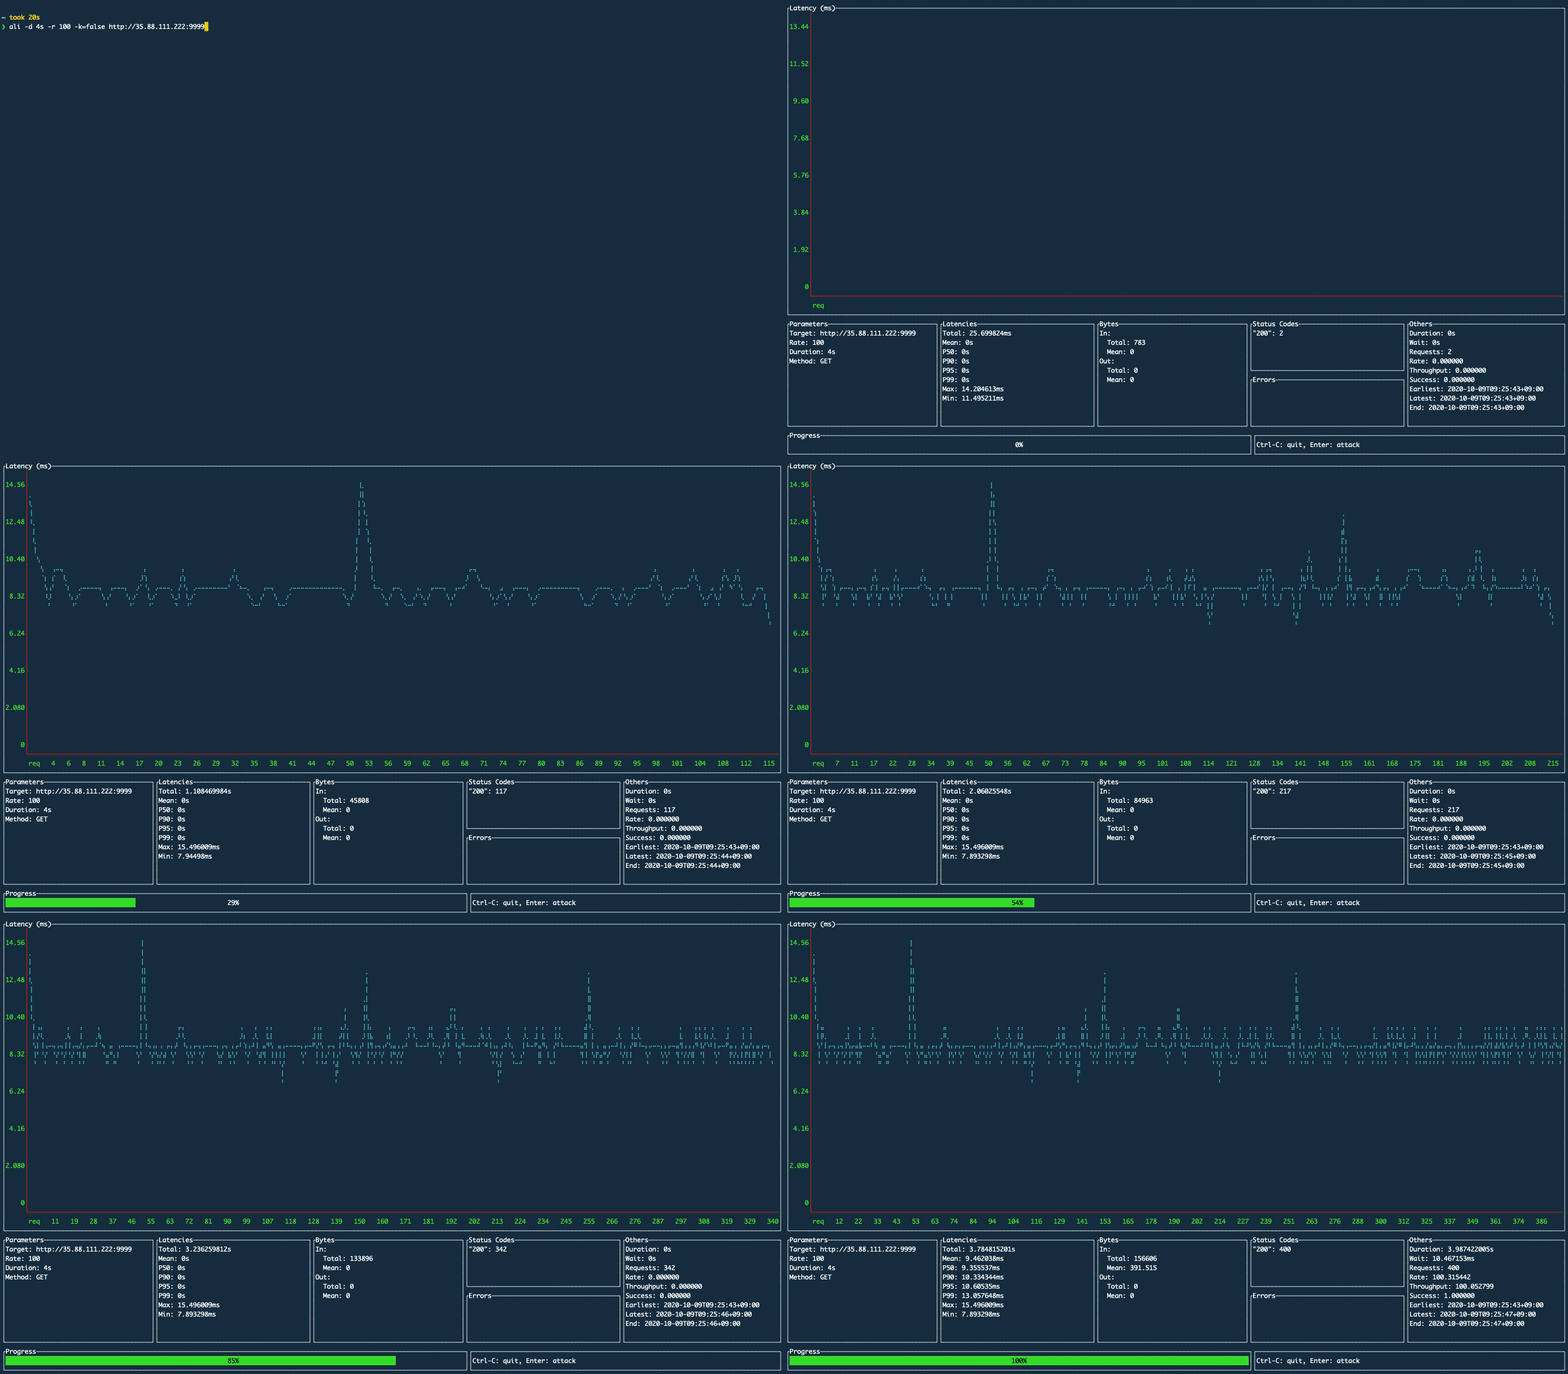
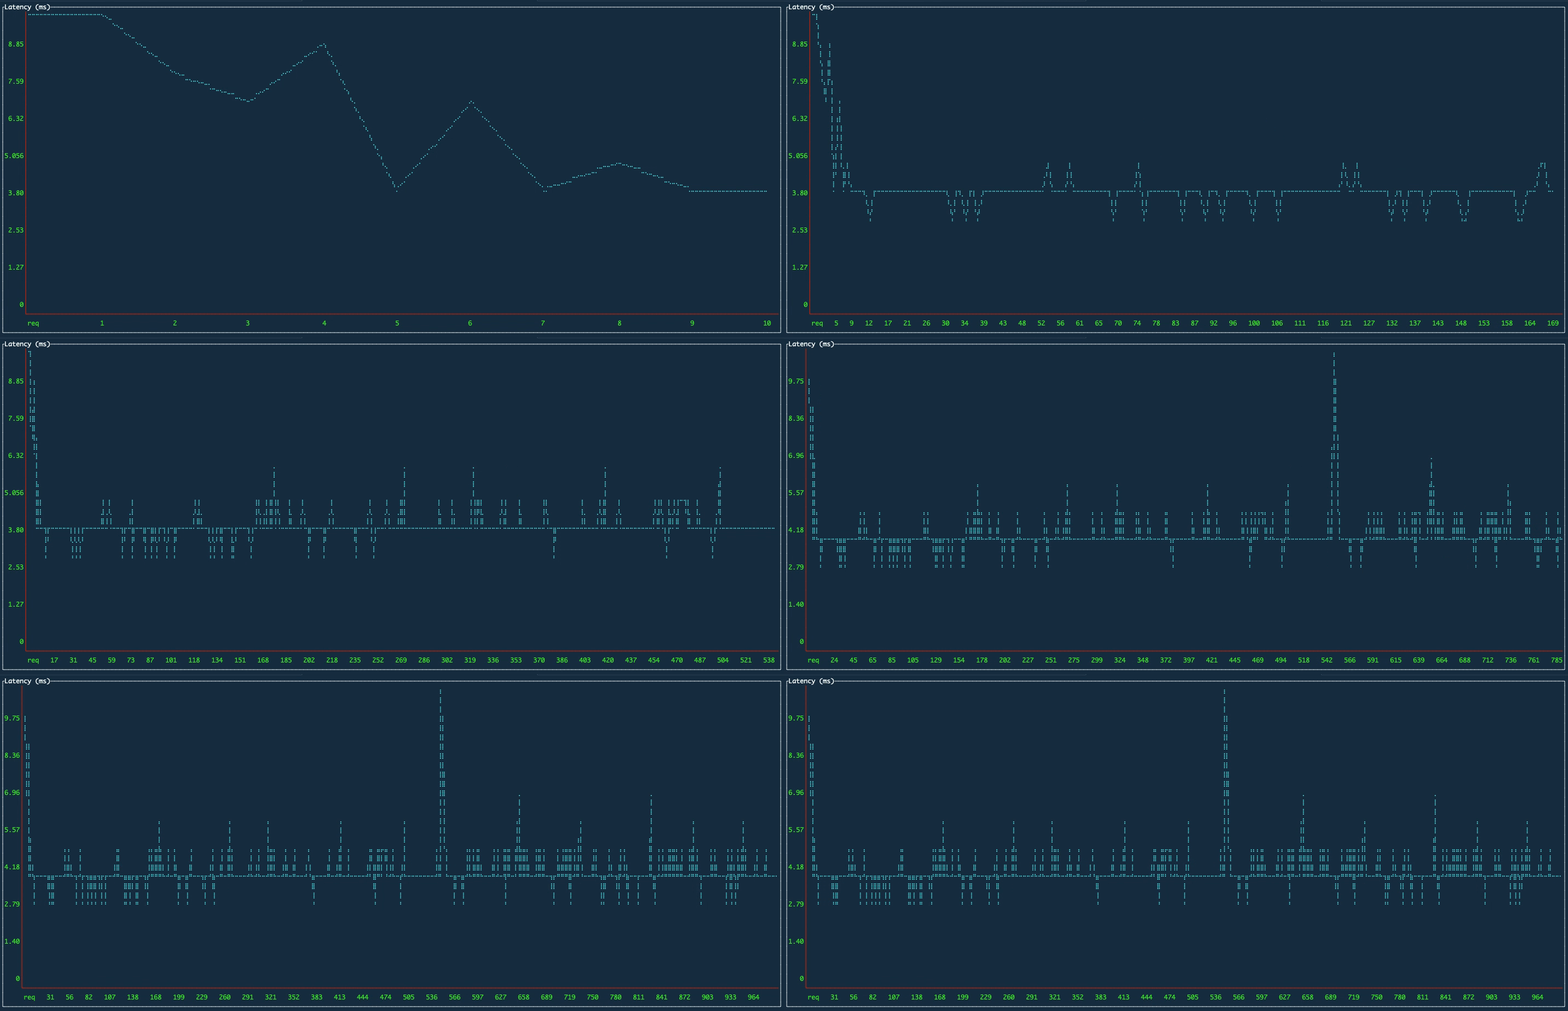
ali comes with an embedded terminal-based UI where you can plot the metrics in real-time, so lets you perform real-time analysis on the terminal.

Installation

Binary releases are available through here.

Via Homebrew

brew install nakabonne/ali/ali

Via MacPorts

sudo port selfupdate
sudo port install ali

Via APT

wget https://github.com/nakabonne/ali/releases/download/v0.7.3/ali_0.7.3_linux_amd64.deb
apt install ./ali_0.7.3_linux_amd64.deb

Via RPM

rpm -ivh https://github.com/nakabonne/ali/releases/download/v0.7.3/ali_0.7.3_linux_amd64.rpm

Via Pacman

pacman -S ali

Via APK

After enabling the community repo:

apk add ali

Via Go

Note that you may have a problem because it downloads an untagged binary.

go install github.com/nakabonne/ali@latest

Via Docker

docker run --rm -it nakabonne/ali ali

Usage

Quickstart

ali http://host.xz

Replace http://host.xz with the target you want to issue the requests to. Press Enter when the UI appears, then the attack will be launched with default options (rate=50, duration=10s).

Options

ali -h
Usage:
  ali [flags] <target URL>

Flags:
  -b, --body string                A request body to be sent.
  -B, --body-file string           The path to file whose content will be set as the http request body.
      --cacert string              PEM ca certificate file
      --cert string                PEM encoded tls certificate file to use
  -c, --connections int            Amount of maximum open idle connections per target host (default 10000)
      --debug                      Run in debug mode.
  -d, --duration duration          The amount of time to issue requests to the targets. Give 0s for an infinite attack. (default 10s)
      --export-to string           Export results to the given directory
  -H, --header stringArray         A request header to be sent. Can be used multiple times to send multiple headers.
      --insecure                   Skip TLS verification
      --key string                 PEM encoded tls private key file to use
      --local-addr string          Local IP address. (default "0.0.0.0")
  -M, --max-body int               Max bytes to capture from response bodies. Give -1 for no limit. (default -1)
  -W, --max-workers uint           Amount of maximum workers to spawn. (default 18446744073709551615)
  -m, --method string              An HTTP request method for each request. (default "GET")
      --no-http2                   Don't issue HTTP/2 requests to servers which support it.
  -K, --no-keepalive               Don't use HTTP persistent connection.
      --query-range duration       The results within the given time range will be drawn on the charts (default 30s)
  -r, --rate int                   The request rate per second to issue against the targets. Give 0 then it will send requests as fast as possible. (default 50)
      --redraw-interval duration   Specify how often it redraws the screen (default 250ms)
      --resolvers string           Custom DNS resolver addresses; comma-separated list.
  -t, --timeout duration           The timeout for each request. 0s means to disable timeouts. (default 30s)
  -v, --version                    Print the current version.
  -w, --workers uint               Amount of initial workers to spawn. (default 10)

Examples:
  ali --duration=10m --rate=100 http://host.xz

Author:
  Ryo Nakao <[email protected]>

Valid time units are "ns", "us" (or "µs"), "ms", "s", "m", "h".

Examples

For basic usage:

ali --rate=500 --duration=5m http://host.xz

For an infinite attack:

ali --duration=0 http://host.xz

For an attack with the POST method:

ali --body-file=/path/to/foo.json --method=POST http://host.xz

Charts

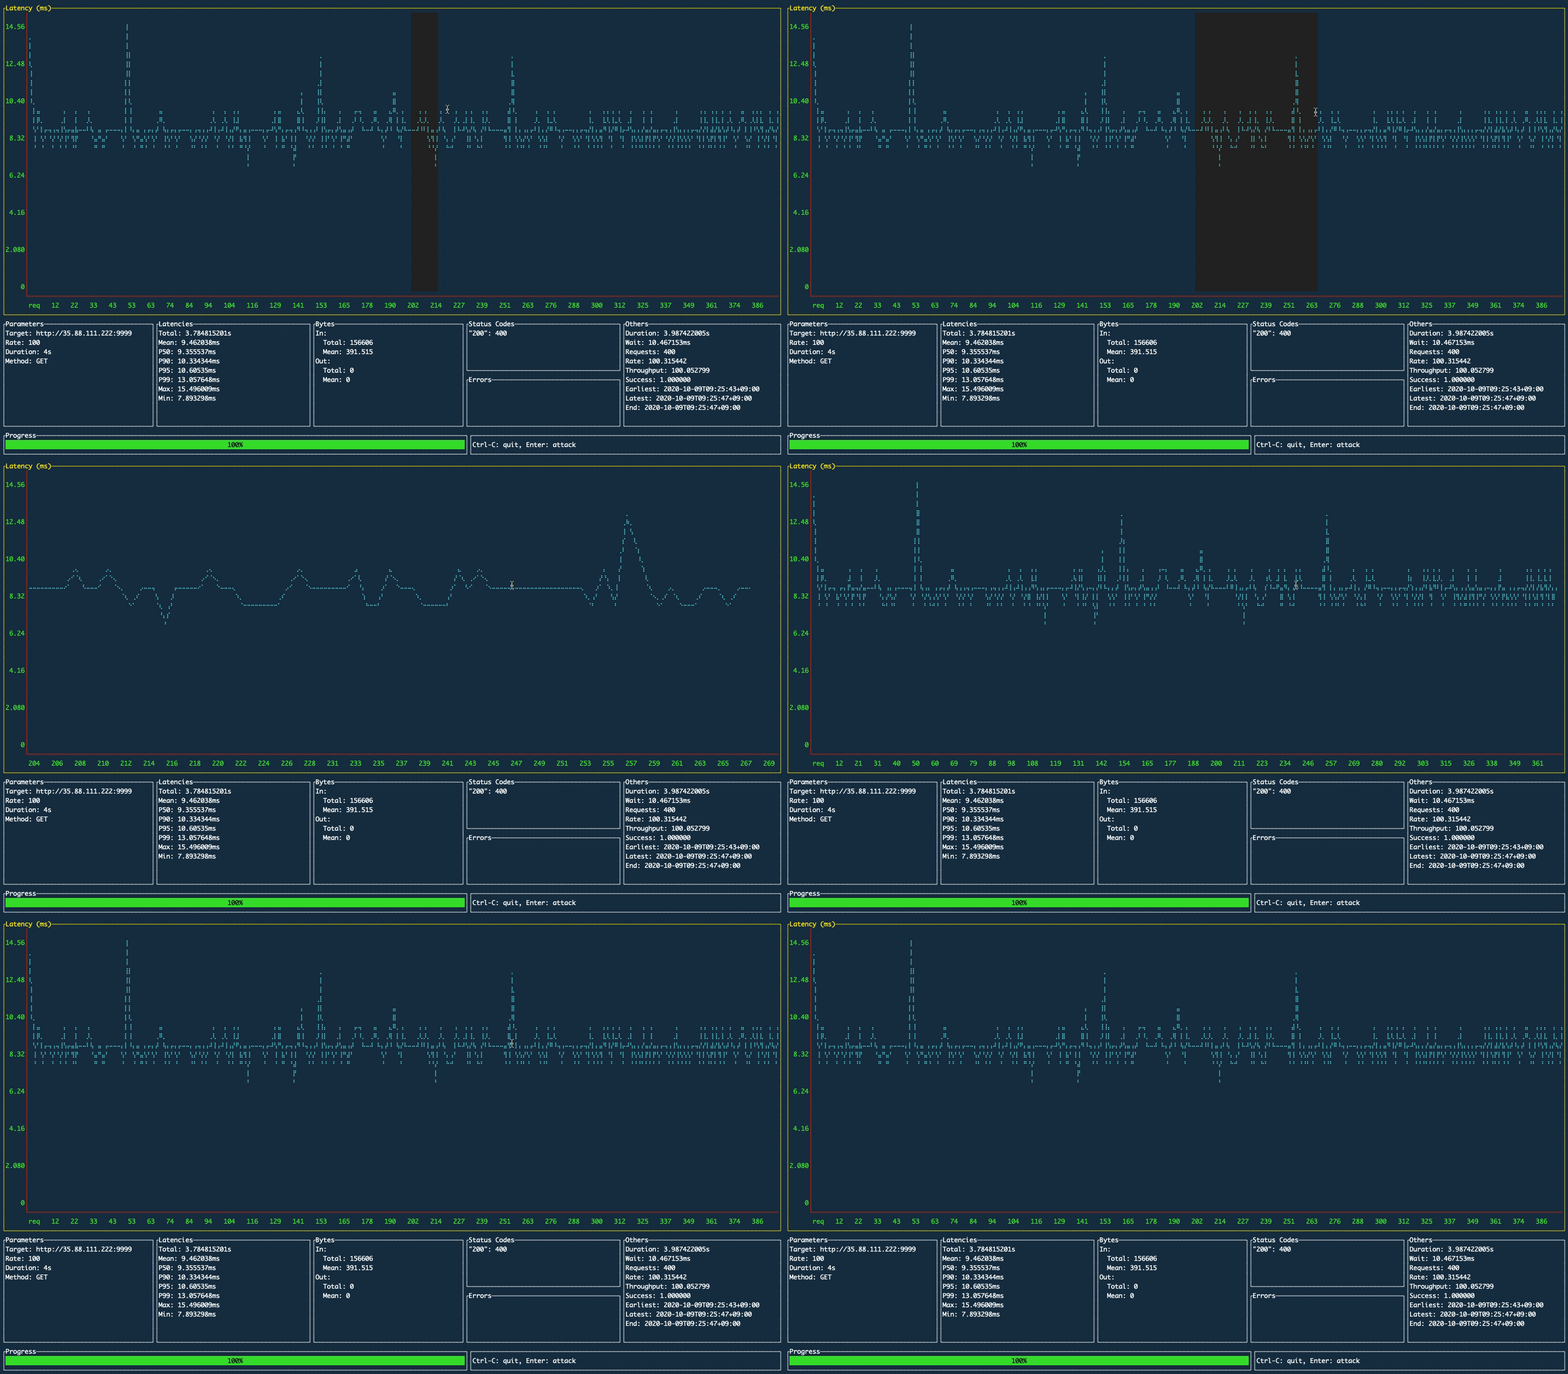
Press l (or h) to switch the displayed chart. On all charts, you can click and drag to select a region to zoom into.

Latency
Screenshot

The X-axis represents the request counts and the Y-axis represents latencies in milliseconds.

Percentiles
Screenshot

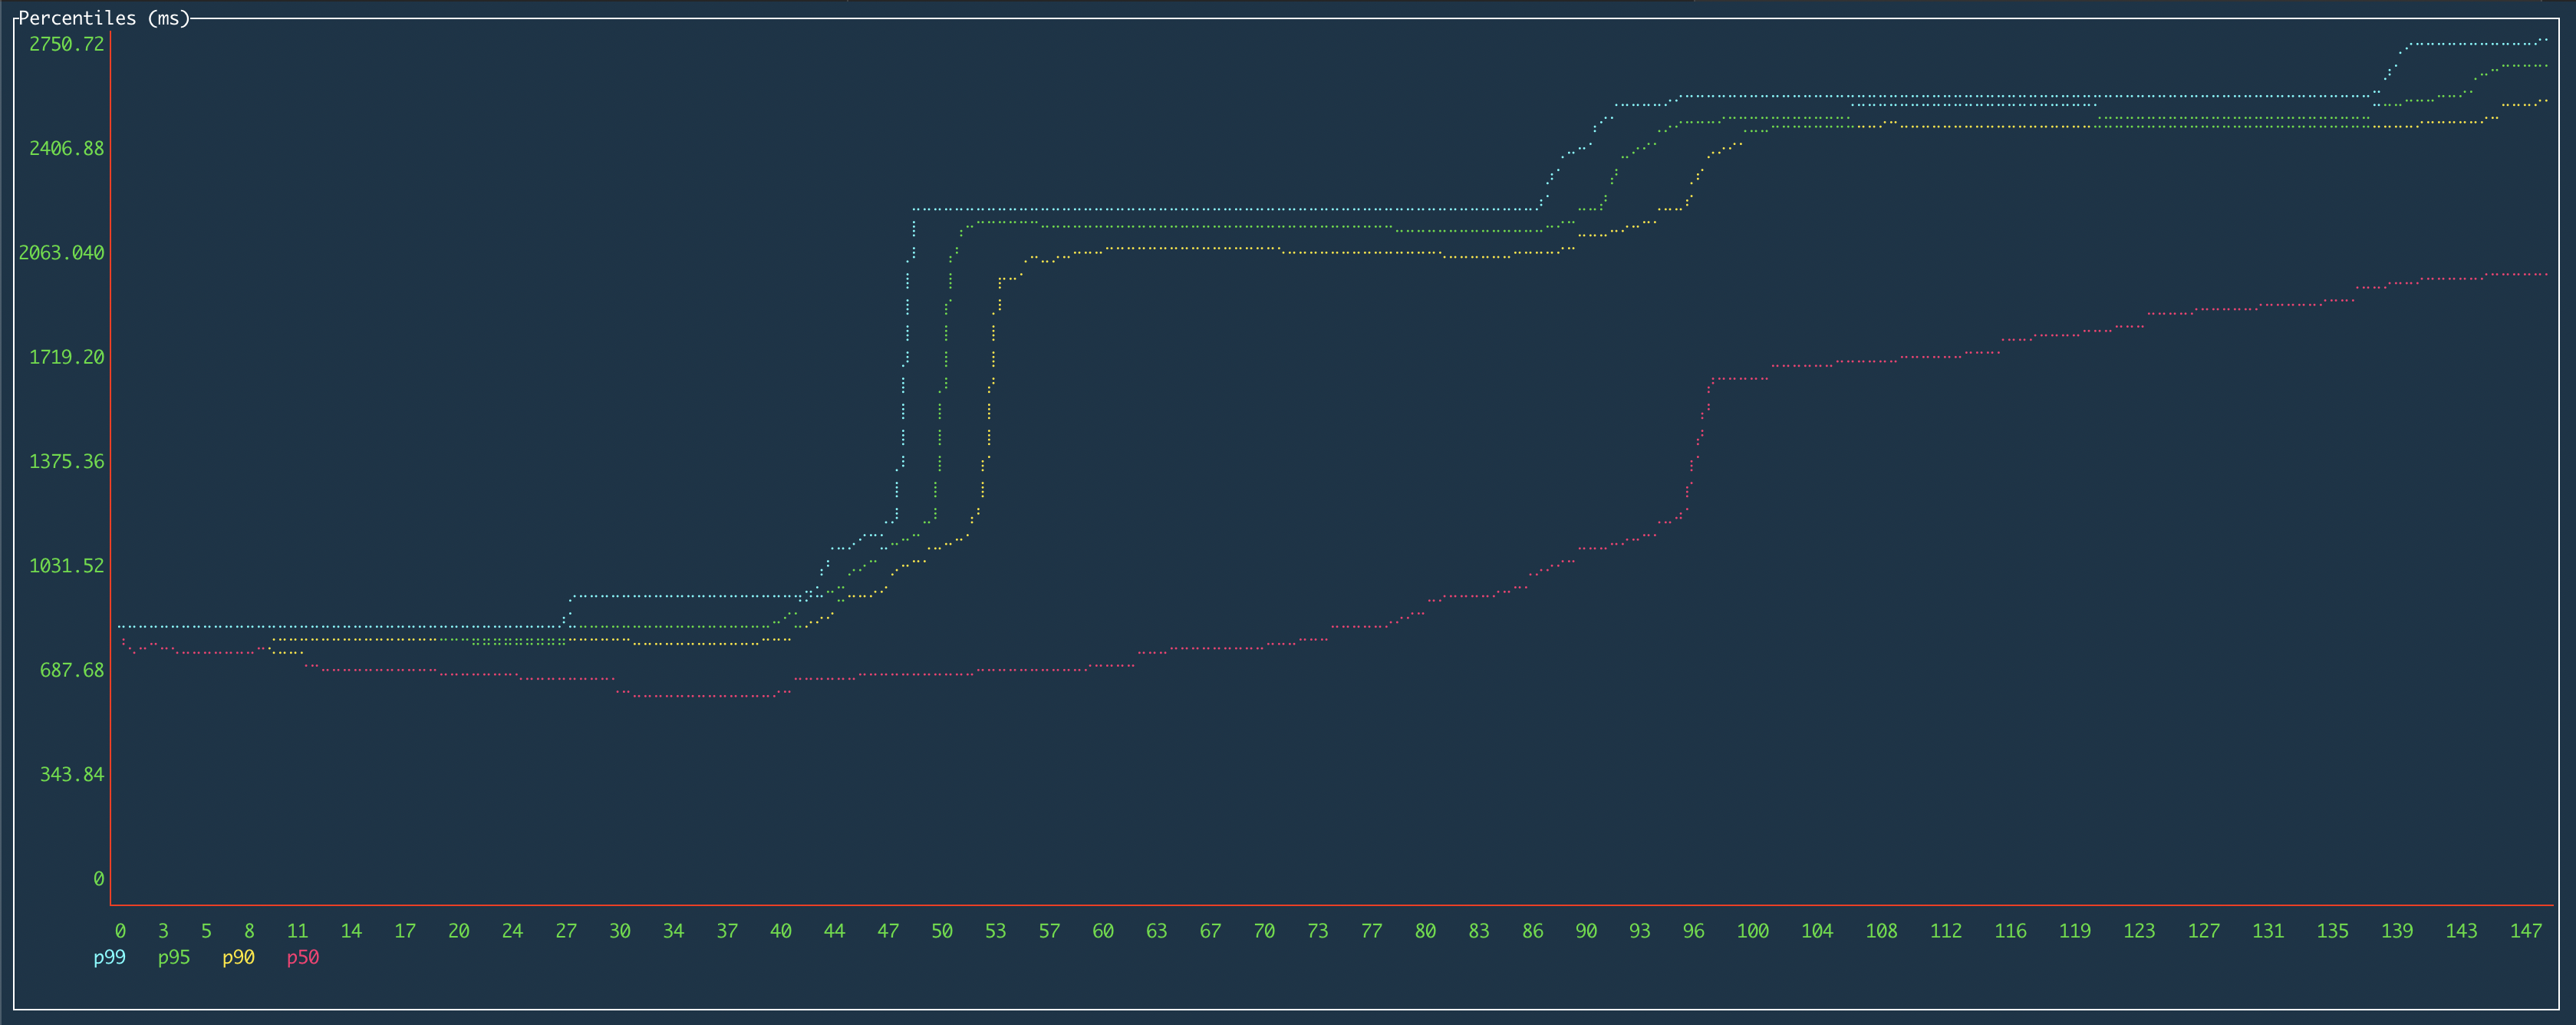
You can see how the 50th, 90th, 95th, and 99th percentiles are changing.

Bytes

TBA

Histogram

TBA

Features

Plot in real-time
Screenshot

Visualize the attack progress

This will help you during long tests.

Screenshot

Mouse support

With the help of mum4k/termdash can be used intuitively.
Screenshot

Export results

You can persist load test results for downstream processing.

ali --export-to ./results/

See here more details.

Acknowledgements

This project would not have been possible without the effort of many individuals and projects but especially vegeta for the inspiration and powerful API. Besides, ali is built with termdash (as well as termbox-go) for the rendering of all those fancy graphs on the terminal. They clearly stimulated an incentive to creation. A big "thank you!" goes out to all those who helped.

Frequently asked questions

Is ali free to use?

ali is open source under the MIT licence. There is no licence fee and no seat count — you can self-host it or, where the project offers one, pay a vendor for a managed version instead.

What does ali do?

Generate HTTP load and plot the results in real-time

What is ali written in?

ali is primarily written in Go. Its source is publicly available at https://github.com/nakabonne/ali, and it has 3,939 GitHub stars.