0xtools is a free, open source monitoring & observability project written in Python and released under GPL-2.0. It has 1,820 GitHub stars, 134 forks and 17 open issues, and was last pushed 10 months ago. On this registry it ranks #176 of 271 tracked projects in Monitoring & Observability, with 5 head-to-head comparisons available.

What is 0xtools?

0x.Tools is a GPL-2.0 Linux performance and observability toolkit, listed in this registry as Python, that gives engineers an X-ray view of what every thread on a running system is actually doing, from kernel space up.

What it is

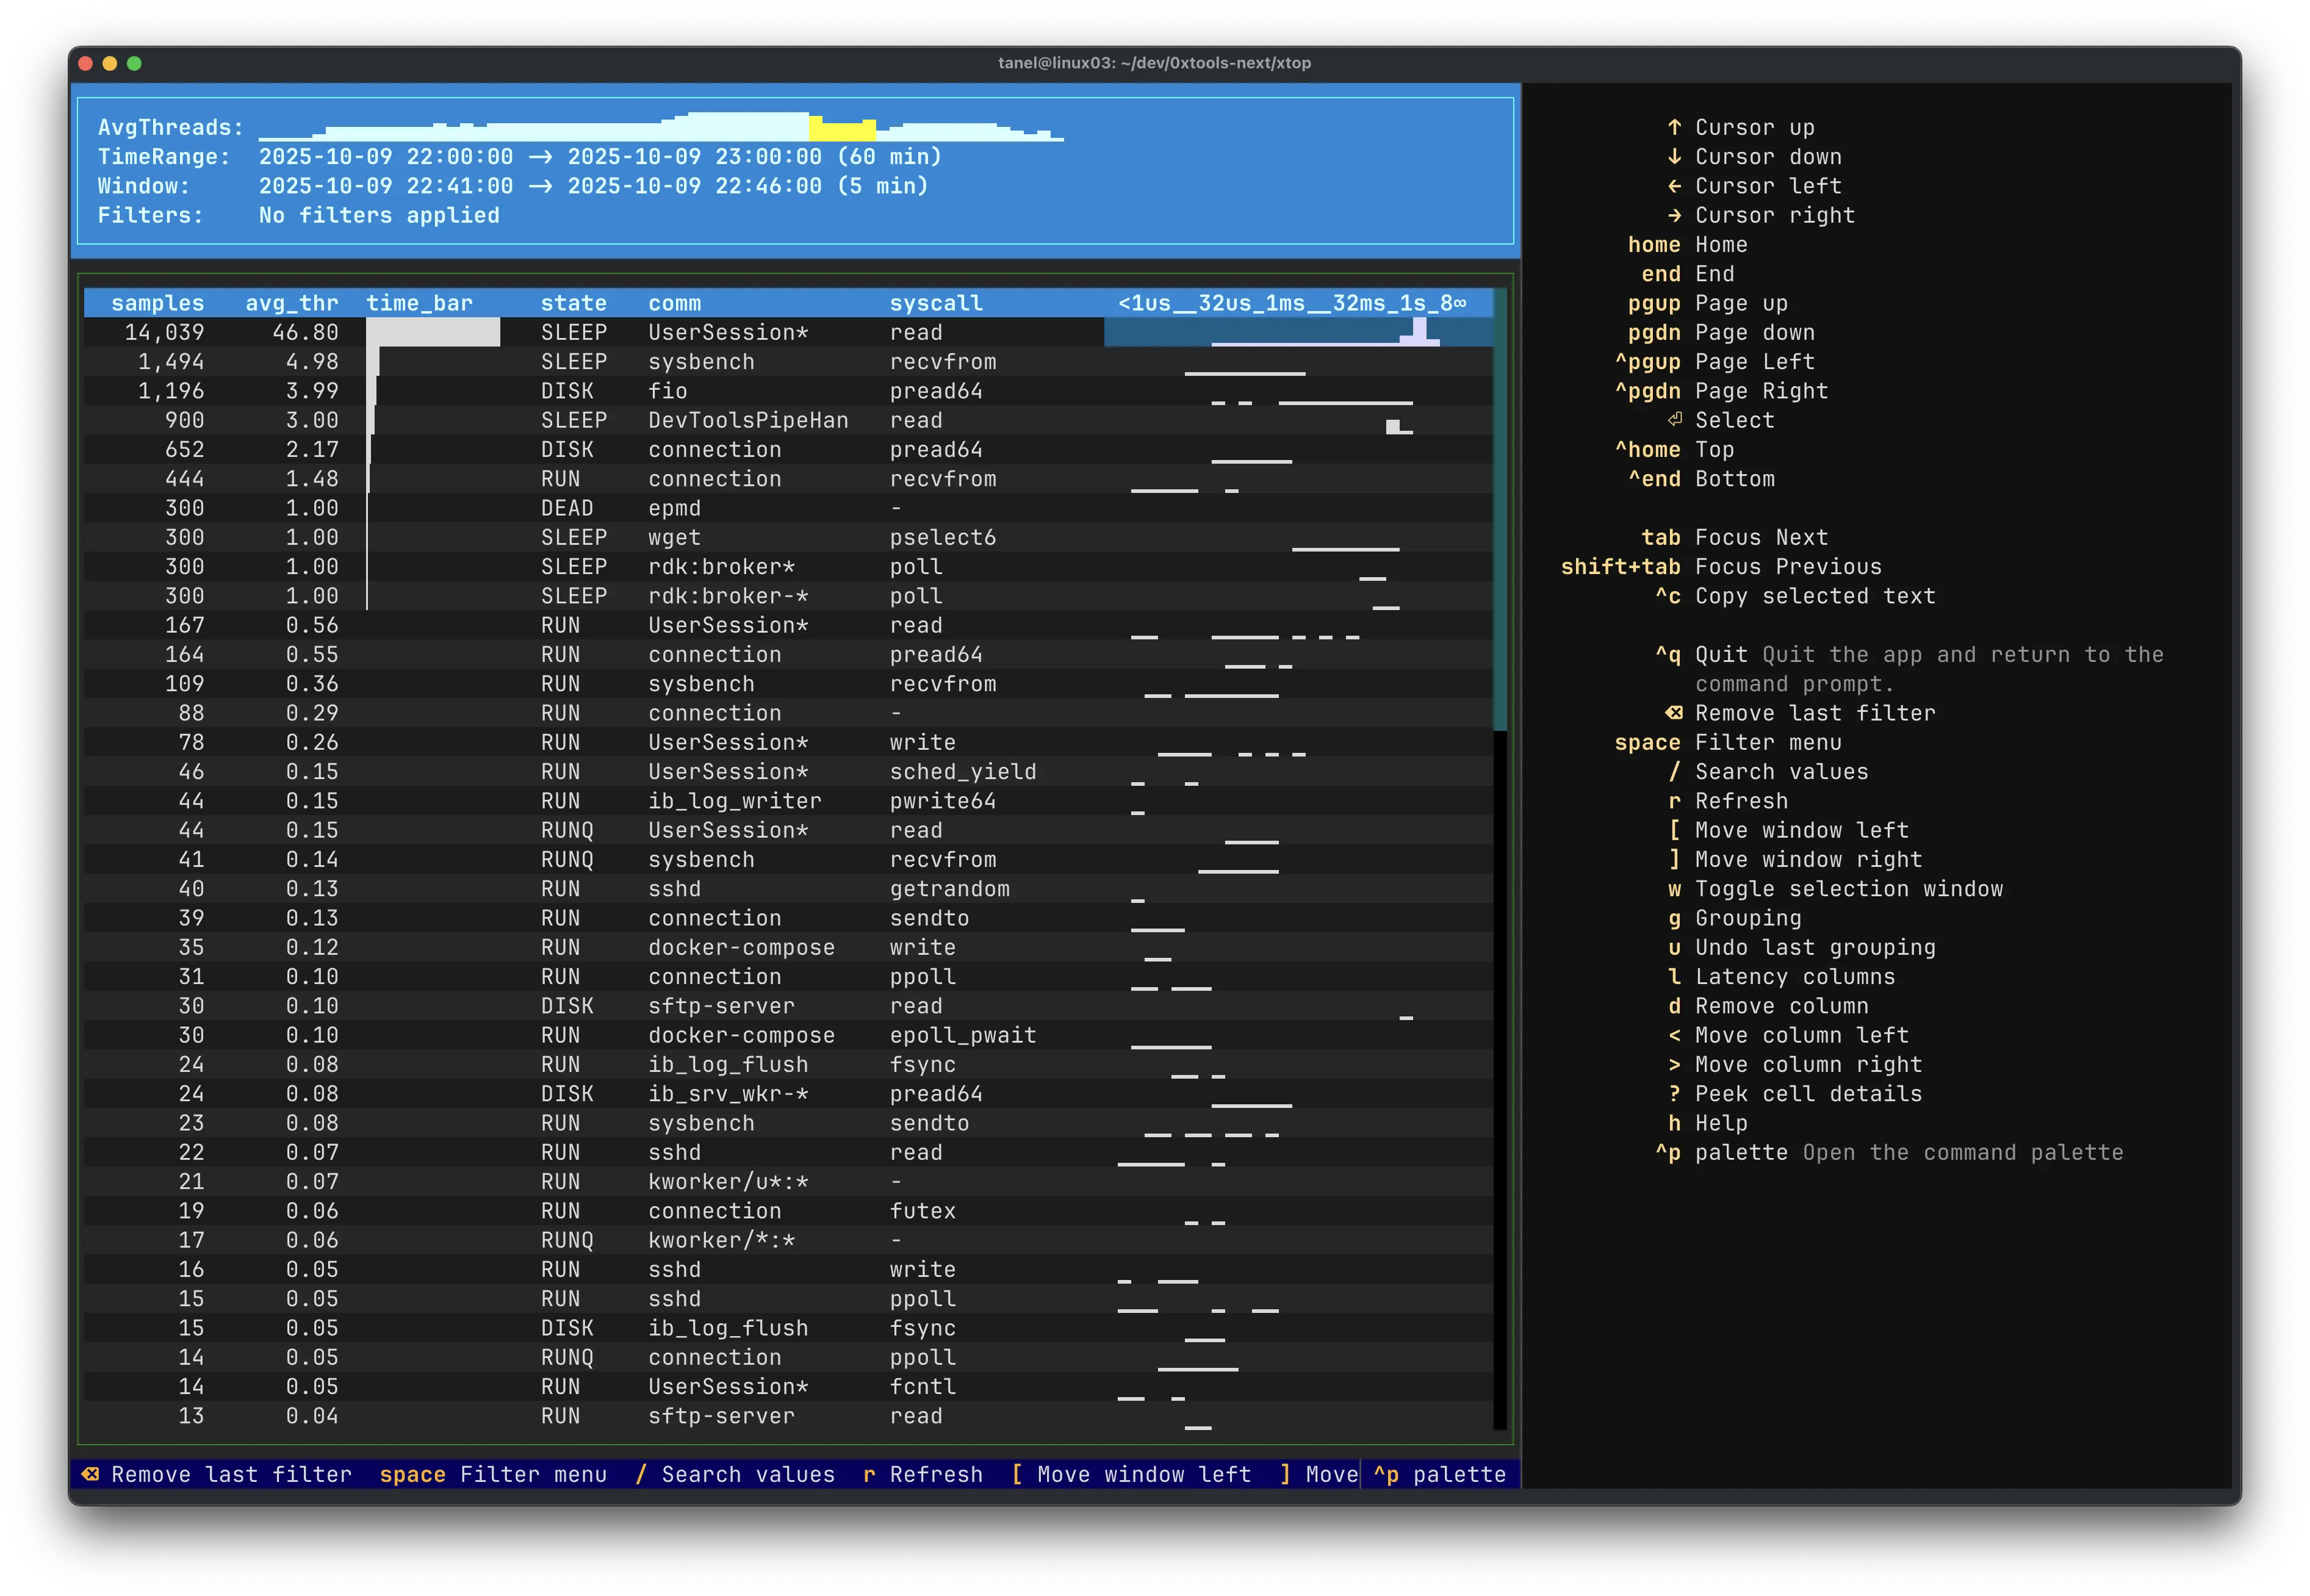
0x.Tools is a small collection of tools built around xcapture, a Linux thread-activity sampler. Its v3.0.3 release, dated 2025-10-23 and authored by Tanel Poder, is the first version built with modern eBPF rather than the earlier approaches the project used, which were based on bcc, on bpftrace, or simply on sampling and aggregating thread-level information out of /proc. The modern eBPF foundation means libbpf, CO-RE, BTF, BPF iterators and eBPF task storage, and it places the project squarely in the Linux observability, performance and troubleshooting ecosystem alongside the tracing tools that preceded it. A companion tool, xtop, provides a terminal UI for dimensional performance analysis of the sampled thread activity.

The concrete problem is that understanding why a Linux host is slow usually means either attaching ad-hoc tracers with short lifespans or reading /proc at whatever moment you happen to look. 0x.Tools replaces that with continuous, always-on collection. The xcapture program runs a sampling loop whose thread-state work executes inside the kernel through eBPF task iterators, while syscall and IO tracking happens automatically in kernel space as well; only the invocation and frequency of sampling are driven from userspace. The output is written as hourly CSV files, which the project describes as a dimensional data warehouse of Linux thread activity that can be analysed from any angle without having to change or update xCapture itself.

Key capabilities

  • xcapture binary built on modern eBPF (libbpf, CO-RE, BTF, BPF iterators, eBPF task storage), replacing the project's earlier bcc, bpftrace and /proc-sampling implementations.
  • Kernel-space syscall and IO tracking, with thread-state sampling executed through eBPF task iterators rather than userspace polling.
  • "Always on" production mode via the -o DIRNAME option, which appends samples to hourly CSV files; -o . writes to the current directory.
  • Developer mode, where sudo build/xcapture prints formatted fields straight to the terminal screen.
  • Privilege separation: root is required only to load the eBPF programs, while consumers of the output CSV files can be any regular user with filesystem read permission on the output directory.
  • xtop, a terminal UI for dimensional performance analysis of the sampled thread activity, with a screenshot in xtop/xtop.webp.
  • Two build paths, make for the full version and make old for the limited xcapture build on older kernels, plus xcapture --help for current functionality.

Who uses it and how

  • Performance and troubleshooting engineers diagnosing production Linux hosts, running the collector continuously rather than attaching an ad-hoc tracer per incident.
  • Teams that want separation of duties: a single root-run collector process per host, and analysts who read the resulting CSV files as ordinary users.
  • Hosts where all threads must be covered by one process; the userspace sampling driver is single-threaded, so only one instance per host is needed, and it is recommended to schedule it with high priority.
  • Environments on recent kernels, including RHEL9 with a 5.14+ kernel (RHEL 9.5 onwards has the backported 6.8 eBPF functionality), 5.18+ otherwise, and Ubuntu 24.04 on Linux 6.8 as the latest tested configuration.
  • Legacy estates only through the reduced feature set: Oracle UEK7 at 5.15 and older Ubuntu releases need make old to build the limited xcapture version.

Getting started

Clone https://github.com/tanelpoder/0xtools.git, install the system build packages for the distribution (libbpf, cmake, clang, llvm, libelf and zlib development packages), then run git submodule update --init --recursive, followed by cd xcapture, make and sudo build/xcapture. For continuous collection, run sudo TZ=:/etc/localtime chrt -r 30 xcapture -vo DIRNAME.

How it compares

The facts do not list commercial products that 0x.Tools replaces, so the comparison that matters is with the tools named in its own history: bcc, bpftrace, and sampling thread-level information from /proc. Those approaches are attach-and-observe or point-in-time; 0x.Tools keeps the tracking and sampling in kernel space and lands the result as hourly CSV that can be queried later, with xtop layered on top for interactive dimensional analysis.

When to use it — and when not to

Use it when the kernel floor can be met, since modern eBPF here means Linux 5.11 or later for eBPF task storage, and full functionality may need 5.14+ on RHEL9 or 5.18+ elsewhere. Be prepared to build from source with cmake, clang, llvm and libbpf rather than install a distribution package, and to run the collector as root. Skip it on older kernels where only the limited make old build is available, and treat the README as a release note rather than a manual: it points to blog posts for the reasoning, the homepage is a blog article on the xcapture/xtop beta, and the project carries 17 open issues.

project readme (upstream, from github) — read inline

xCapture v3.0.3

By Tanel Poder 2025-10-23

This is the first ever release of 0x.tools xCapture tool that is built with modern eBPF! My previous tools and prototypes were using either bcc, bpftrace or were just sampling and aggregating thread level info from /proc files.

xtop terminal ui

Requirements

Modern eBPF means libbpf, CORE, BTF, BPF iterators, etc. I'll write about my learning journey with proper thank you notes soon.

In practice this means you'll need to be on a Linux kernel 5.11 or up (eBPF task storage). xCapture v3 is a future-facing tool, so I'll invest the time in that direction and not worry about all the legacy systems out there (unlike my approach was with all my previous tools was).

This means, RHEL9+ on Linux 5.14, or Oracle Enterprise Linux 8+, as long as you run at least their UEK7 Linux kernel (5.15). Ubuntu has pretty new kernels (and they have the HWE versions), so Ubuntu 20+ with the latest HWE kernel available for it should work. I have done my latest tests on Ubuntu 24.04 on Linux 6.8 though (will keep you updated once I test more).

Currently you'd have to be either on a RHEL9 5.14+ kernel or 5.18+ otherwise (for all functionality). RedHat backported 6.8 eBPF functionality to their 5.14 kernel (RHEL 9.5 onwards). For older kernels without such backports, notably 5.15 used by Oracle UEK7 kernel and older Ubuntu, use "make old" to build the limited xcapture version.

Building xcapture v3

git clone https://github.com/tanelpoder/0xtools.git
cd 0xtools

Install required system packages for compiling the binary:

On Ubuntu 20.04+ with HWE kernel 5.15+:

sudo apt install make cmake gcc pkg-config libbpf-dev libbpf-tools clang llvm libbfd-dev libelf1 libelf-dev zlib1g-dev

On RHEL9 with RHEL 5.14+ kernel (with RedHat backports):

sudo dnf install libbpf libbpf-tools cmake clang llvm-devel binutils-devel elfutils-libelf elfutils-libelf-devel zlib-devel

To install required libbpf dependencies for the GitHub repo, run:

git submodule update --init --recursive

Running xcapture in developer mode

By default, xcapture prints some of its fields as formatted output to your terminal screen:

cd xcapture
make
sudo build/xcapture

The "always-on" production mode for appending samples to hourly CSV files is enabled by the -o DIRNAME option. You can use -o . to output to your current directory.

While XCapture requires root privileges to load its eBPF programs and do its sampling, the consumers of the output CSV files do not have to be root! They can be any regular user who has the Unix filesystem permissions to read the output directory and CSV files. This provides a nice separation of duties. And you can analyze the "dimensional data warehouse" of Linux thread activity from any angle you want, without having to update or change XCapture itself.

You can also run xcapture --help to get some idea of its current functionality.

NB! While all the syscall & IO tracking action happens automatically in the kernel space, the simulatneous sampling of the tracked events is driven by the userspace xcapture program. The thread state sampling loop actually runs completely inside the kernel too, thanks to eBPF task iterators, but the invocation and frequency of the sampling is driven by the userspace program.

Therefore it makes sense to schedule the userspace "sampling driver" with a high scheduling priority, to get consistently reoccurring samples from it. I run it like this and recommend that you do too:

cd build
sudo TZ=:/etc/localtime chrt -r 30 xcapture -vo DIRNAME

The chrt puts the userspace xcapture program into real-time scheduling class. It's a single, single-threaded process and you'll only need to run only one in the host and it can monitor all threads in the system. By default it wakes up once per second and tells the eBPF task iterator to do its sampling, gets results via an eBPF ringbuf and writes the records either to STDOUT or CSV files.

The entire sampling loop itself is very quick, from ~100us in my laptop VMs, to ~20ms per wakeup in a large NUMA machine with 384 CPUs. So, XCapture passive sampling at 1Hz without active tracking of event latencies has only taken between 0.01% and 2% of a single CPU in my servers! (The 2% of-a-single-CPU result is from my AMD EPYC server with 384 CPUs :-)

The TZ:=/etc/localtime setting gives you two things:

  1. You can choose your own human wall-clock timezone in which to print out various timestamps. You can set TZ= (to empty value) to get times in UTC. The kernel and eBPF programs don't deal with human time internally, the CLOCK_MONOTONIC clock-source I'm using is just stored as number of nanoseconds from some arbitrary point in the past.
  2. The timezone environment variable also reduces xcapture userspace CPU usage, as otherwise it would go and check some /etc/localtimezone file or something like that on every snprintf() library call.

xtop and demo workload files

If you want to run xtop, install python dependencies to your personal virtual environment (or use uv or pipx):

. .venv/bin/activate # change to where your venv is
pip install duckdb textual

cd xtop
export TERM=xterm-256color
export XCAPTURE_DATADIR=demo # demo workload files under xtop/demo
./xtop

That's all!

Follow the news and developments at my blog tanelpoder.com

Frequently asked questions

Is 0xtools free to use?

0xtools is open source under the GPL-2.0 licence. There is no licence fee and no seat count — you can self-host it or, where the project offers one, pay a vendor for a managed version instead.

What does 0xtools do?

0x.Tools: X-Ray vision for Linux systems

What is 0xtools written in?

0xtools is primarily written in Python. Its source is publicly available at https://github.com/tanelpoder/0xtools, and it has 1,820 GitHub stars.